Downloaded 246 times


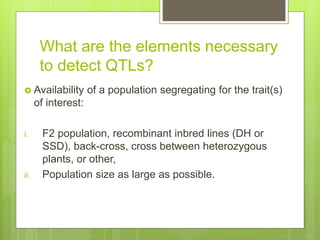

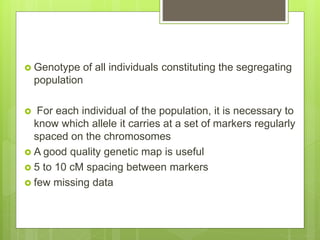


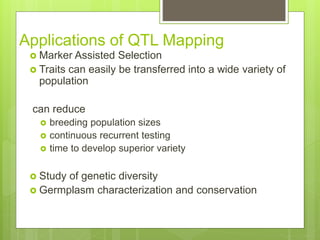

This document discusses quantitative trait loci (QTL) mapping. It defines QTLs as locations of genes that influence quantitative traits, which are traits measured on a continuous scale, like height. QTL mapping involves detecting statistical associations between genetic markers and quantitative traits in a segregating population to locate QTLs within the genome. Successful QTL mapping requires a population segregating for the trait, genotyping individuals for DNA markers, phenotyping individuals for the trait, and using statistical methods to test for associations between markers and traits. QTL mapping can be used for marker-assisted selection and to study the genetic basis of complex traits.