
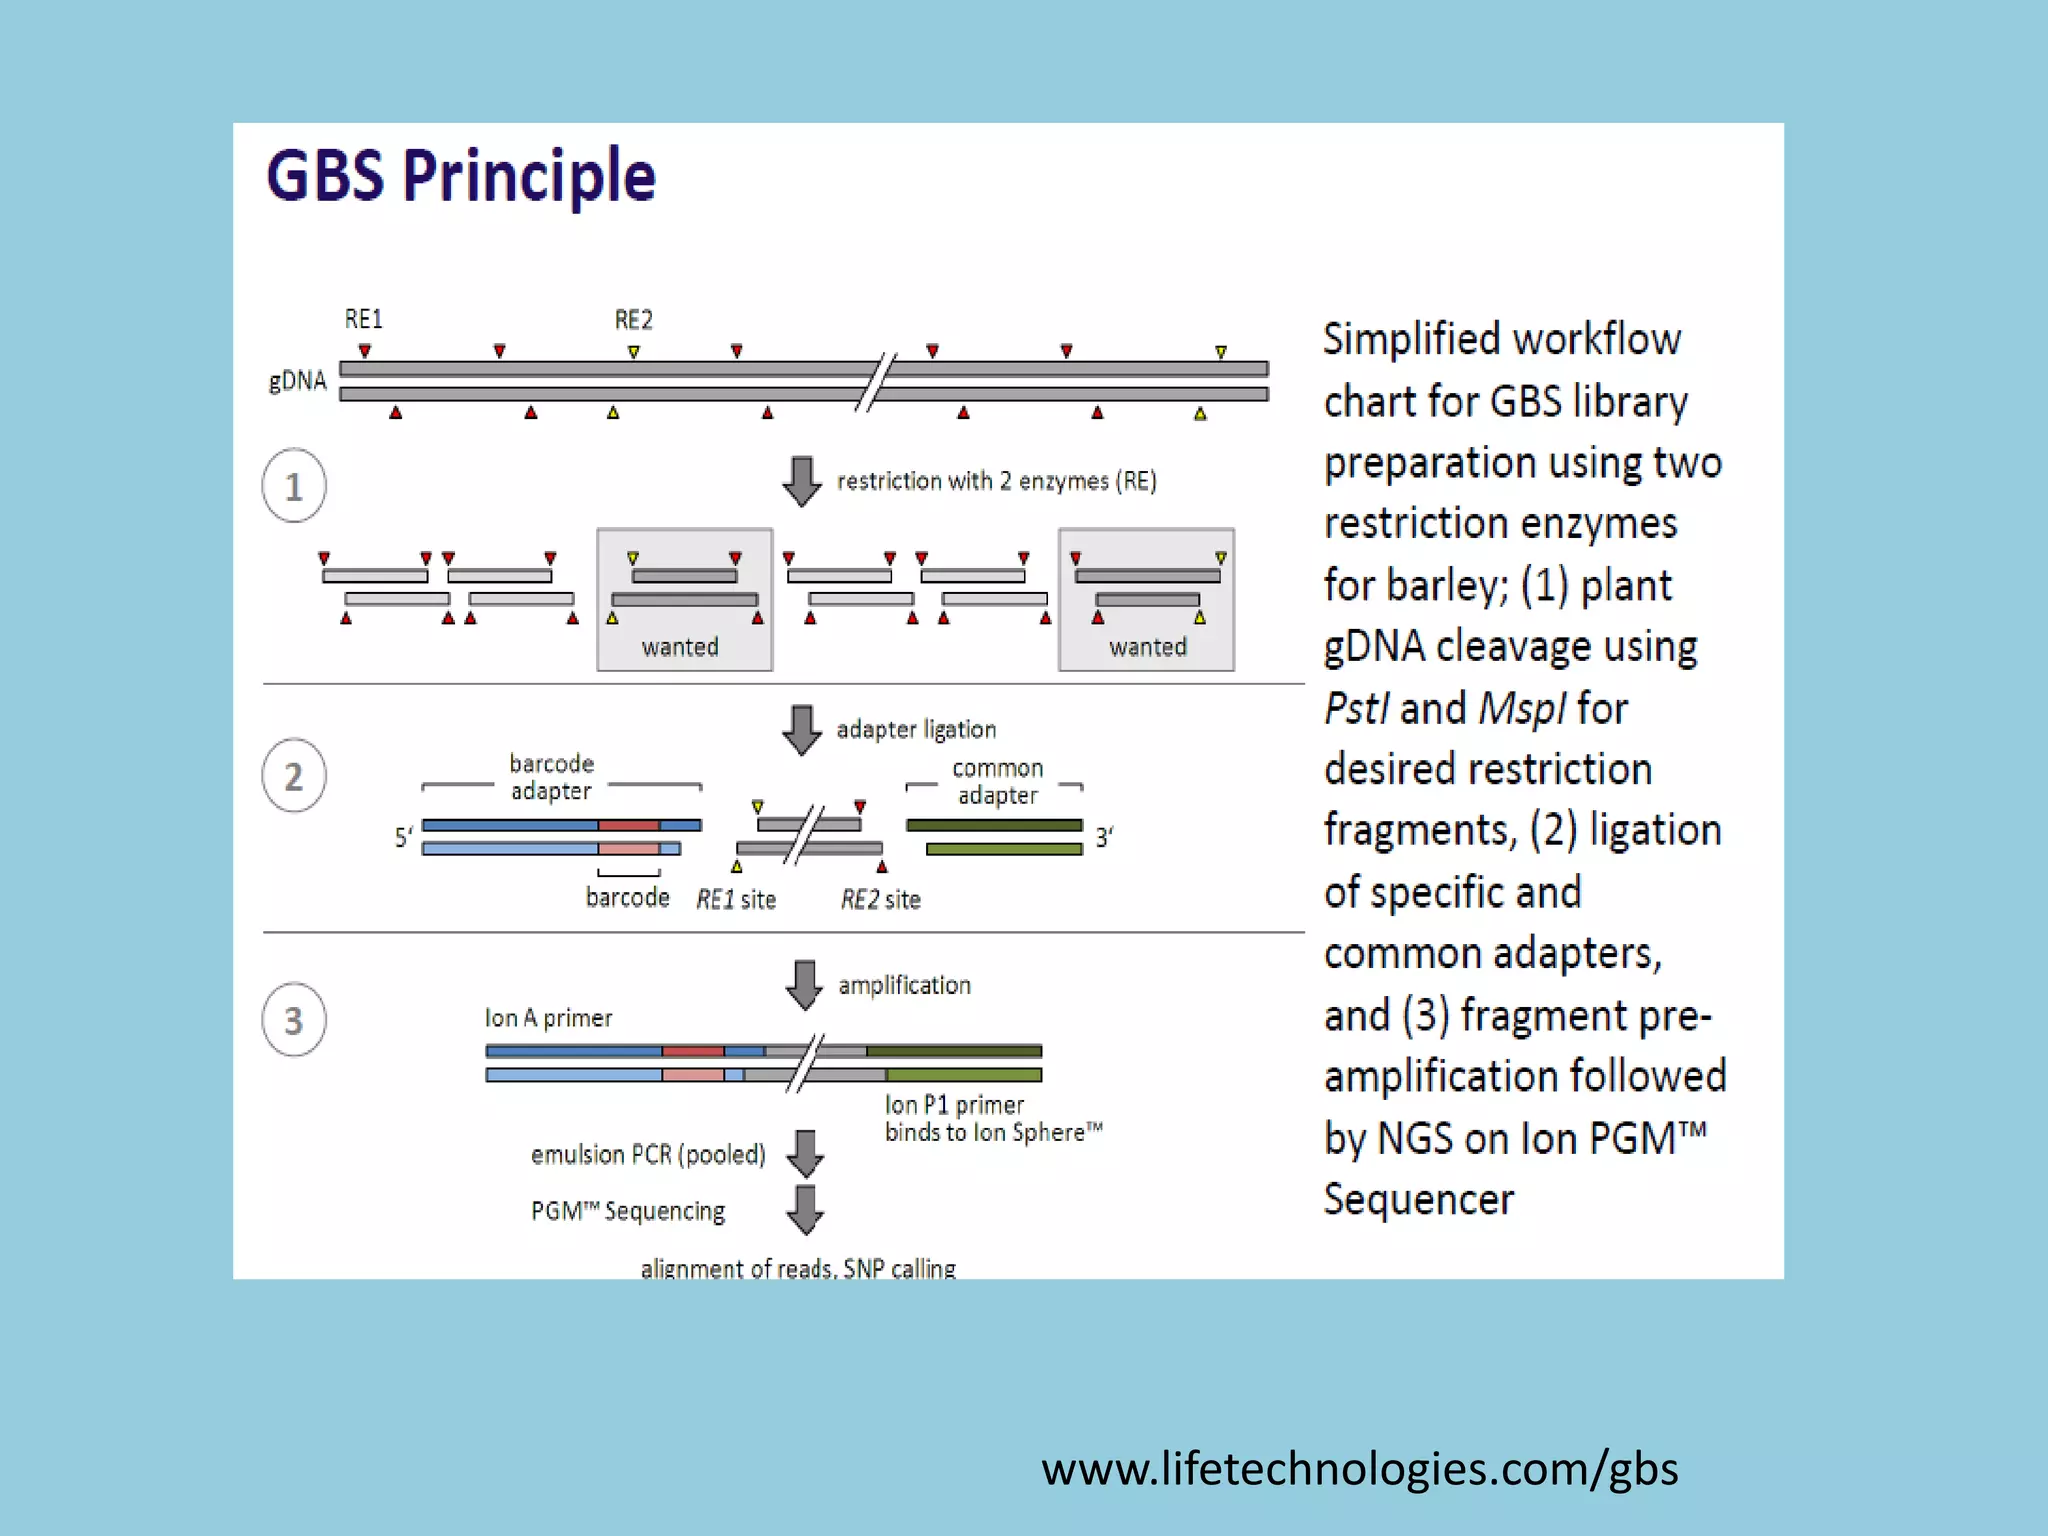
![For barley the original GBS protocol has been extended to a
two-restriction-enzyme system .
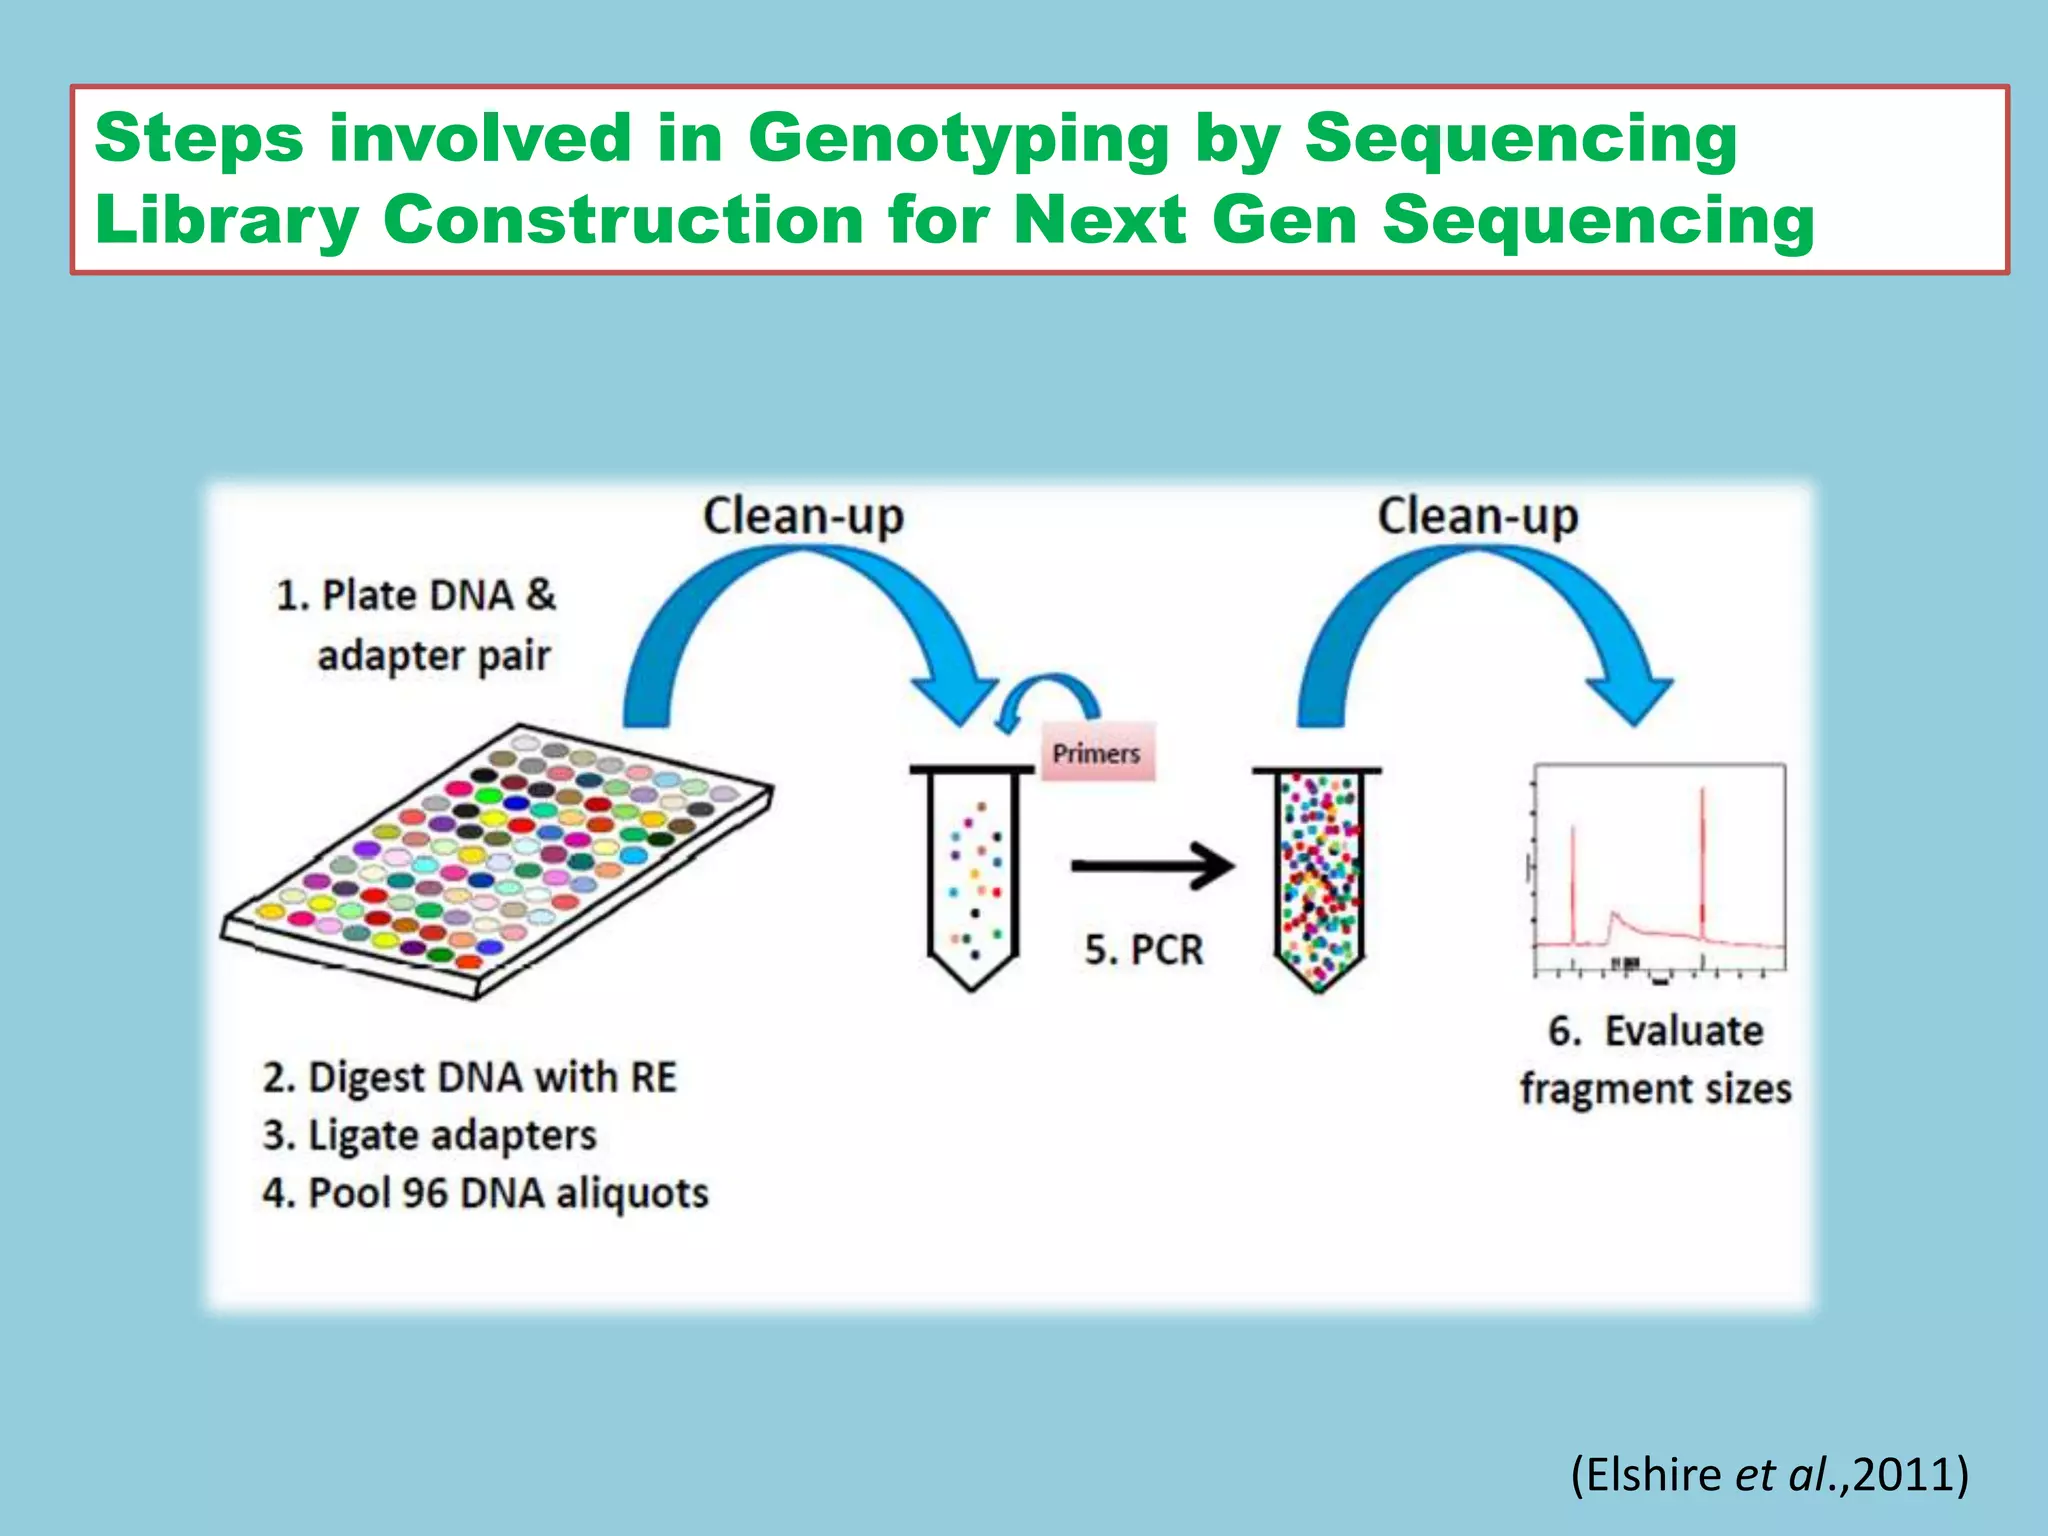
[1] Elshireet al. (2011) A Robust, Simple Genotyping-by-
Sequencing (GBS) Approach for High Diversity Species.
PLoSONE 6(5): e19379. doi:10.1371/journal.pone.0019379
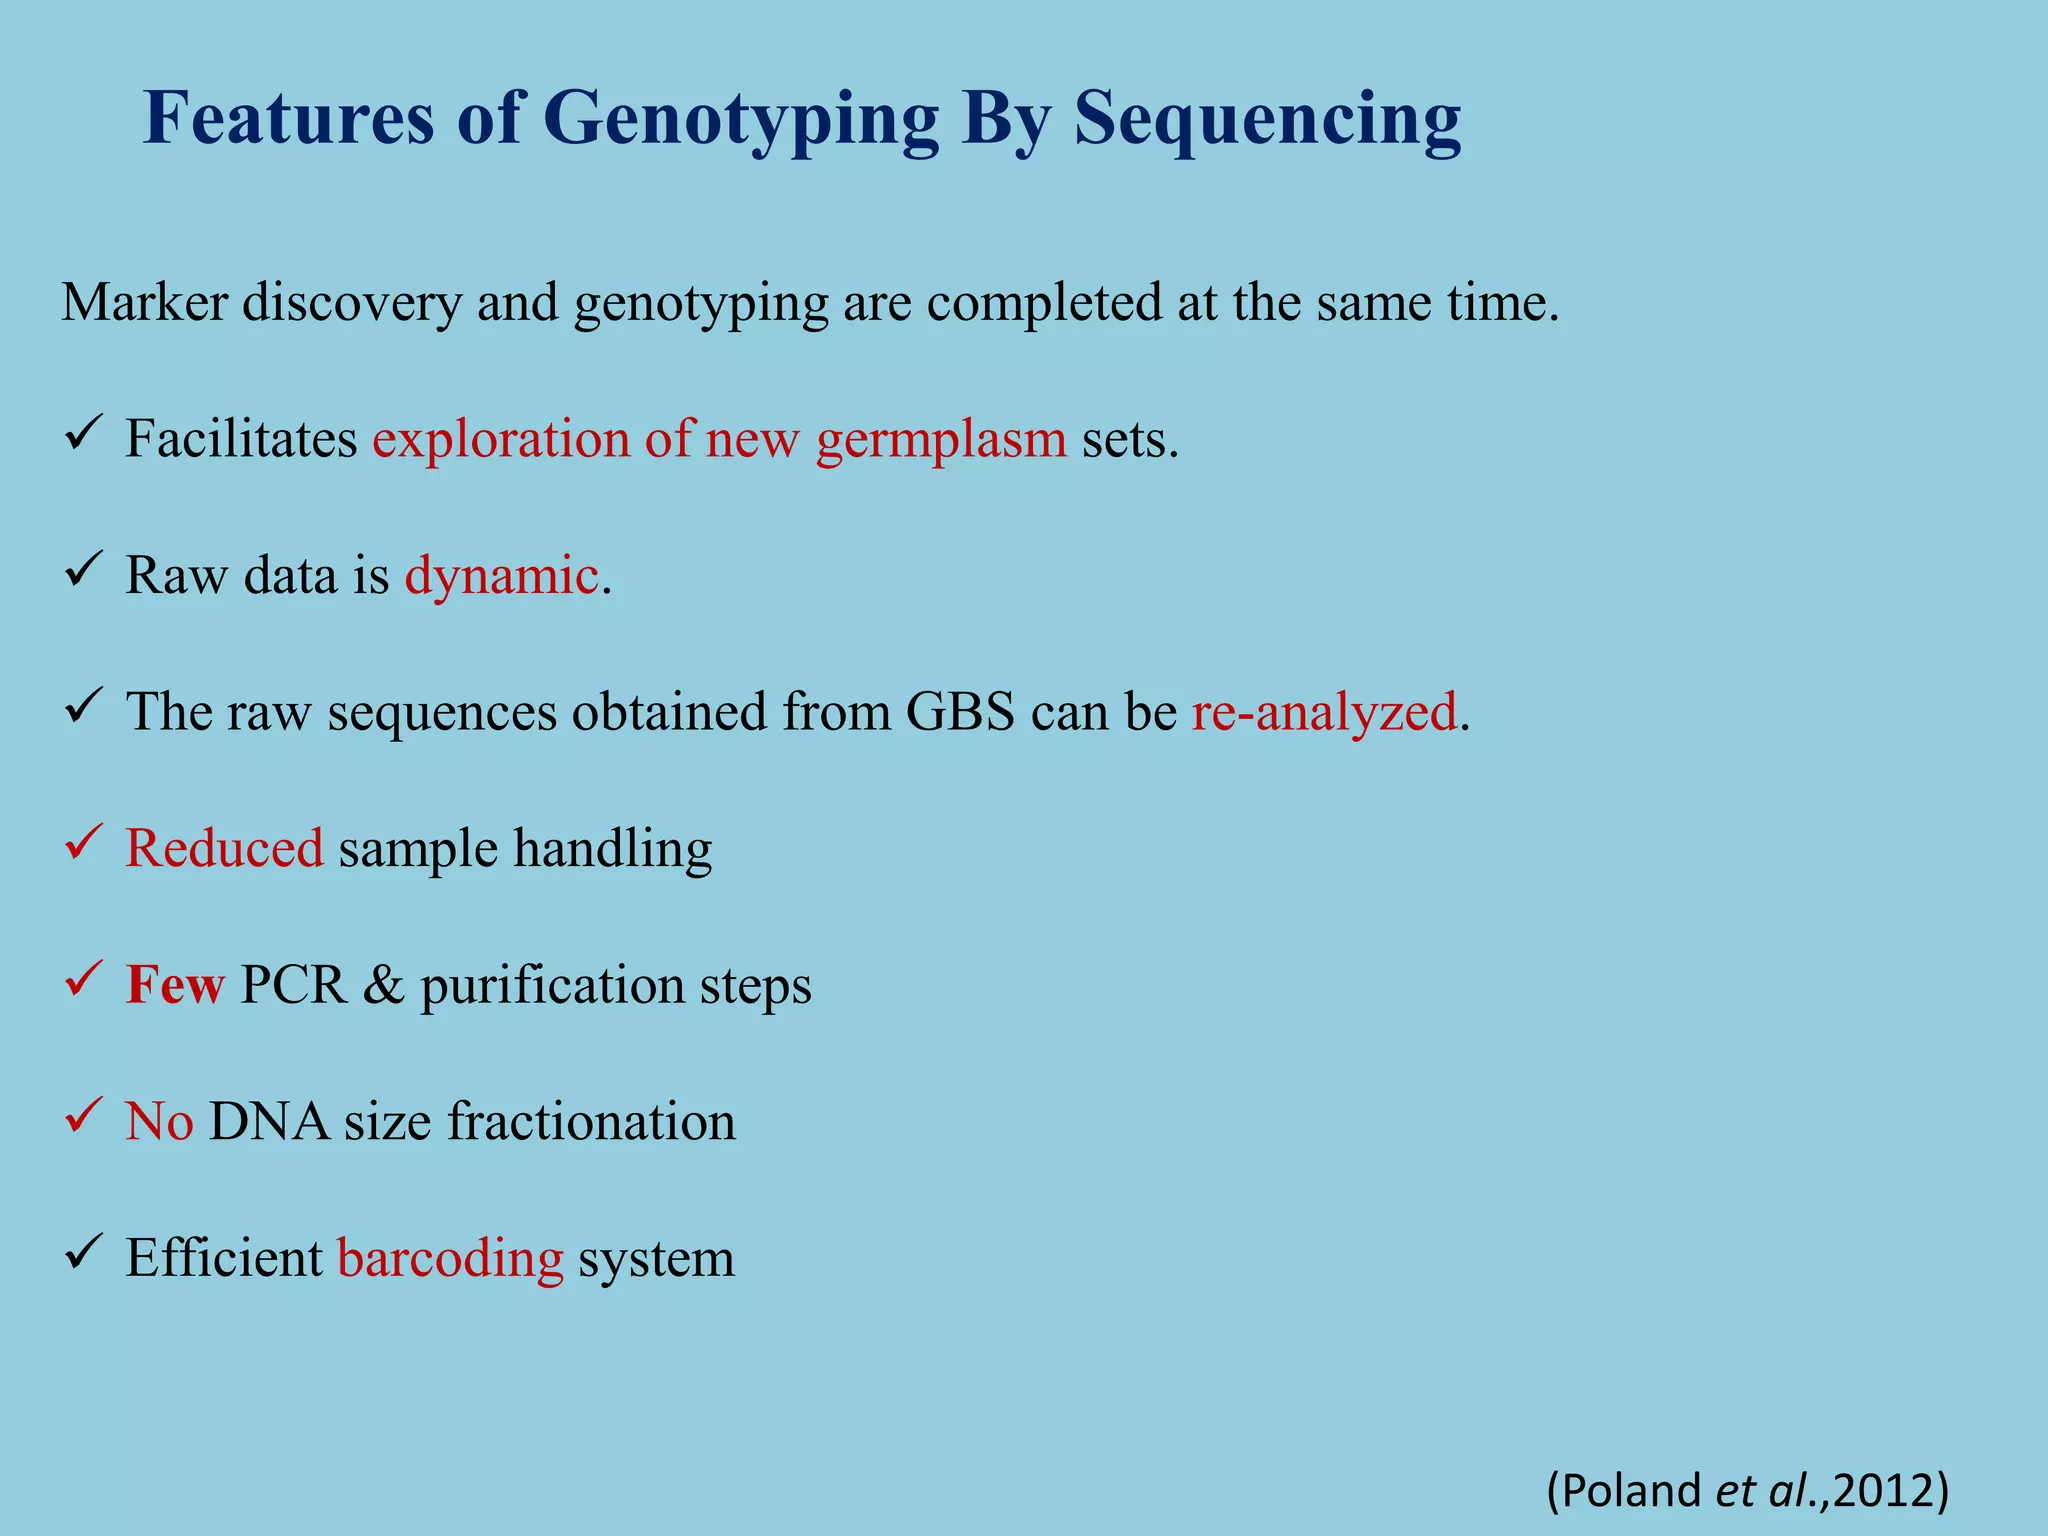
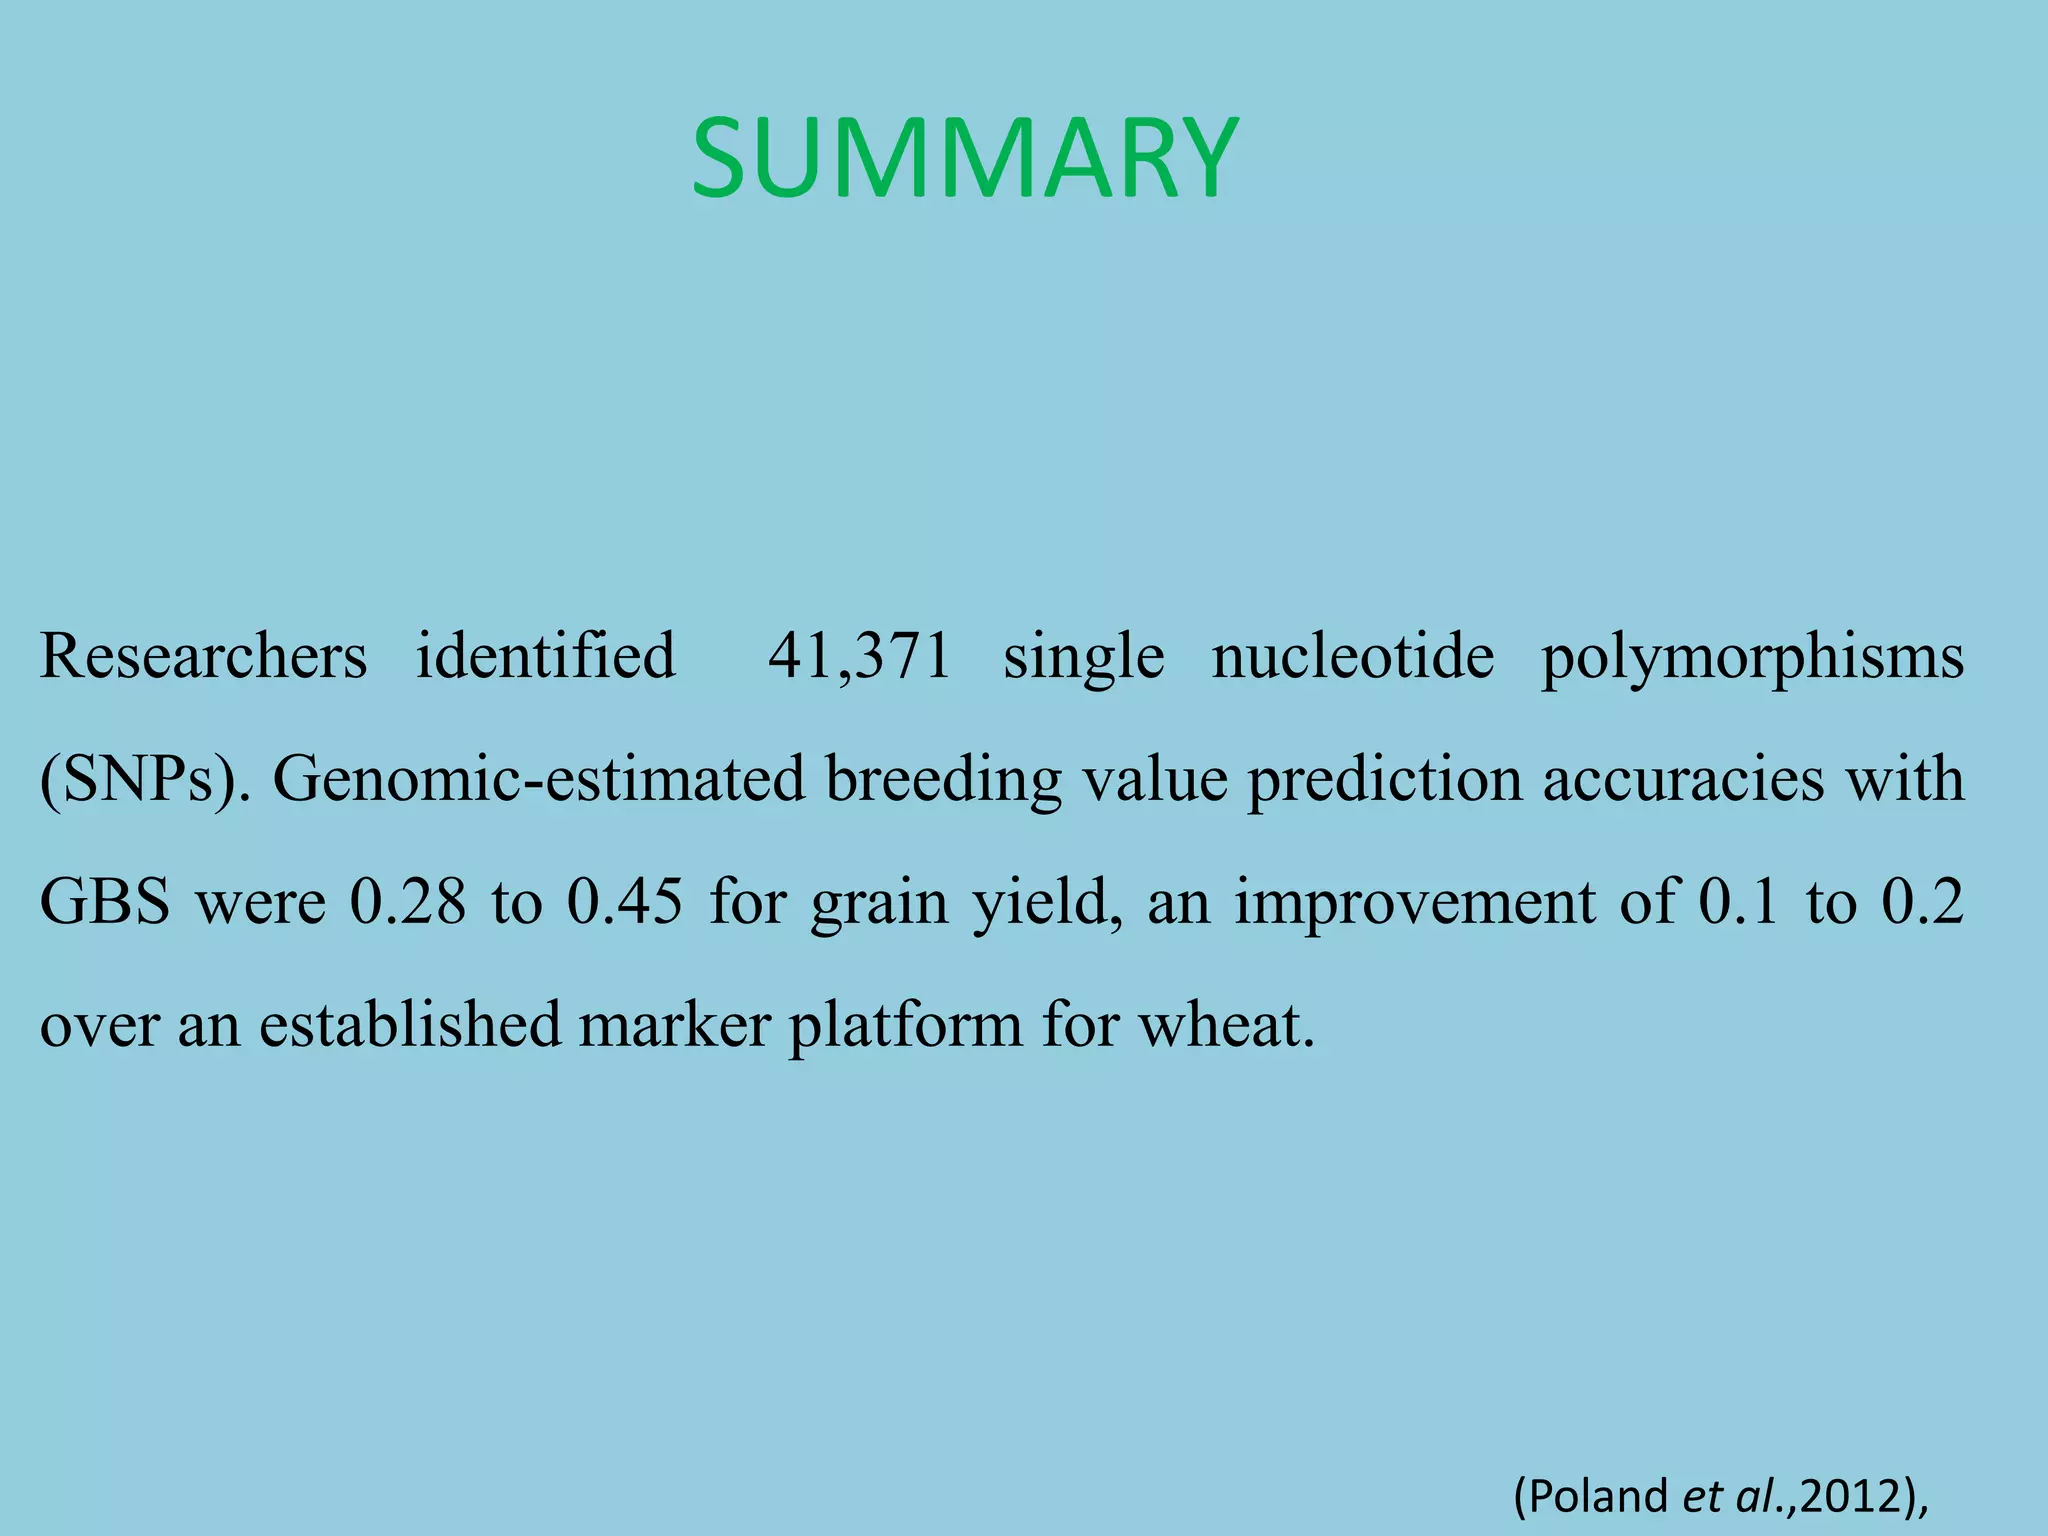
[2] Poland et al., (2012) Development of High-Density
Genetic Maps for Barley and Wheat Using a Novel Two-
Enzyme Genotyping-by-Sequencing Approach. PLoSONE
7(2): e32253. doi:10.1371/journal.pone.0032253](https://image.slidesharecdn.com/presentation1-130611054233-phpapp02/75/Genotyping-by-Sequencing-54-2048.jpg)
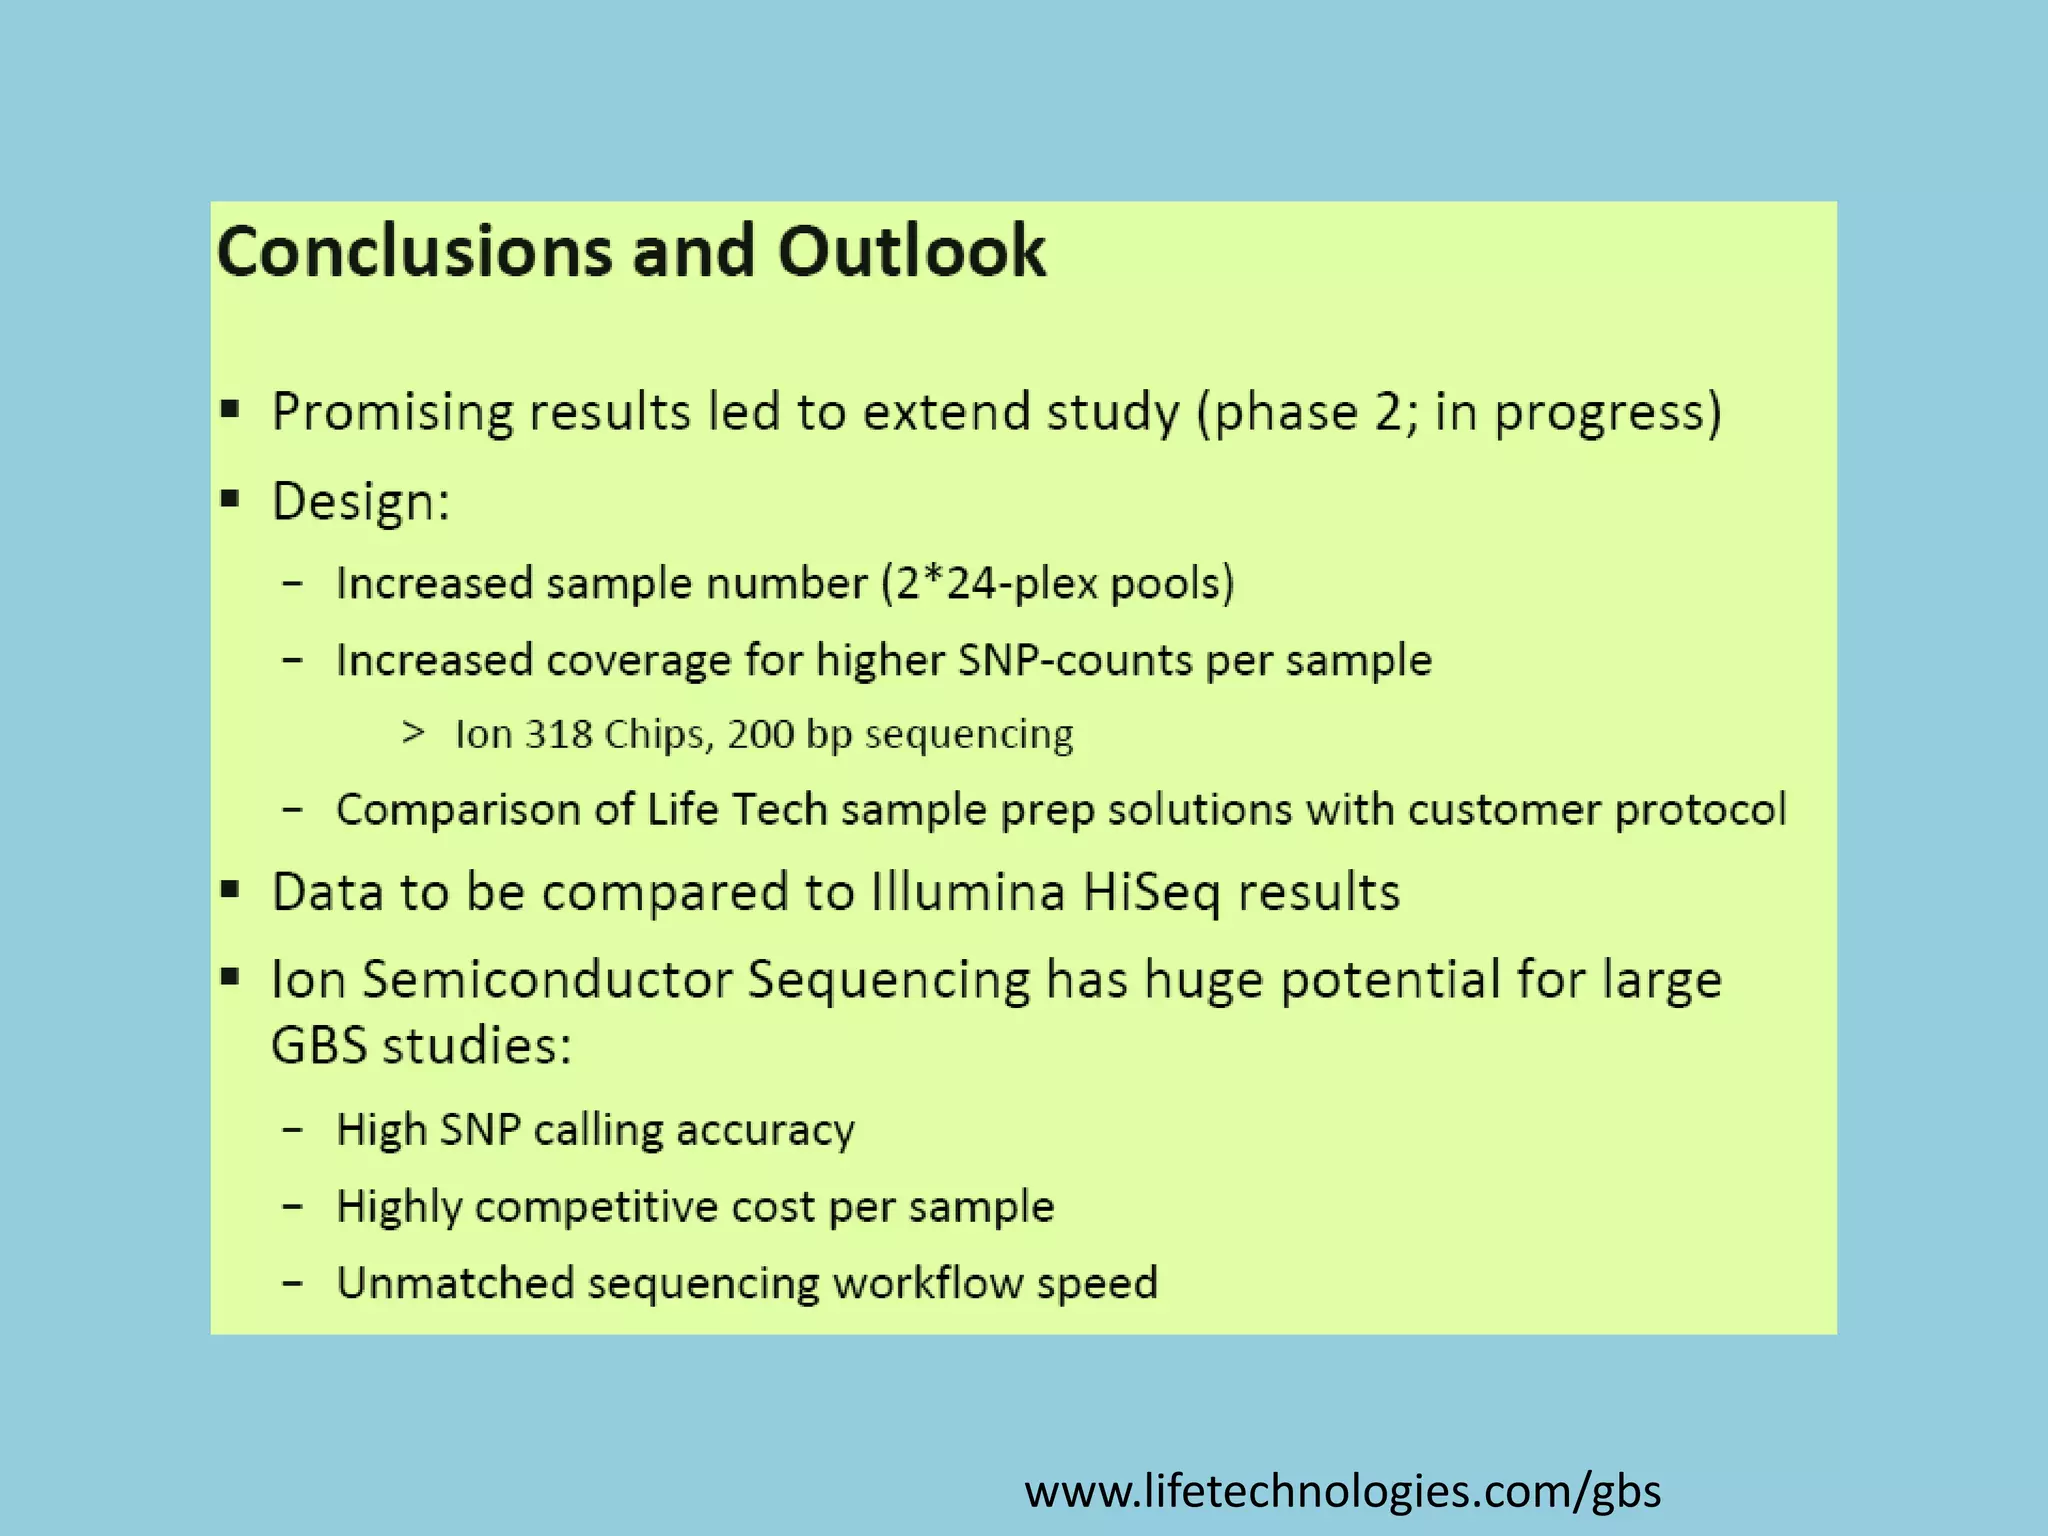
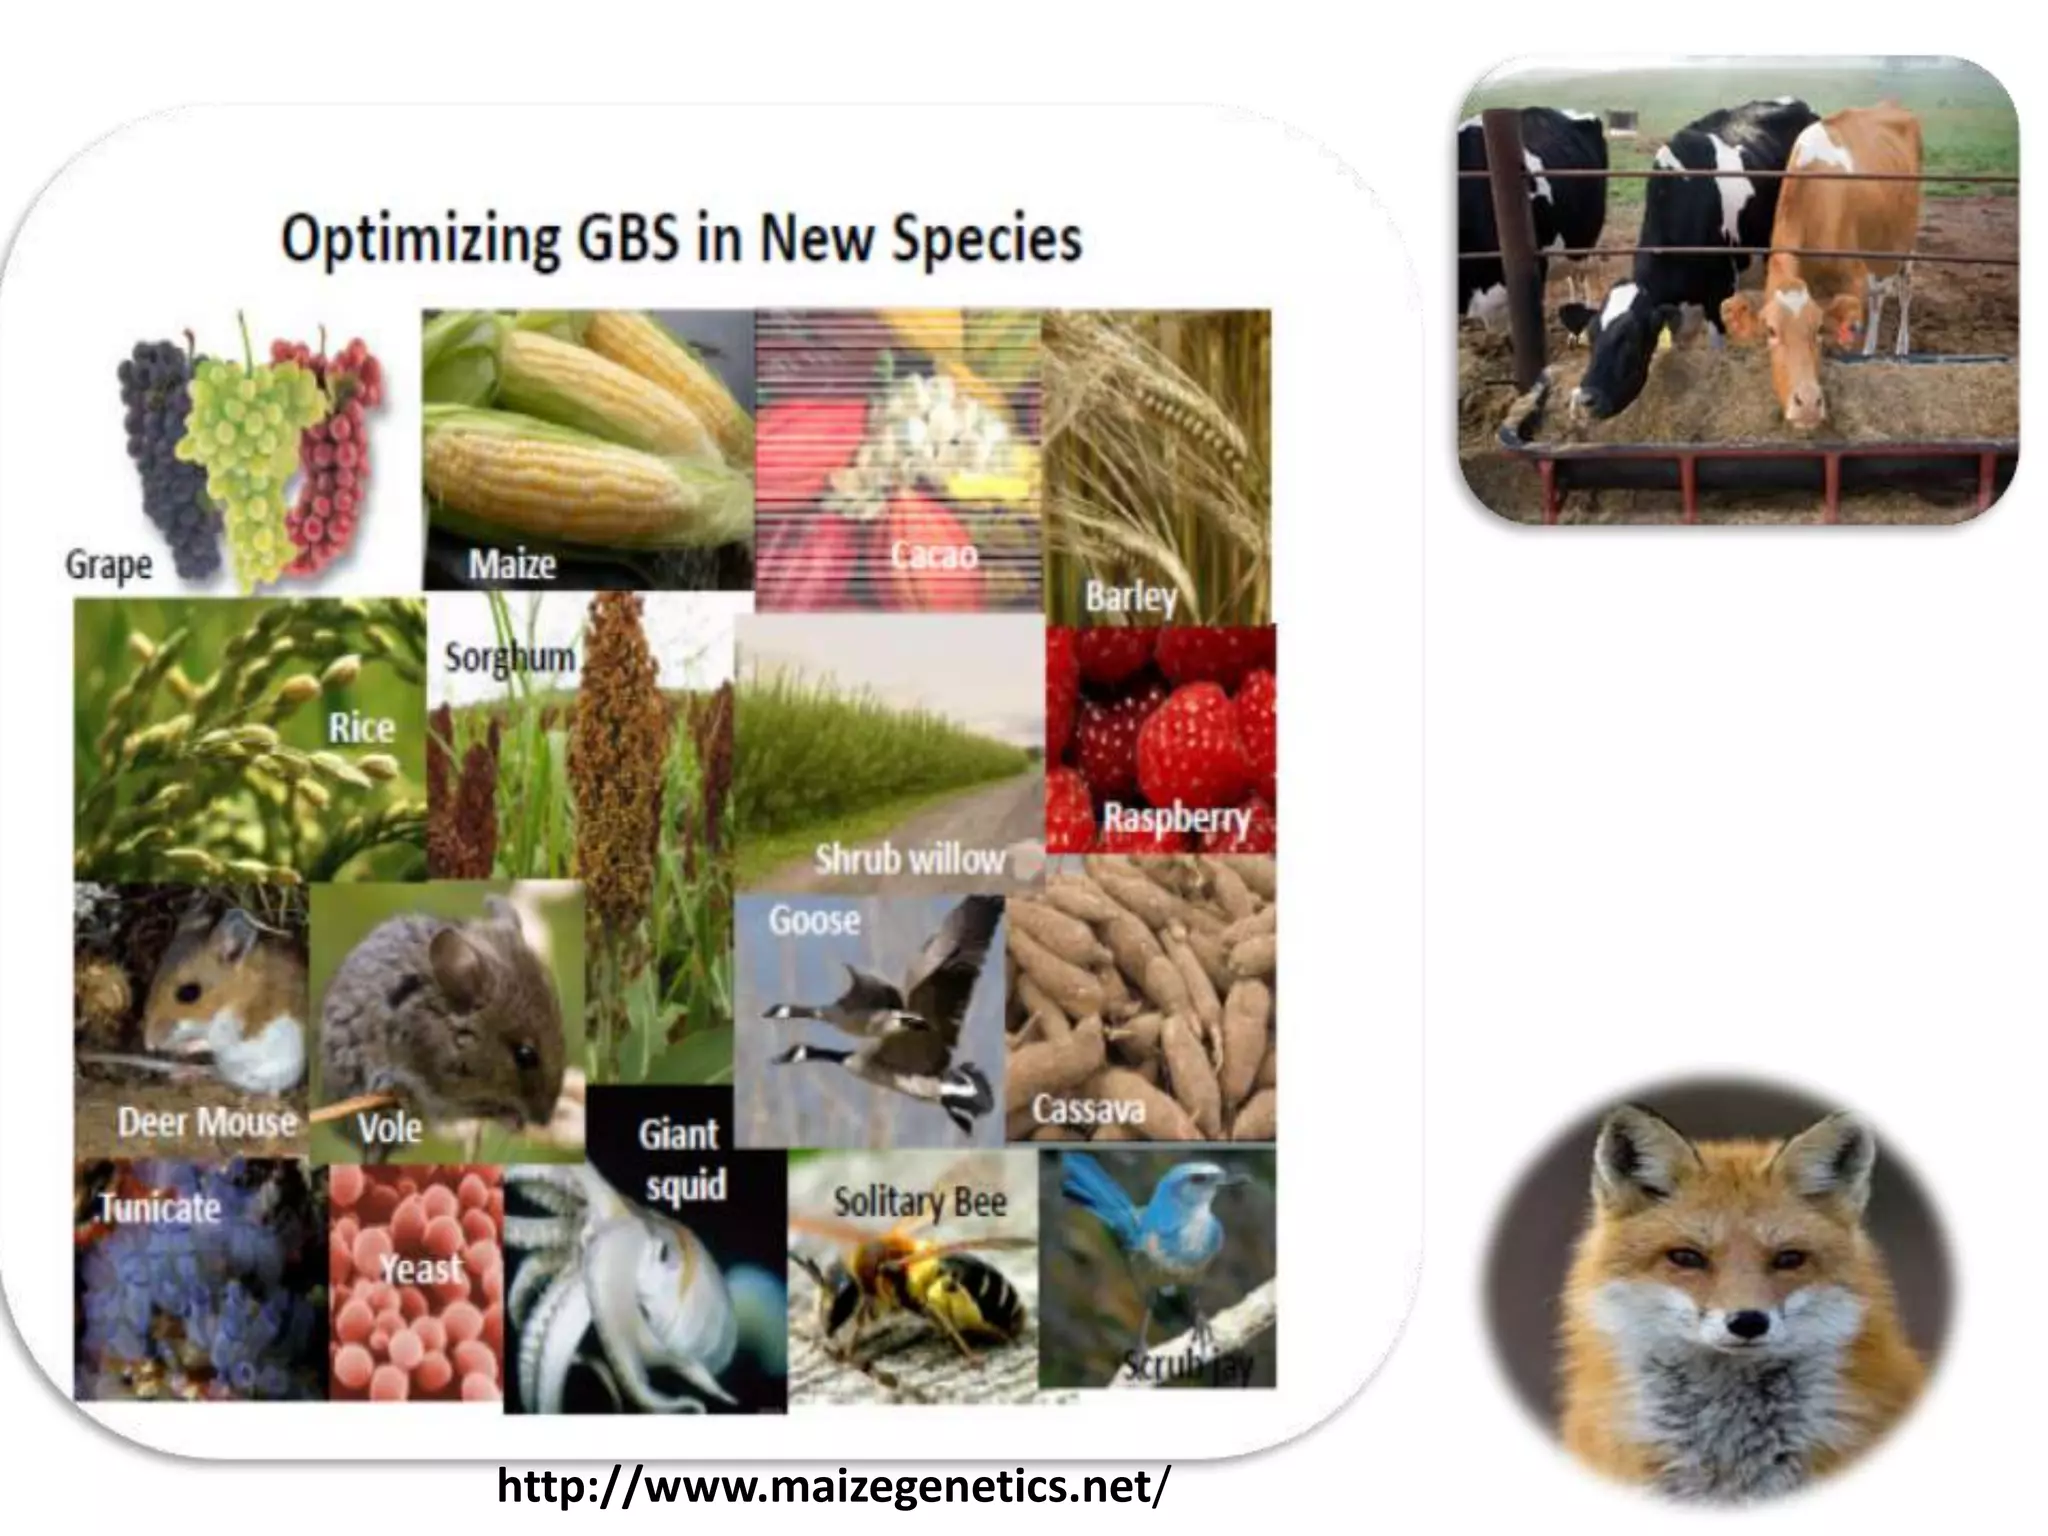

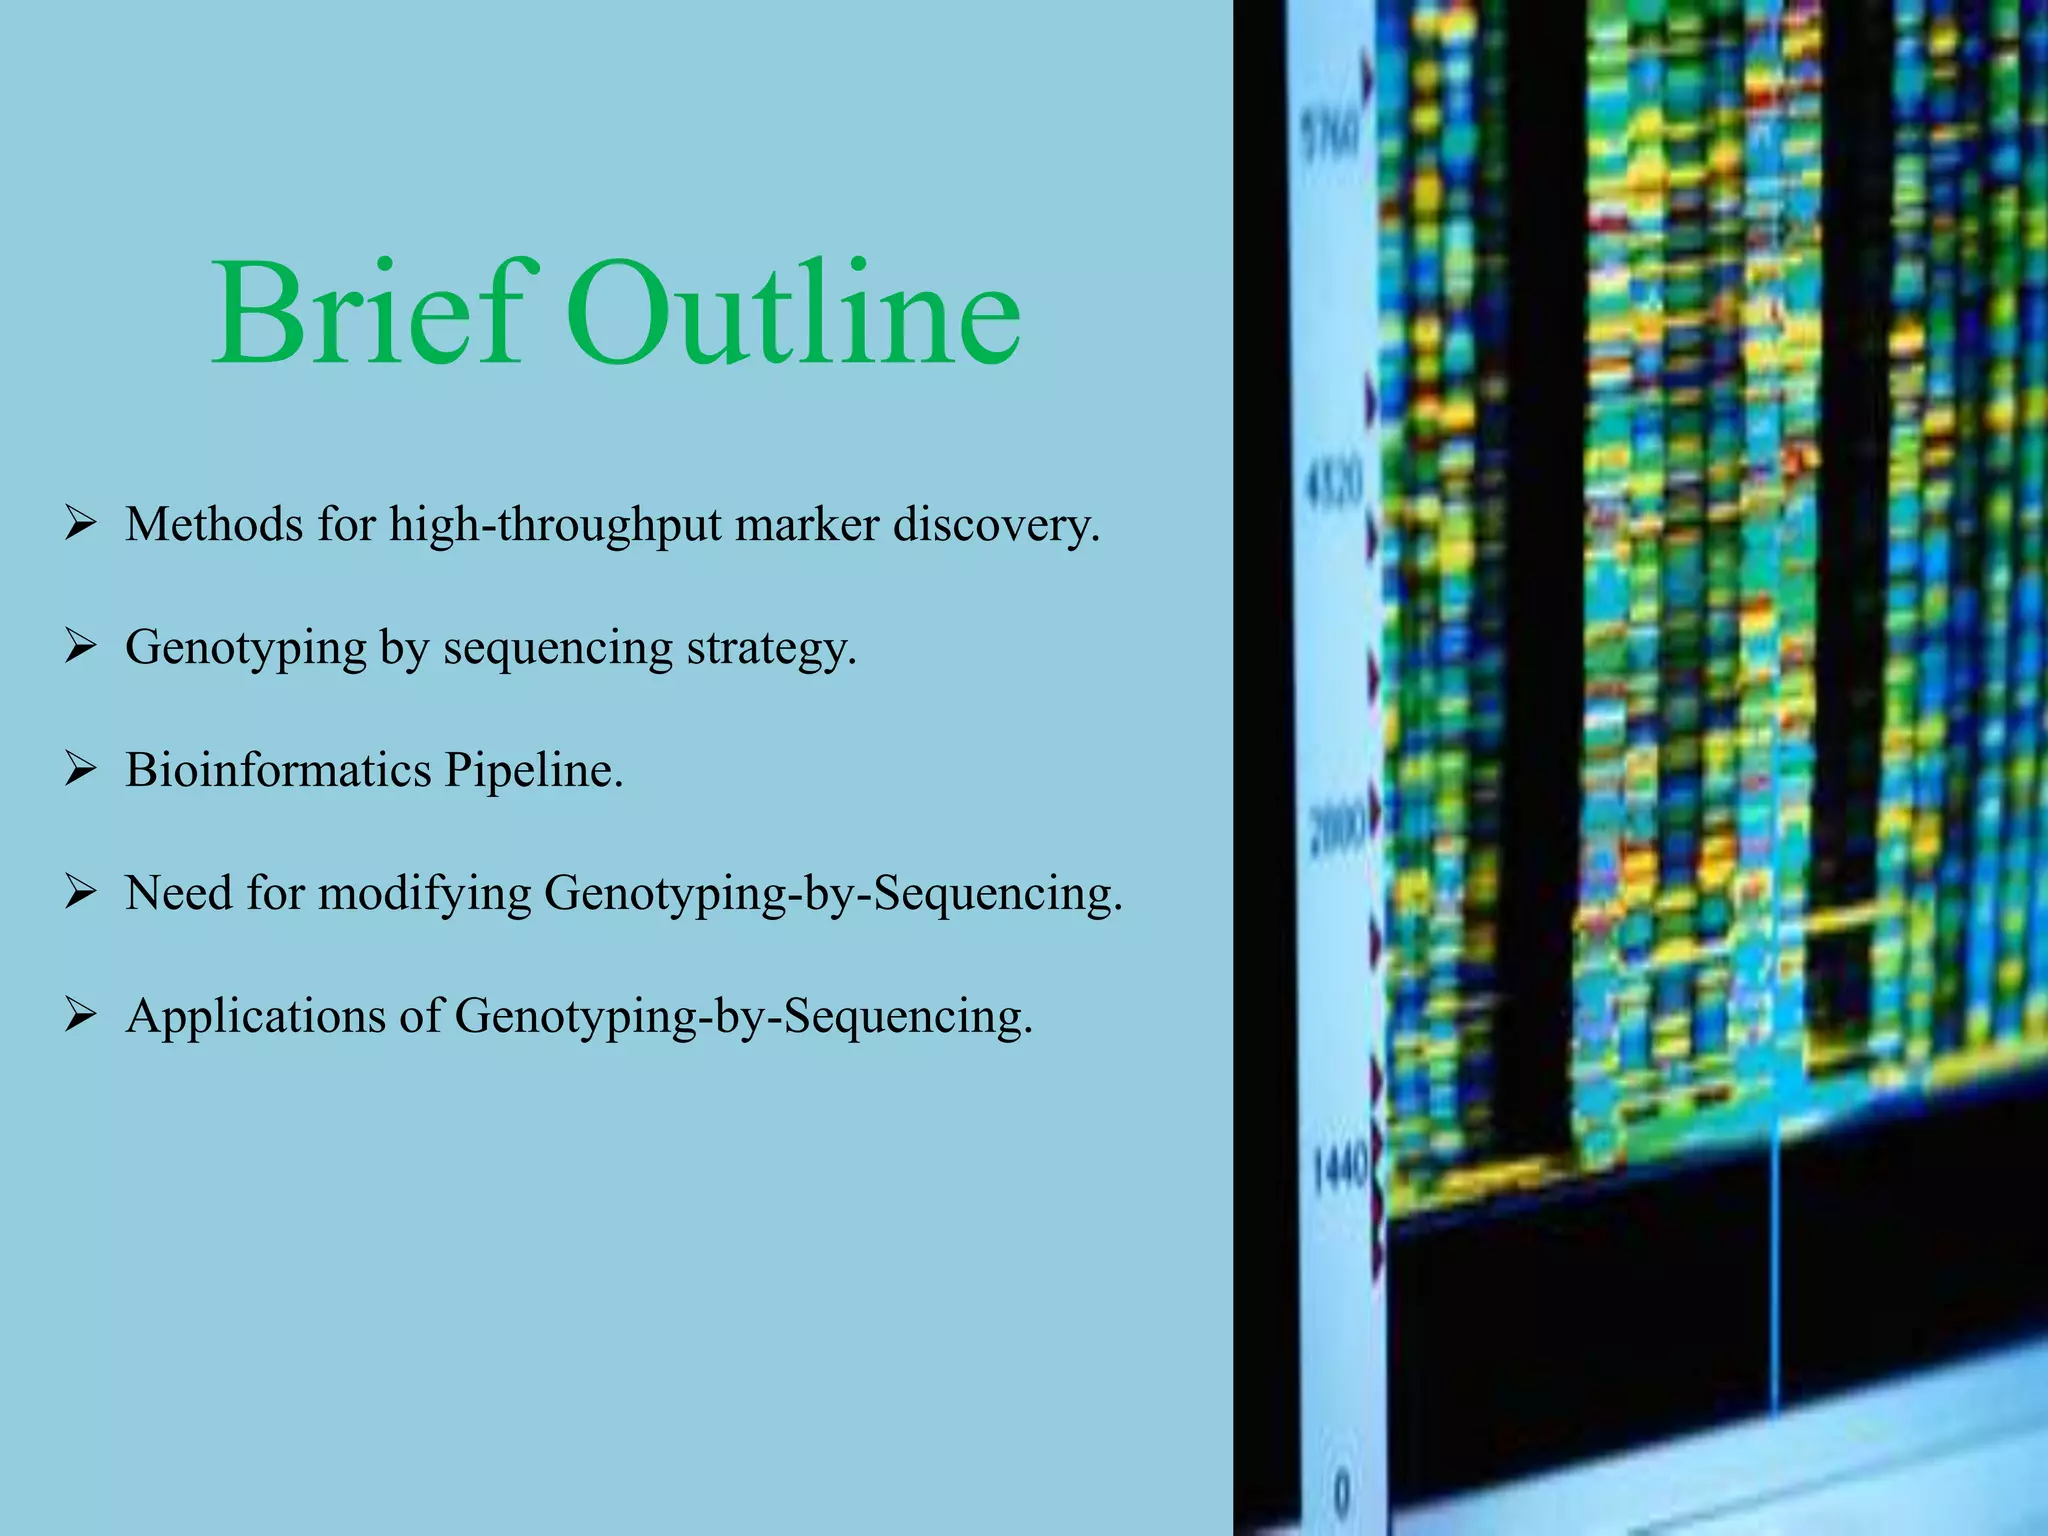
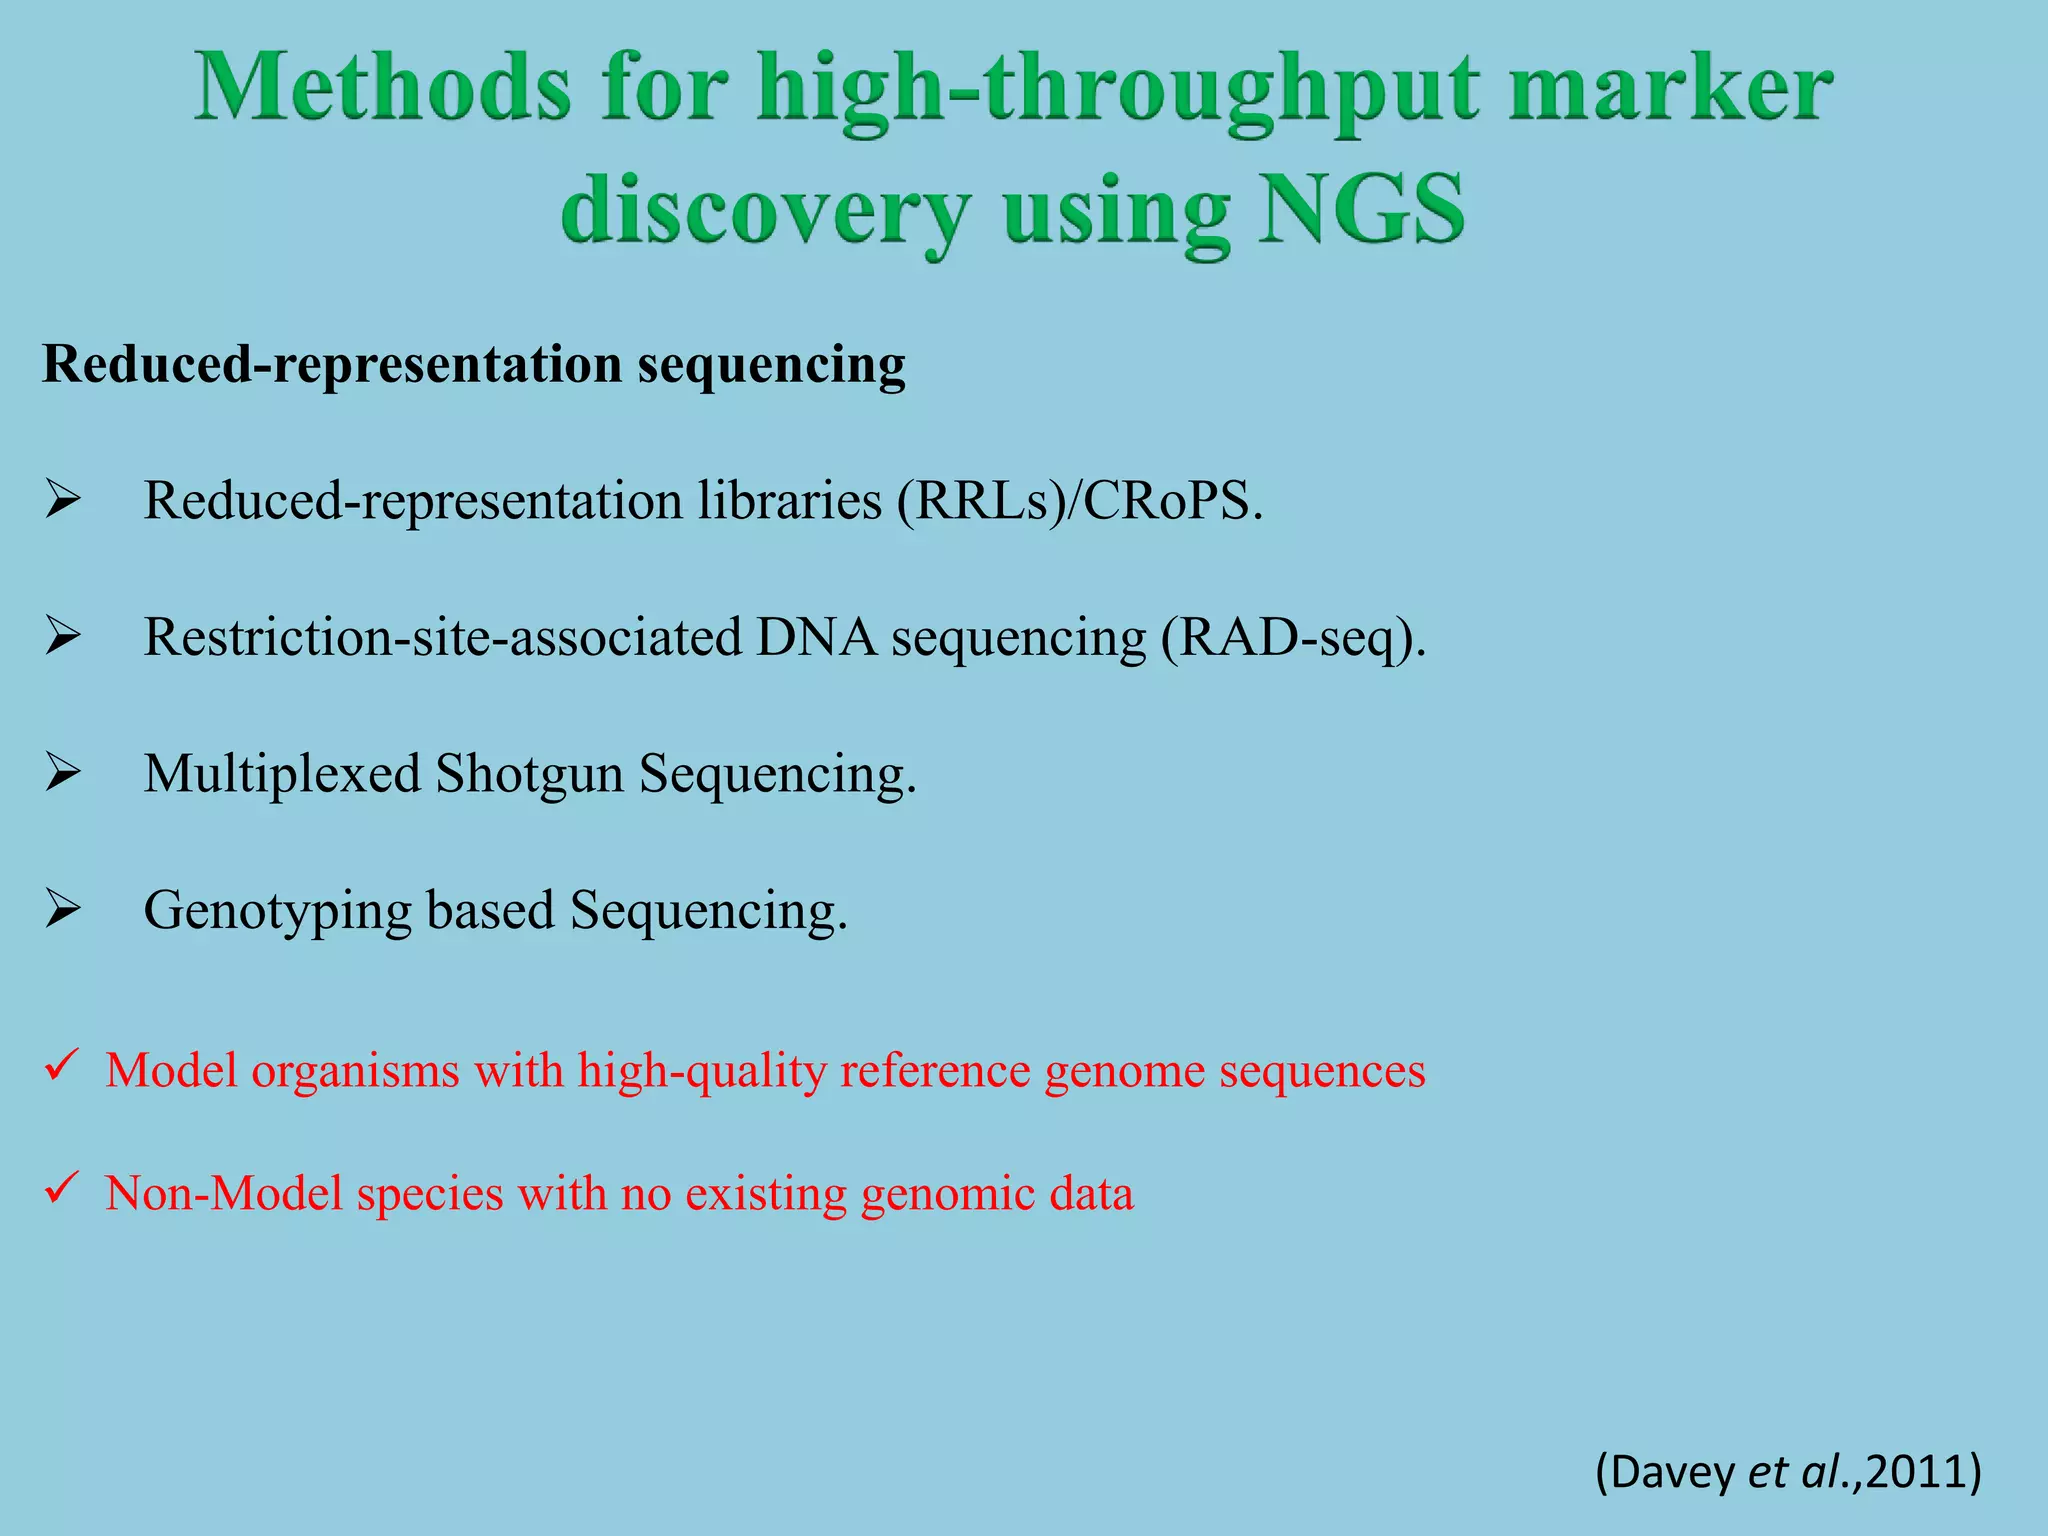
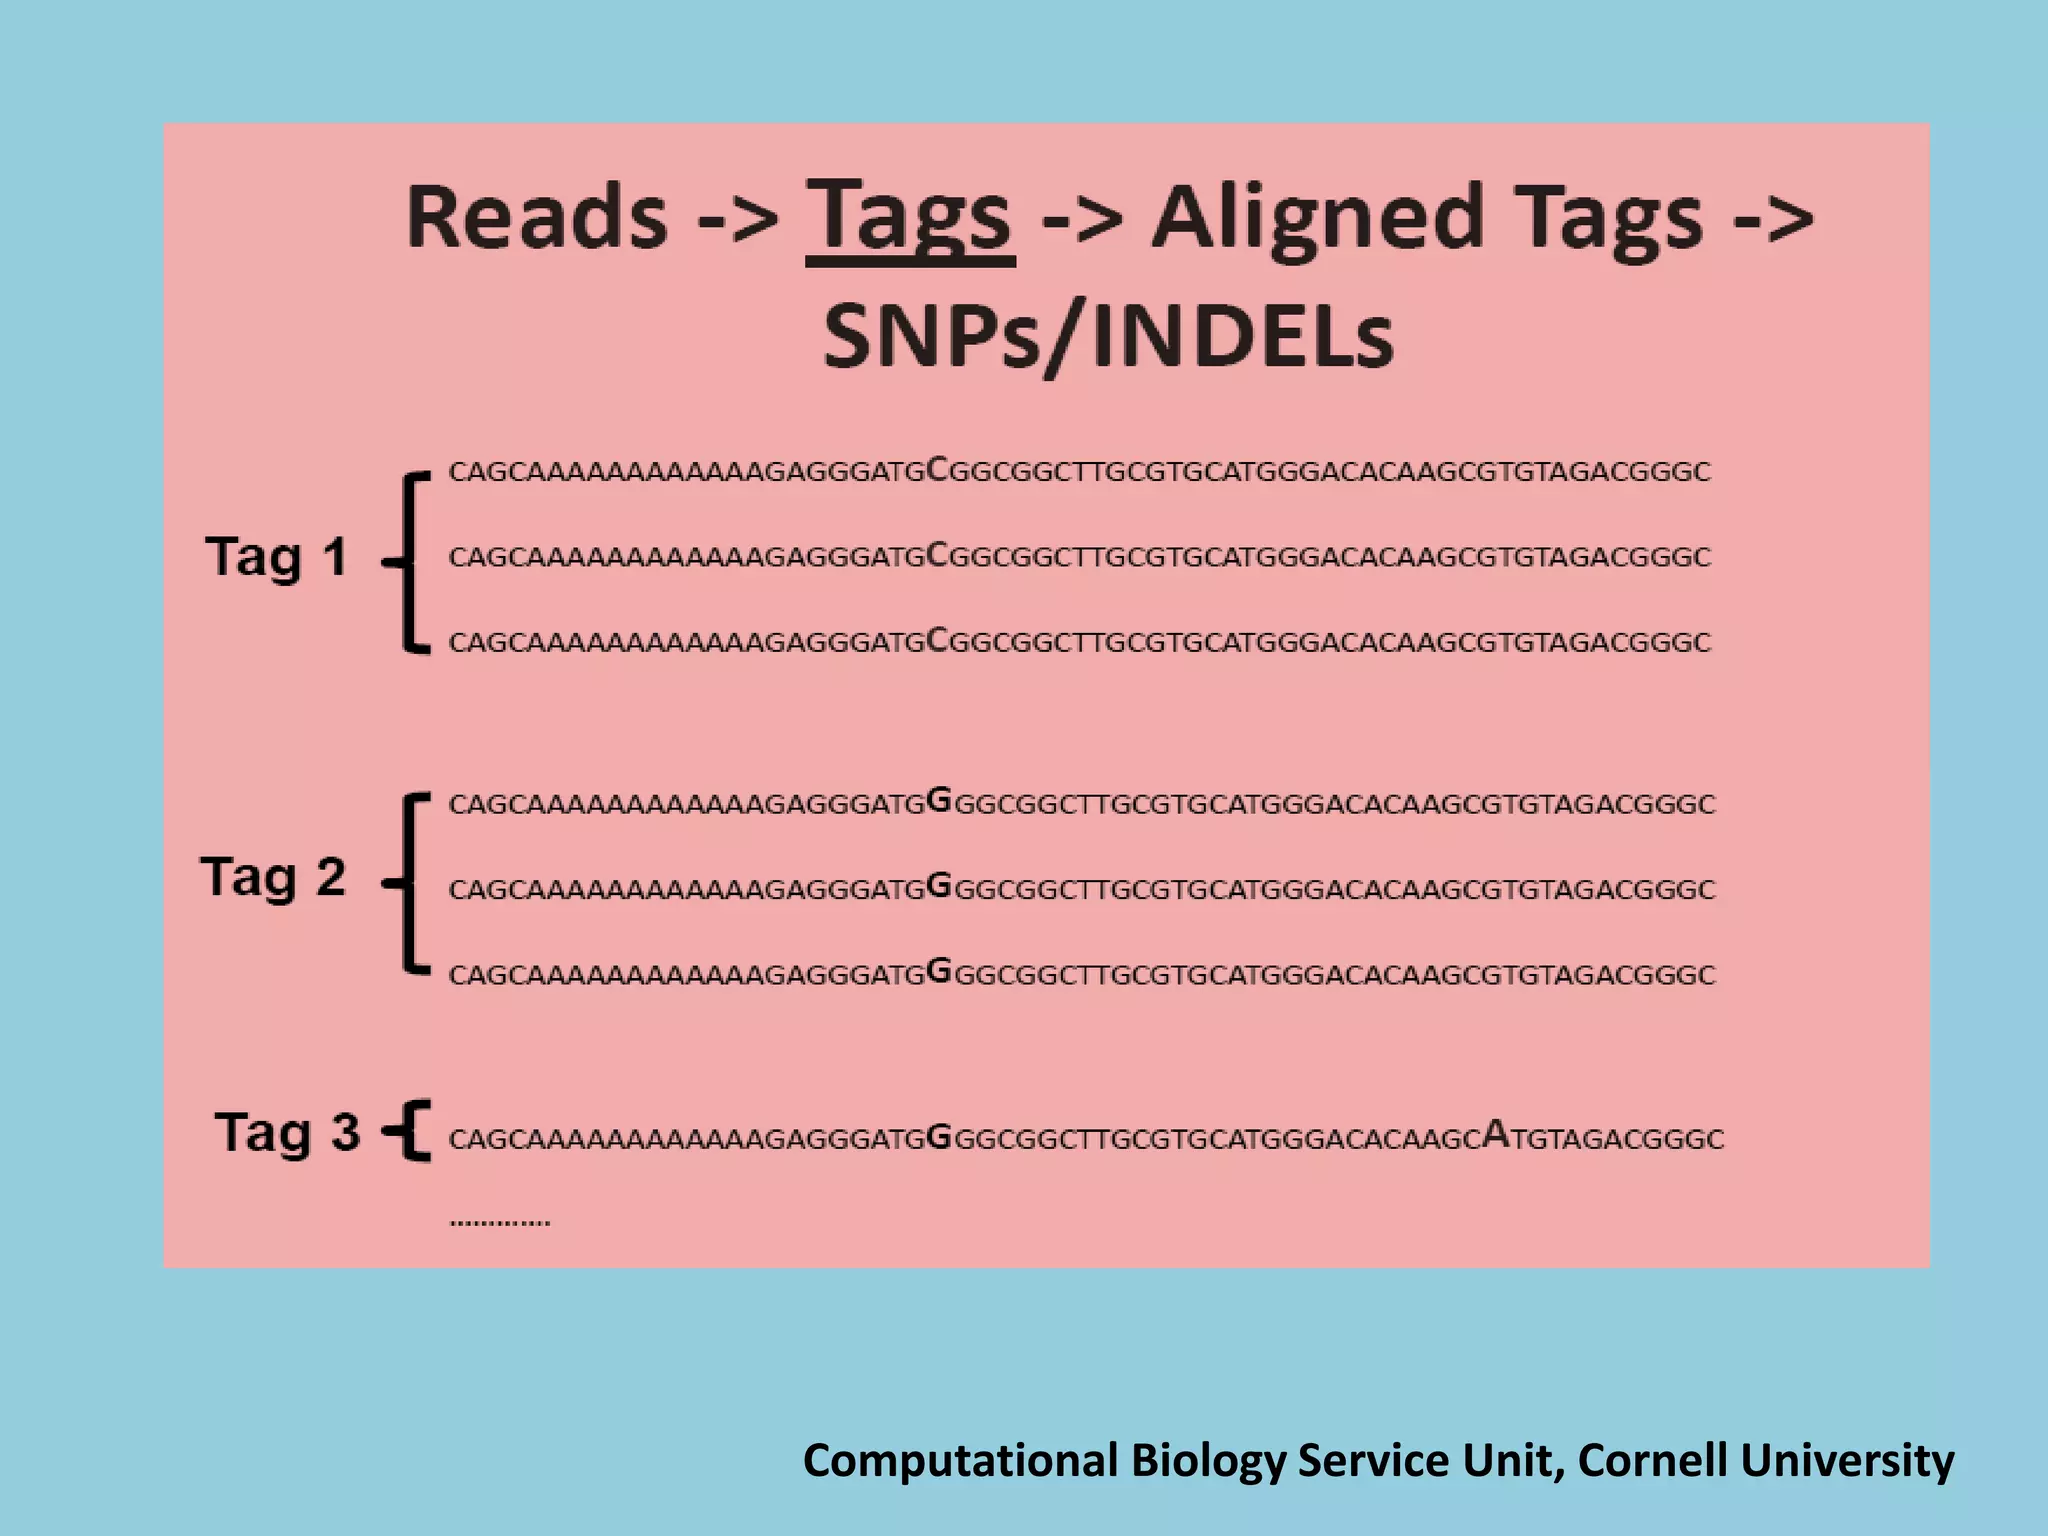
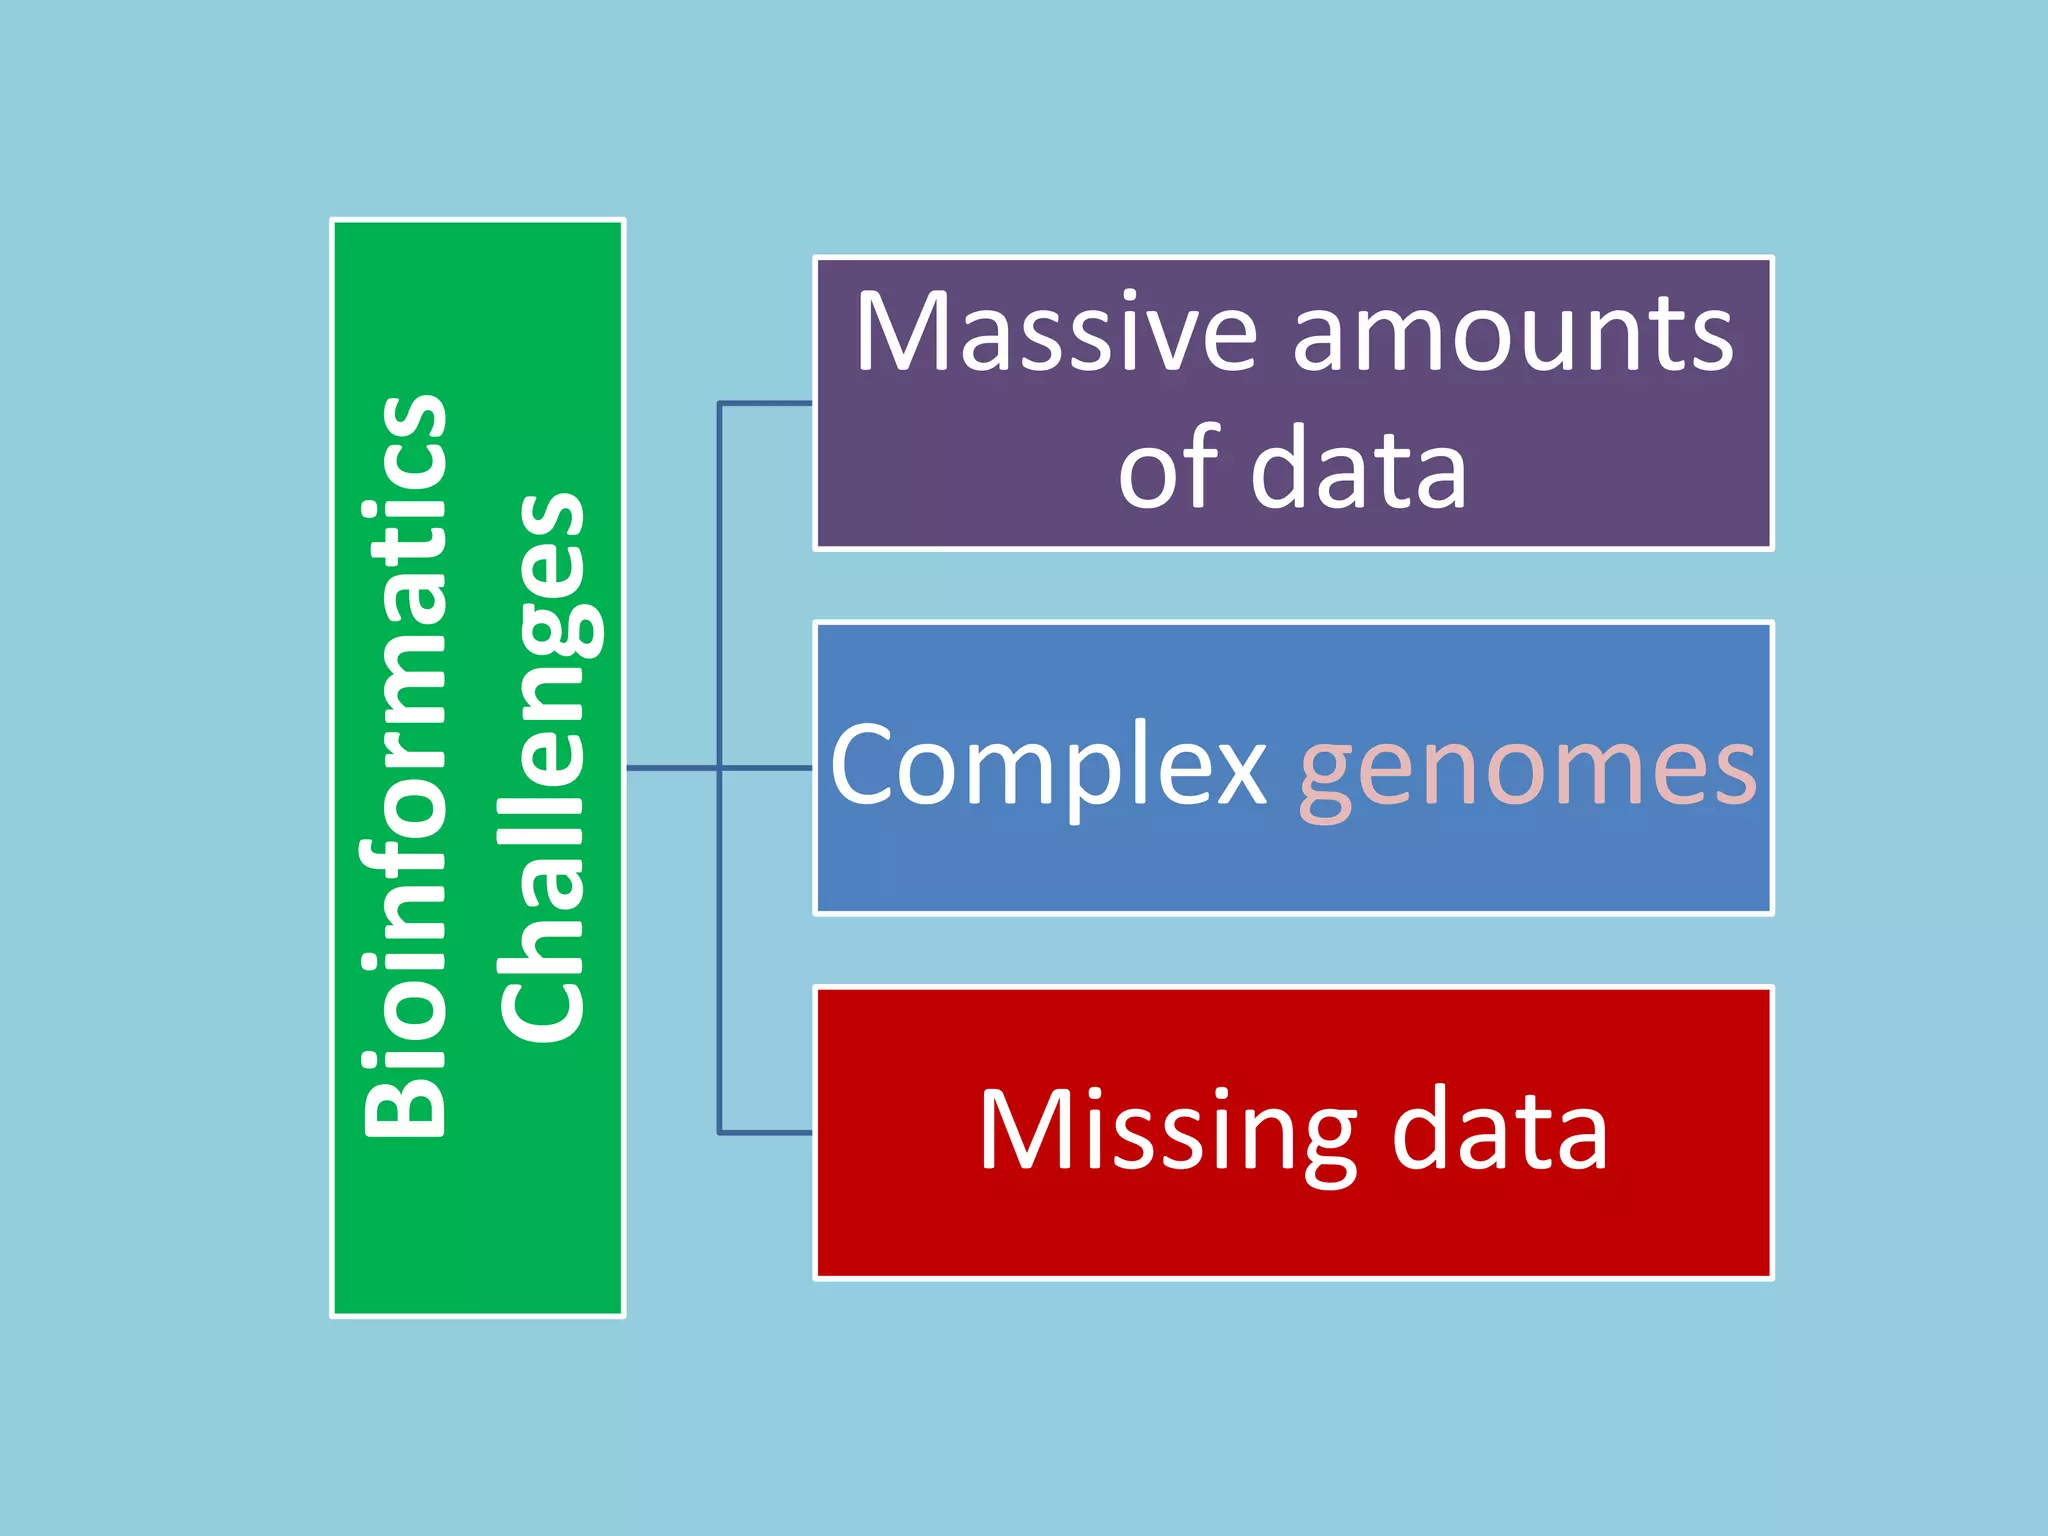
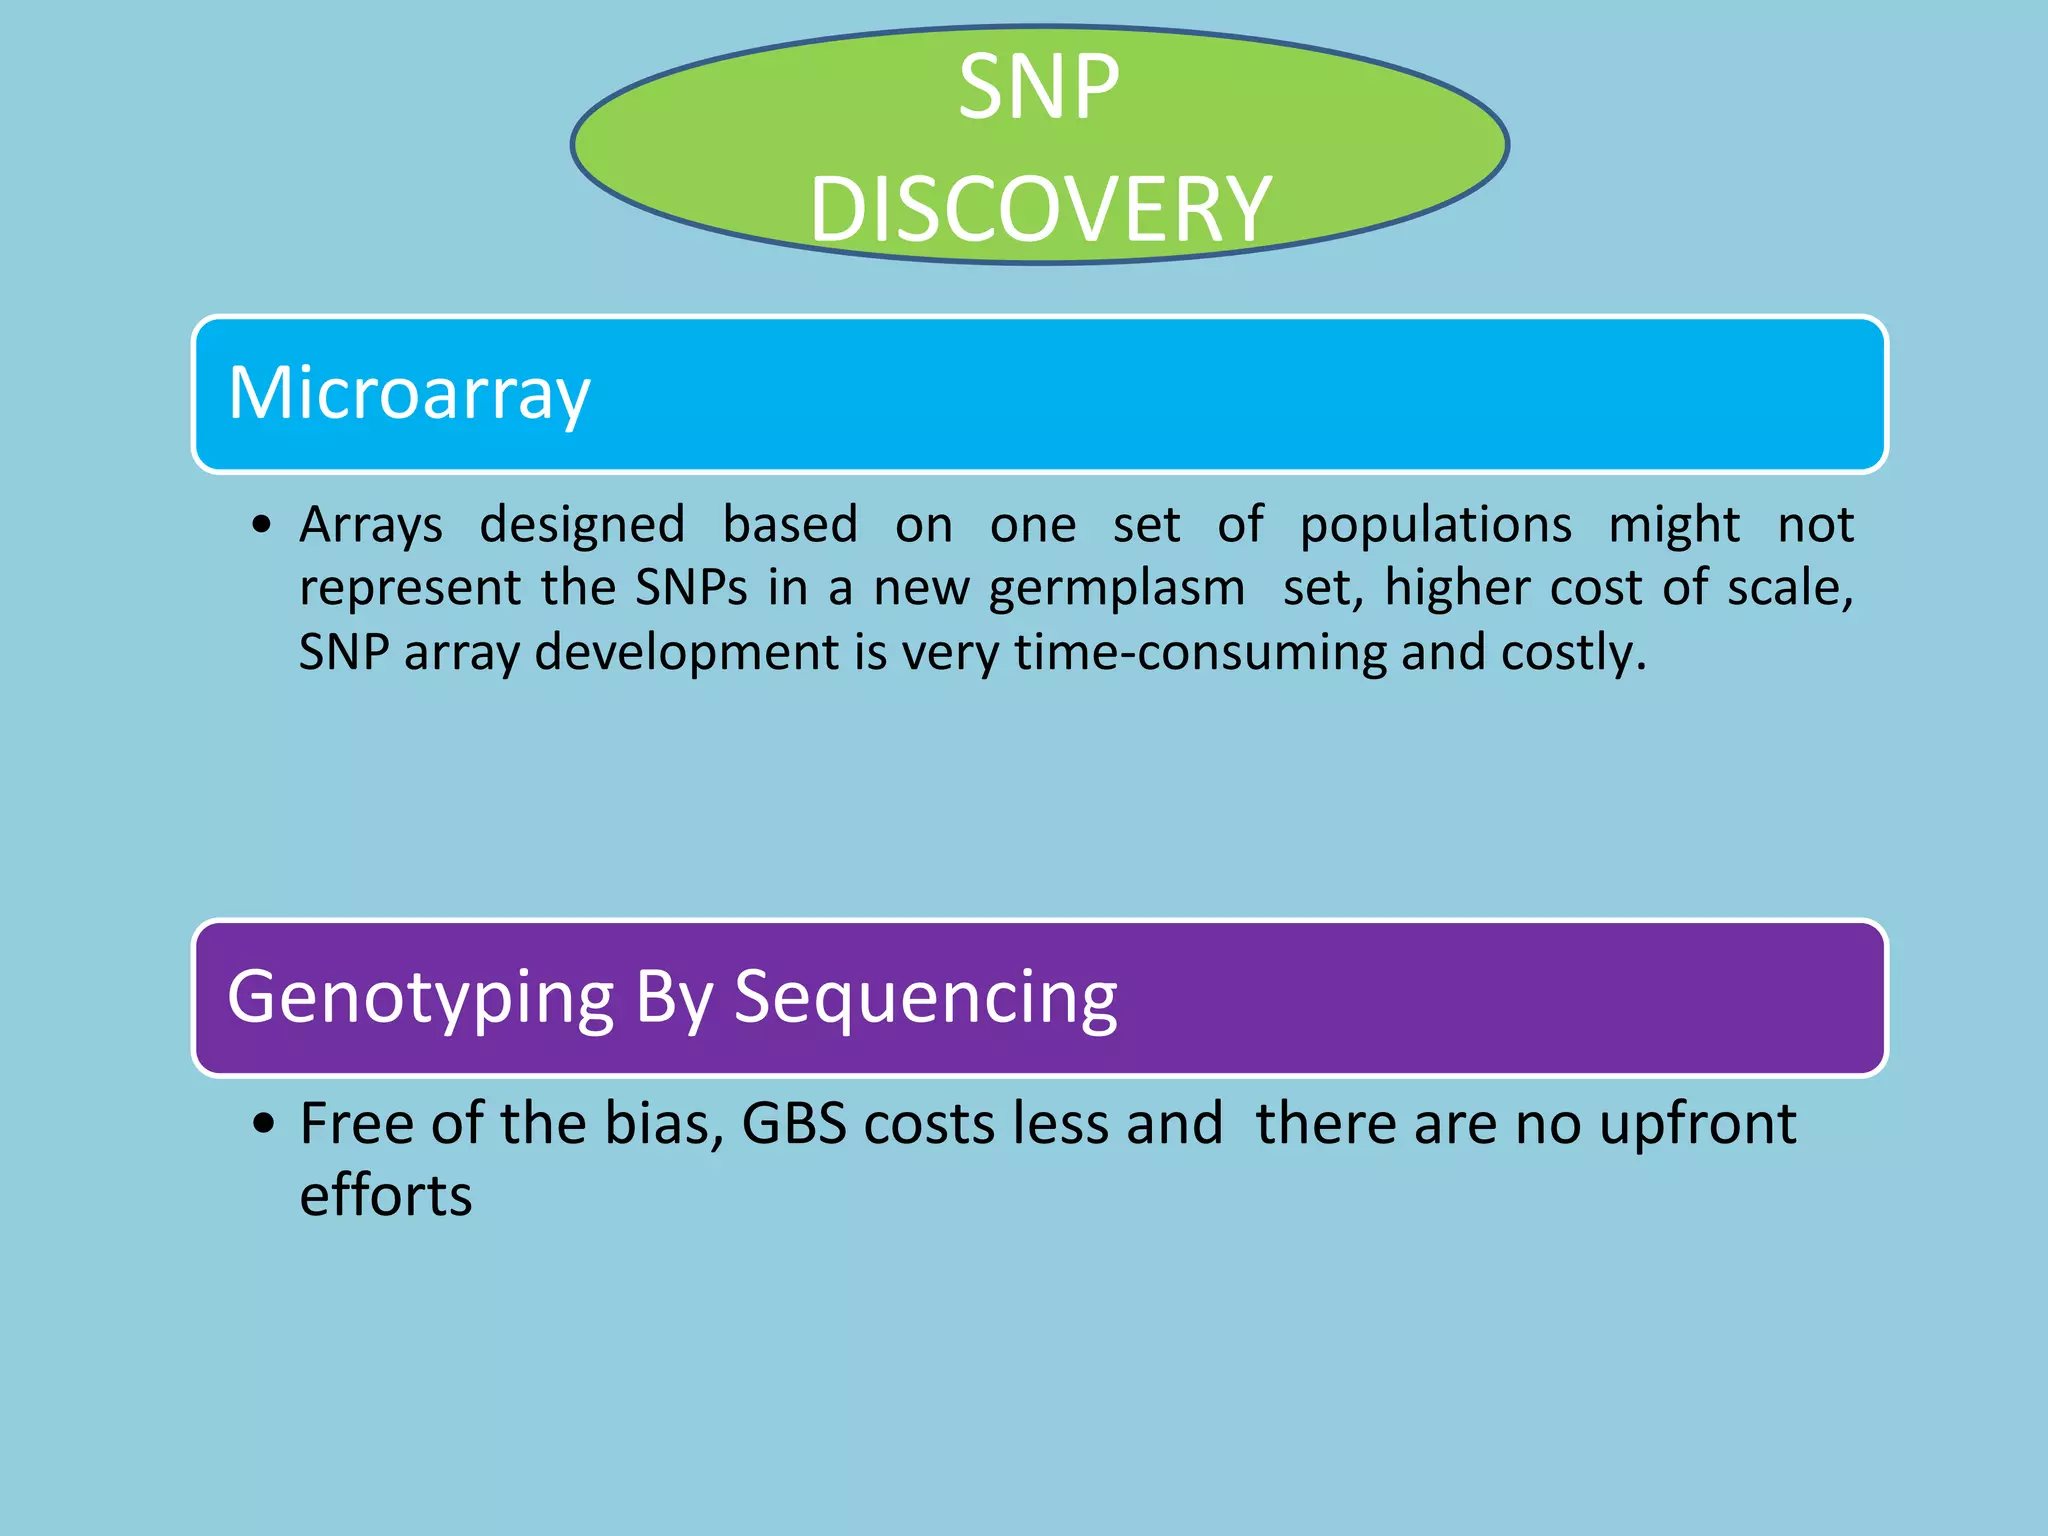
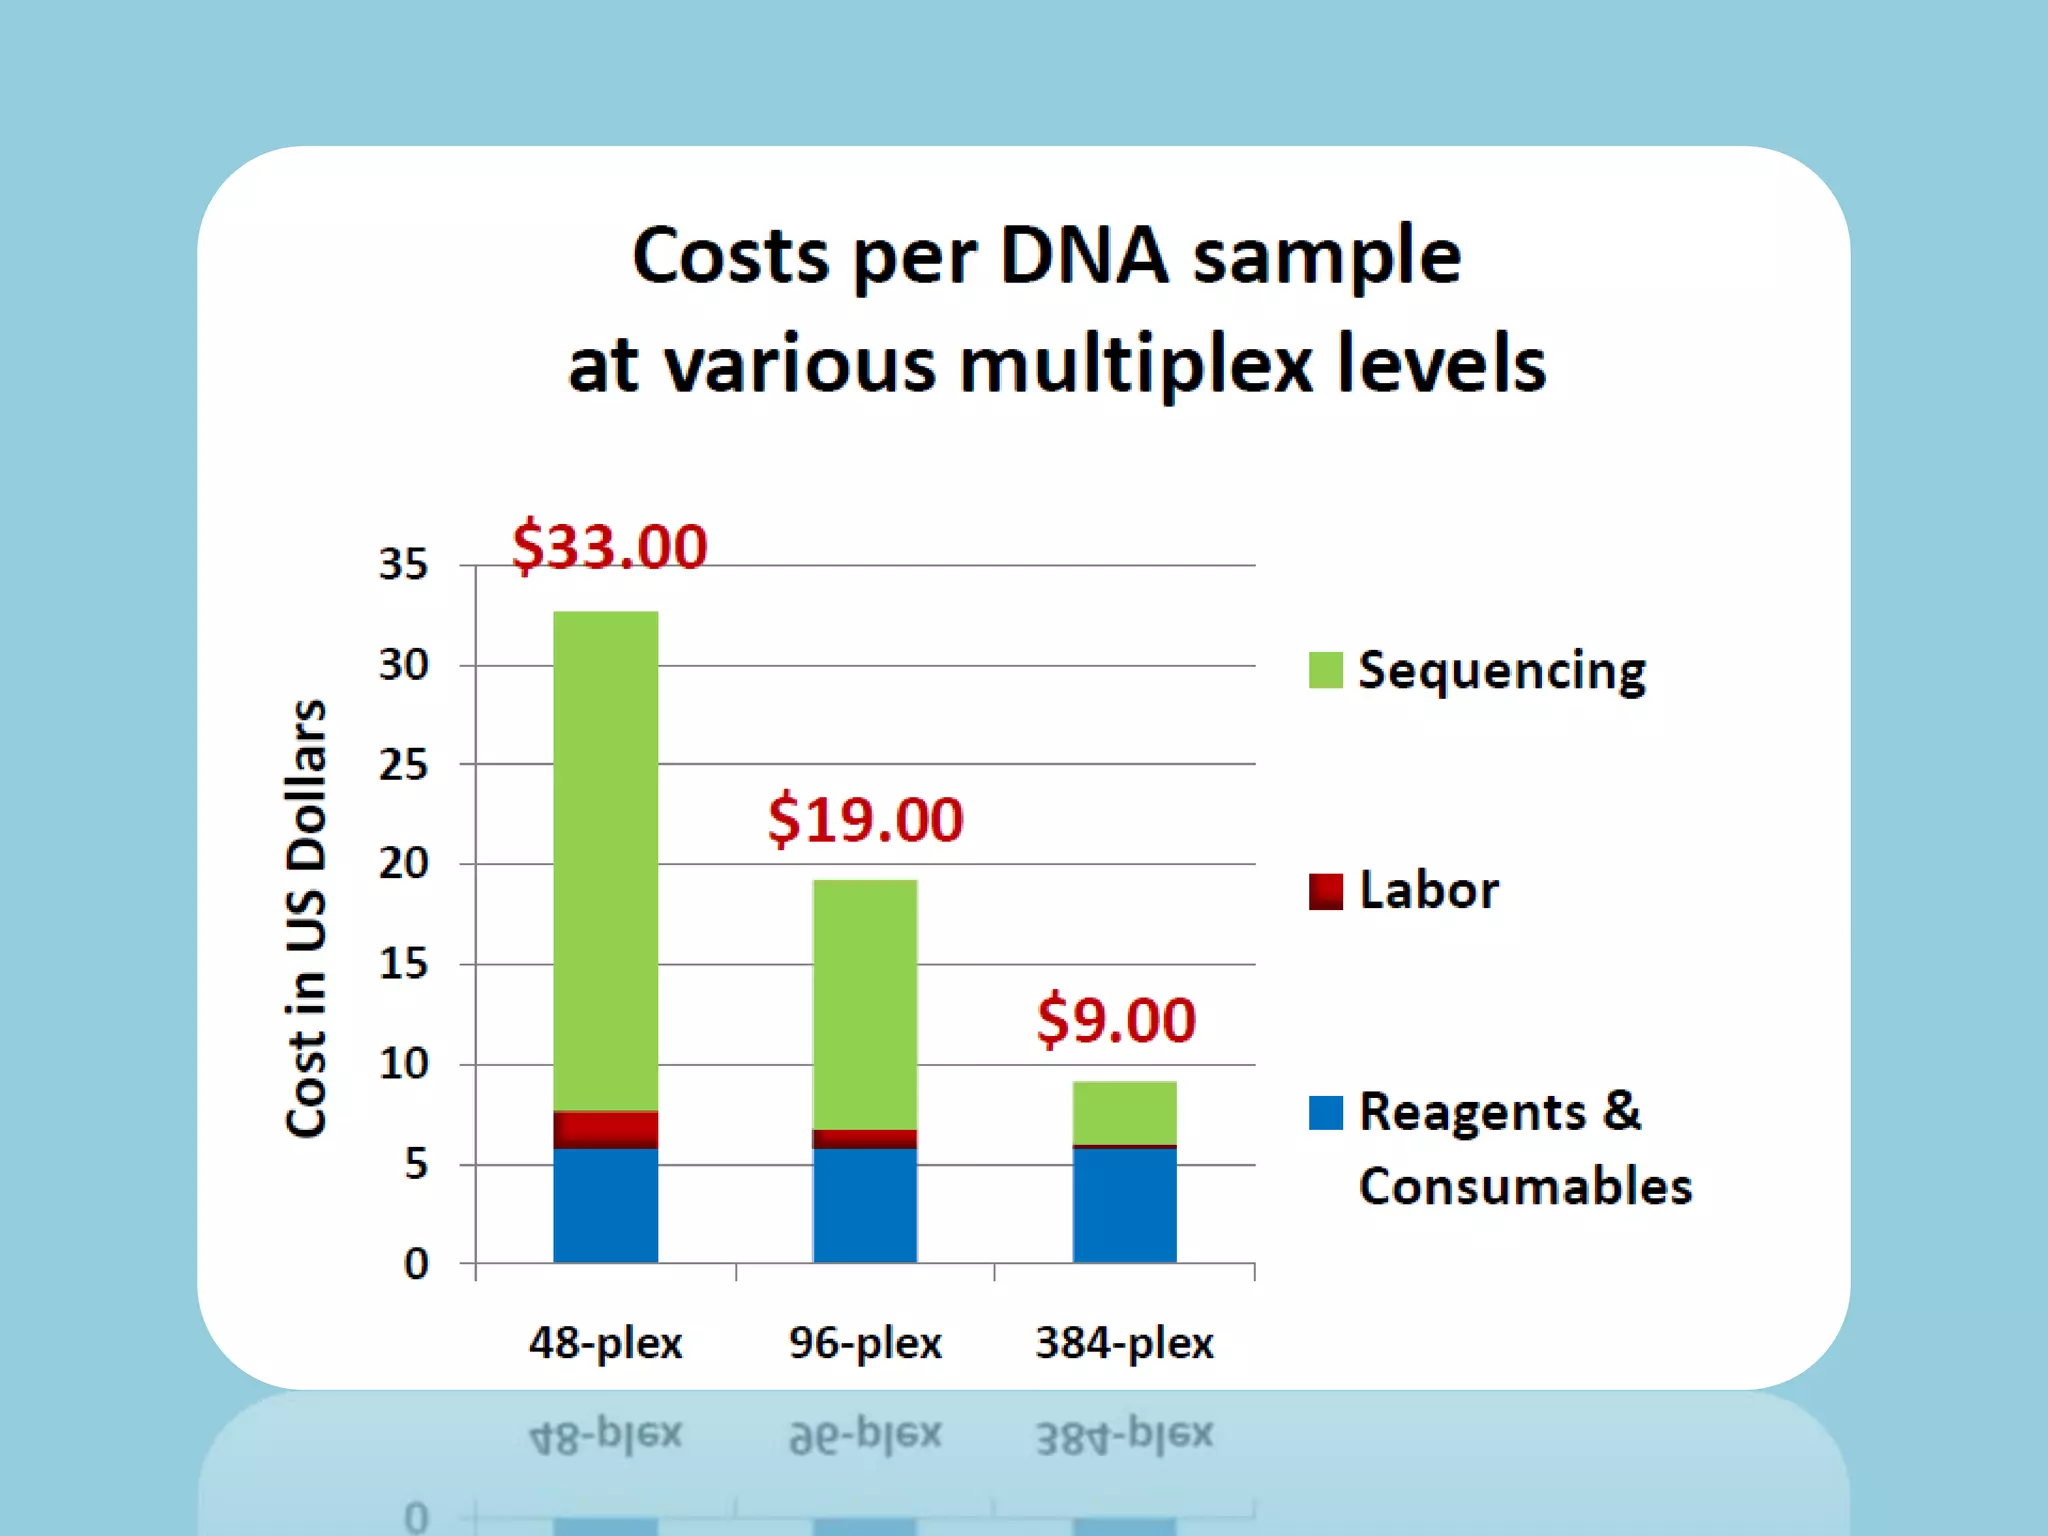
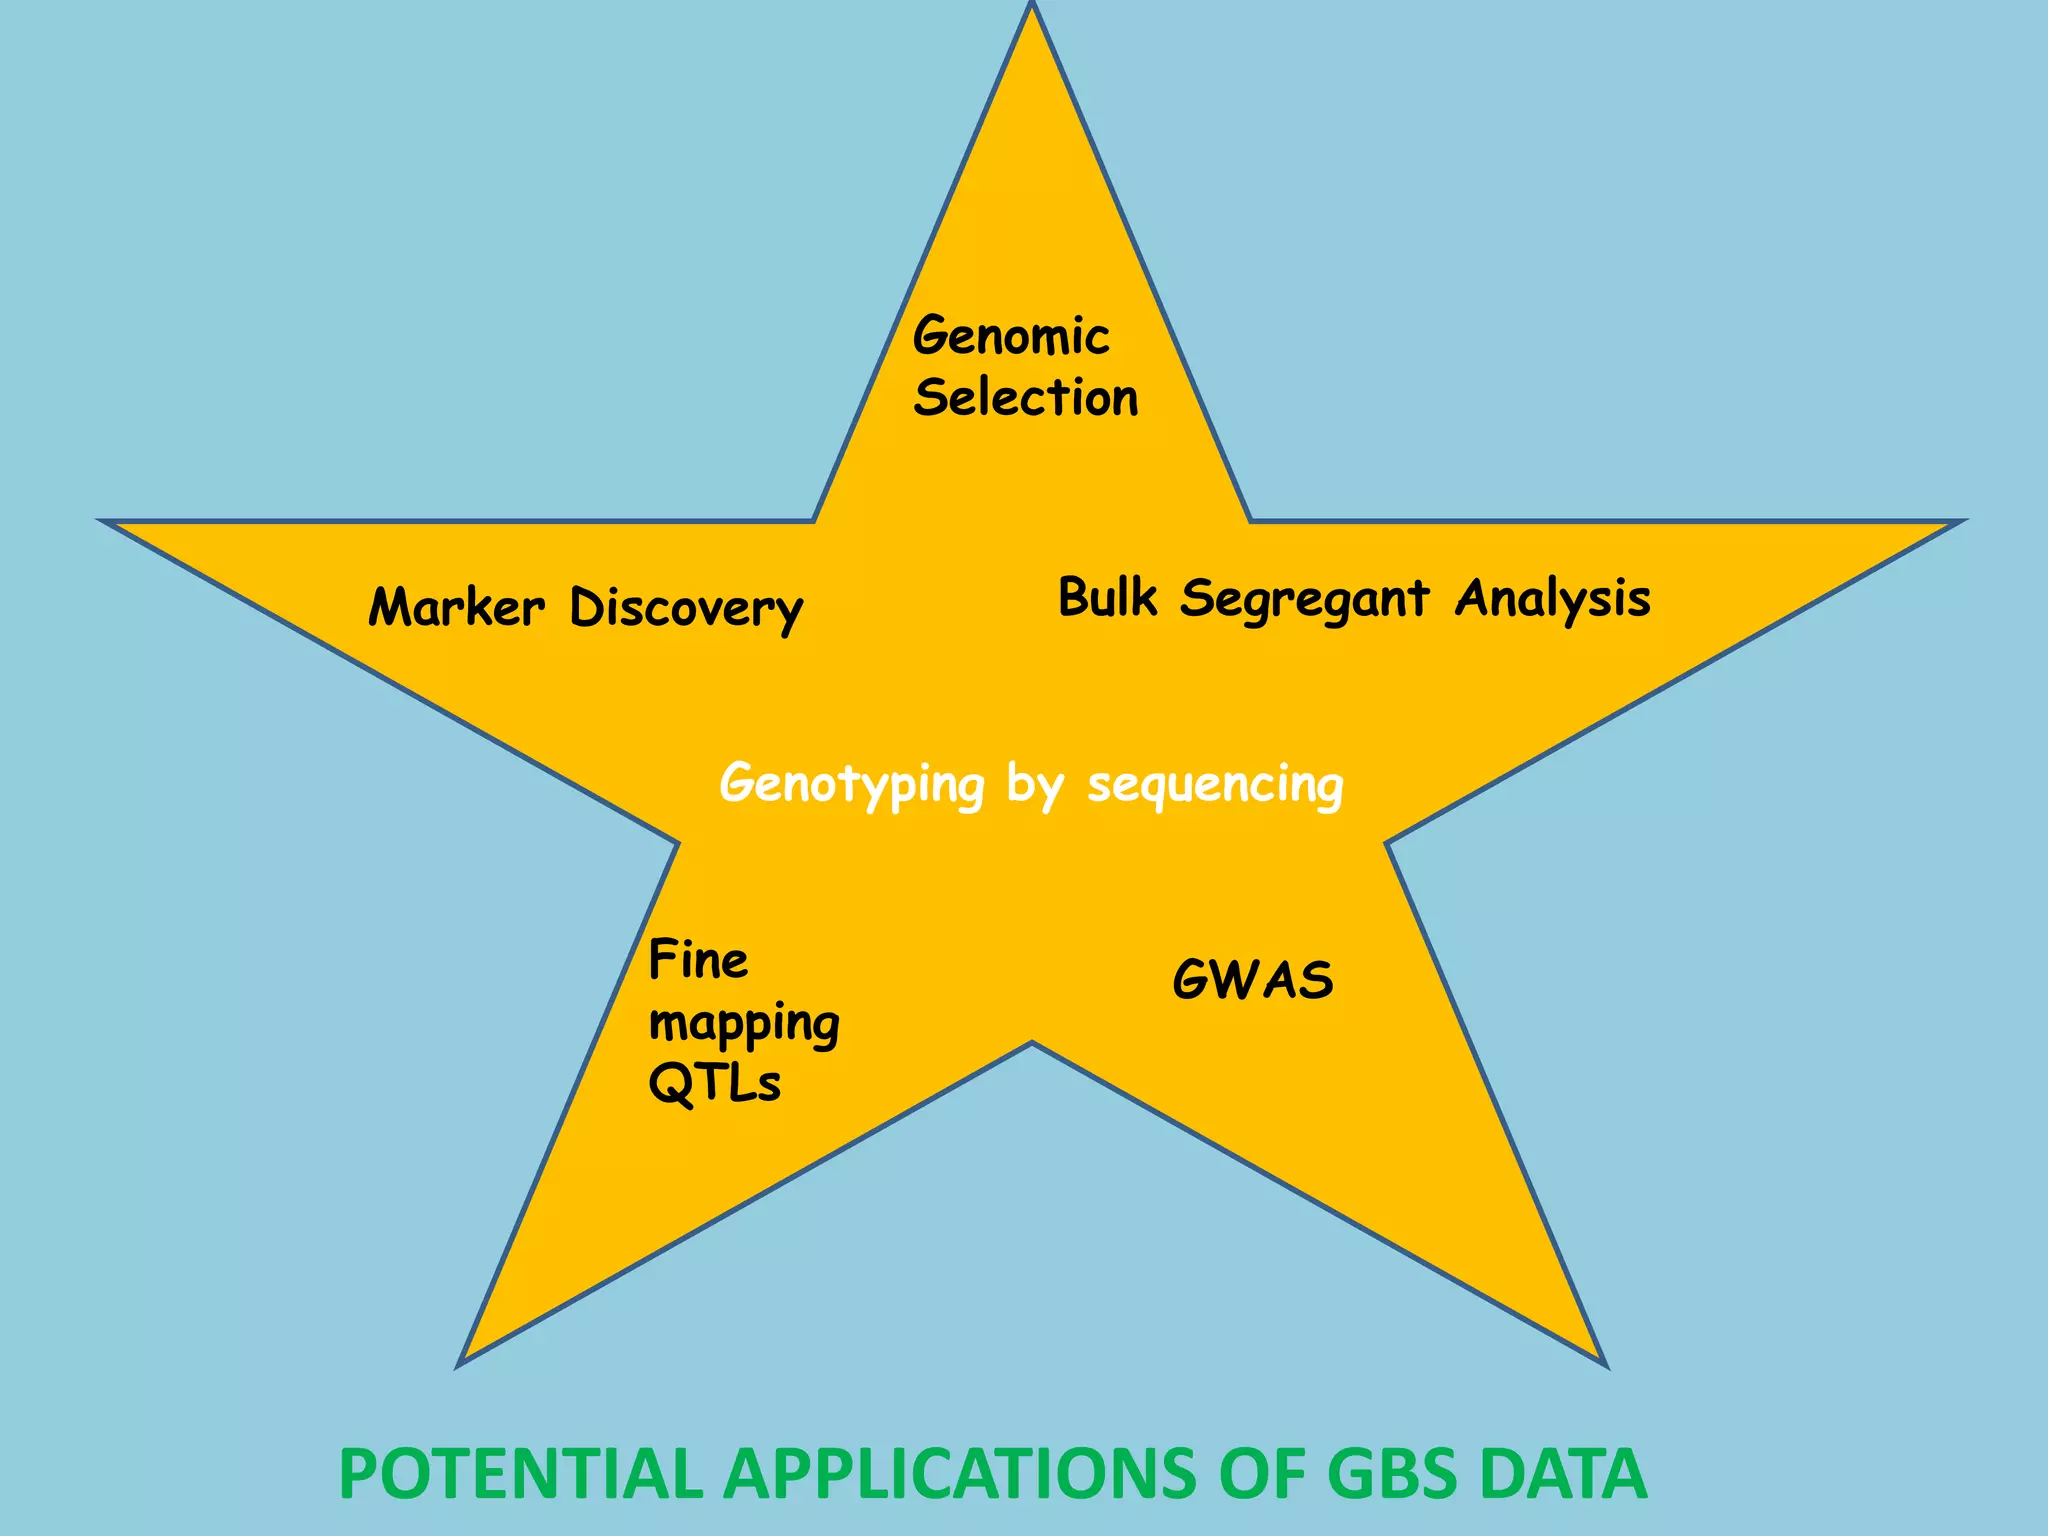
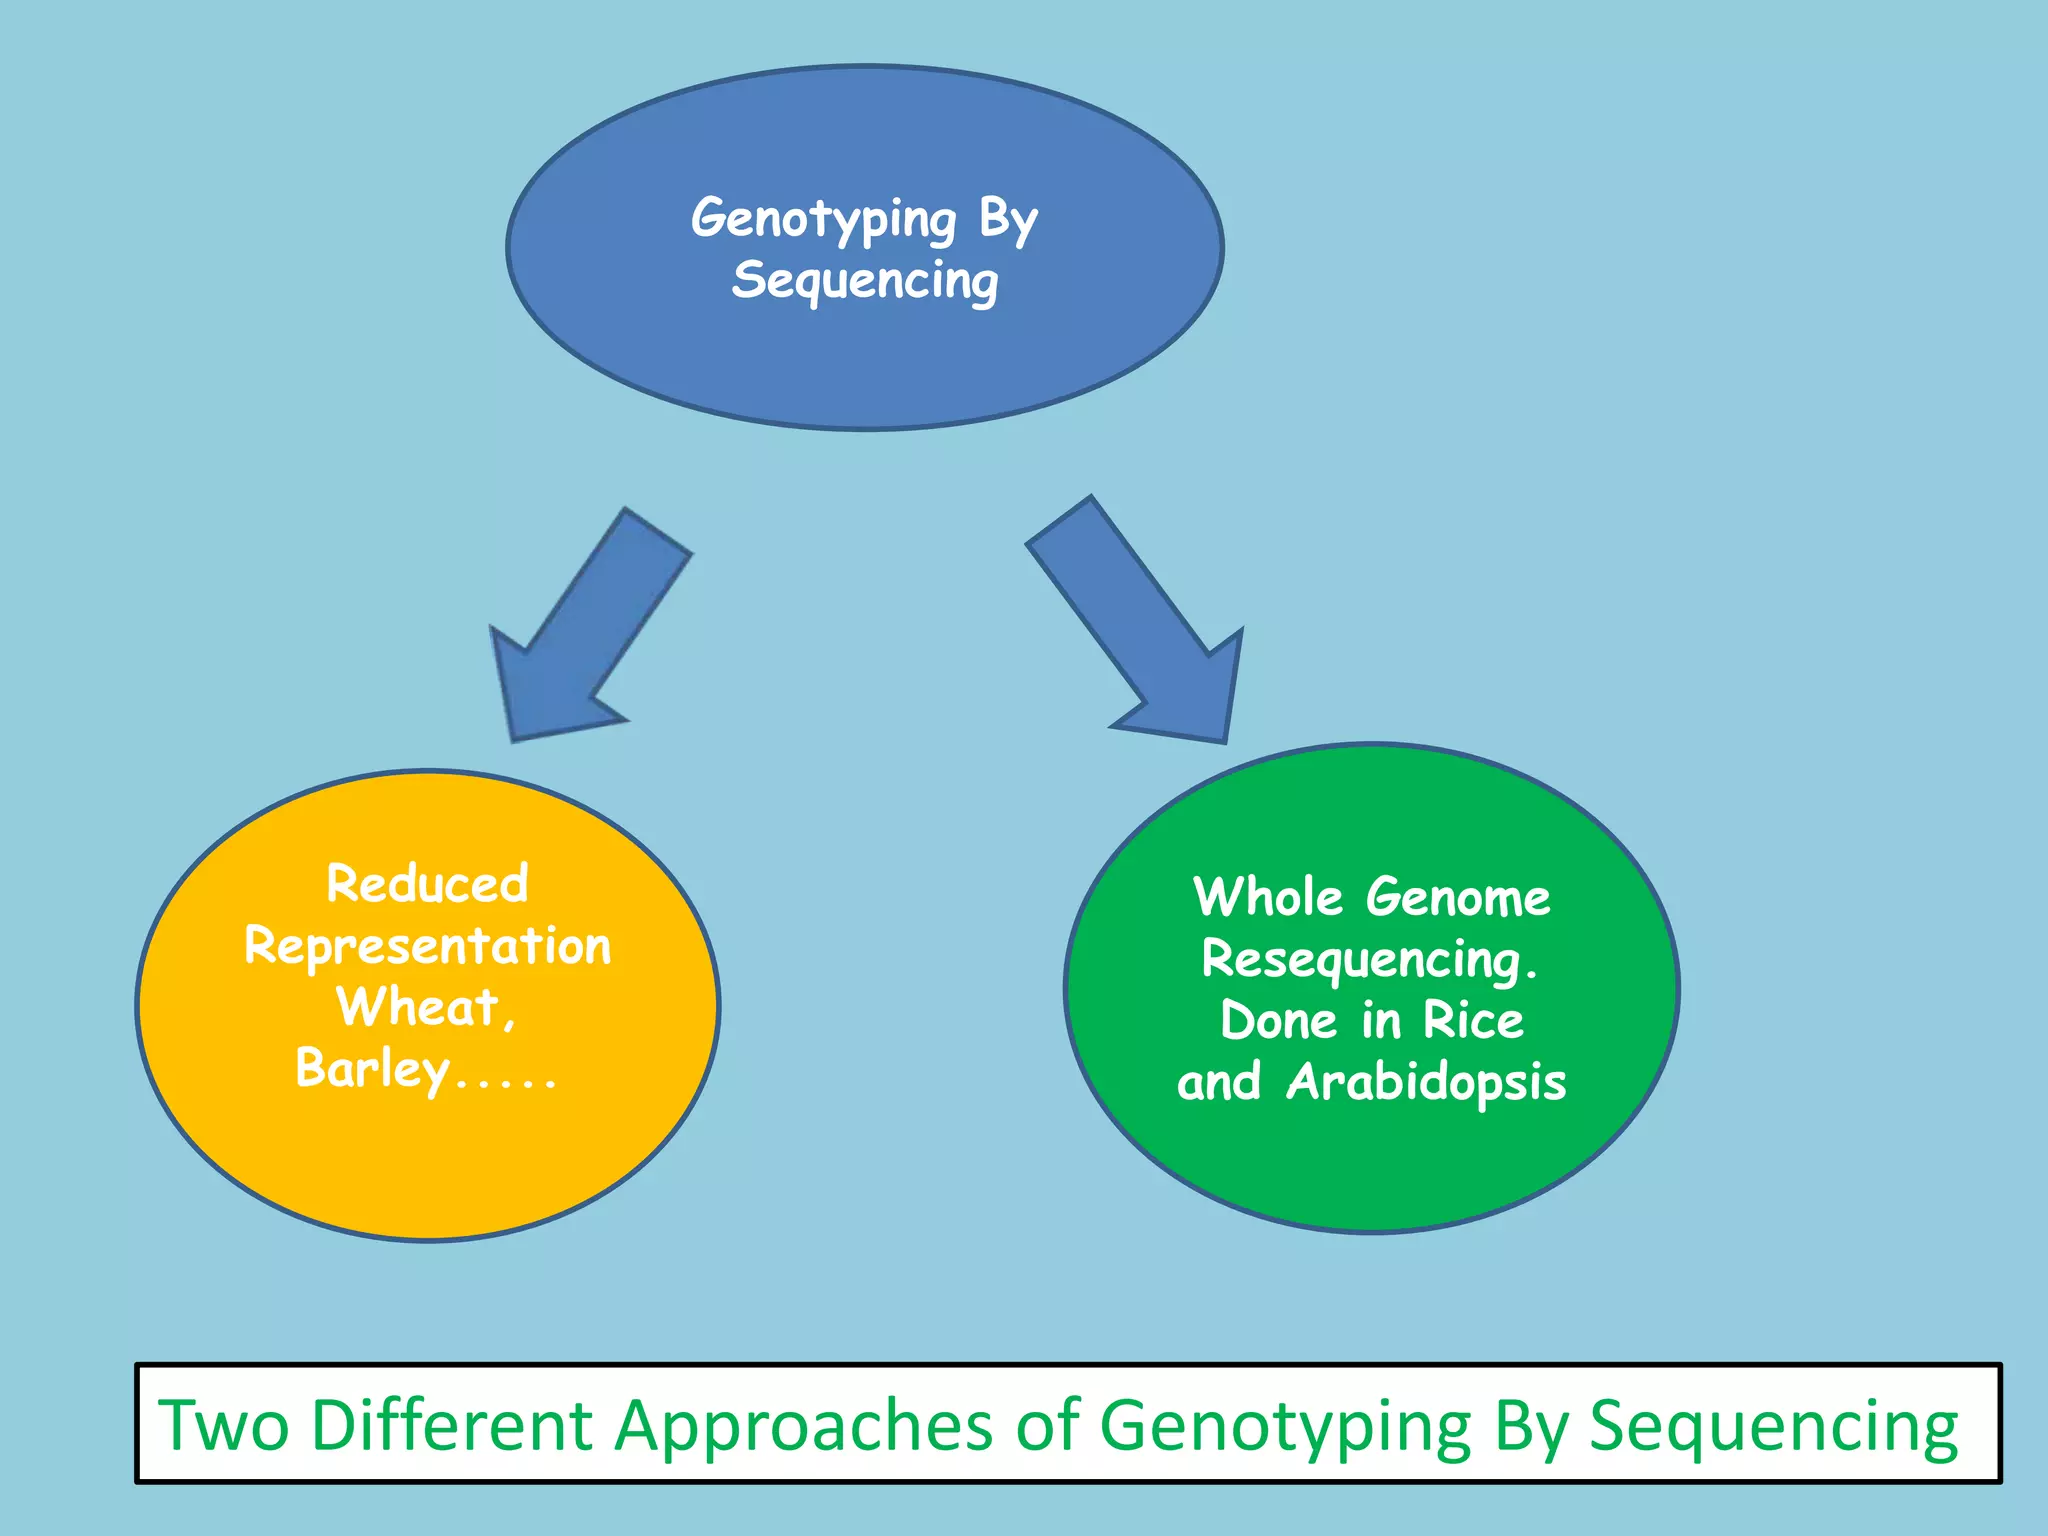
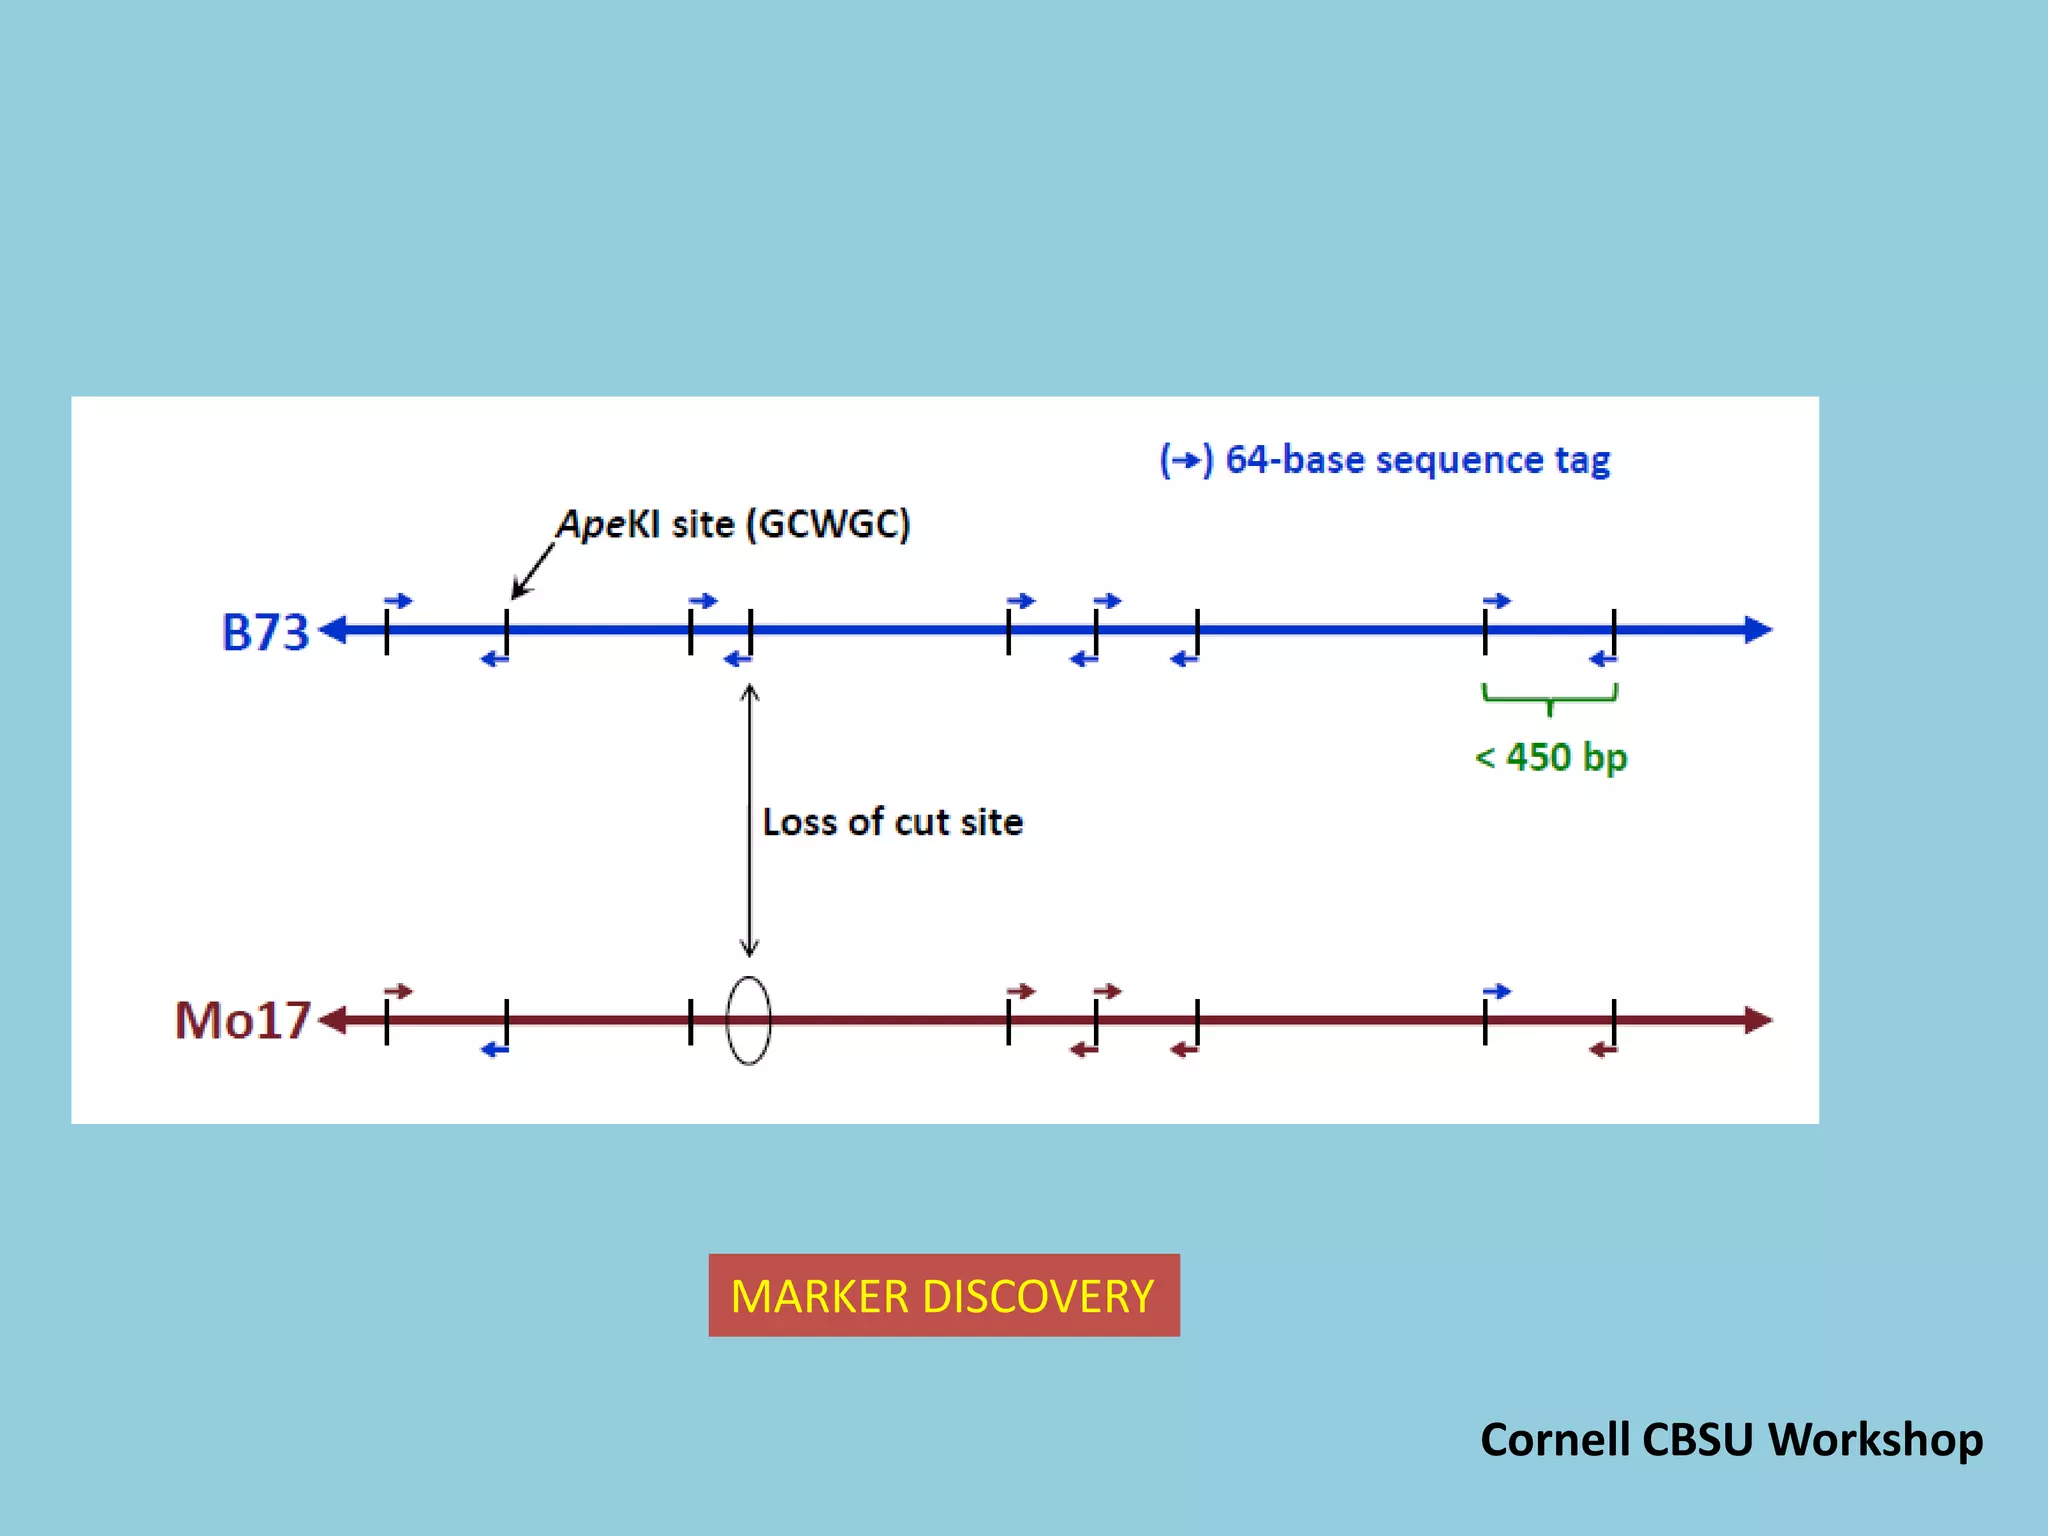
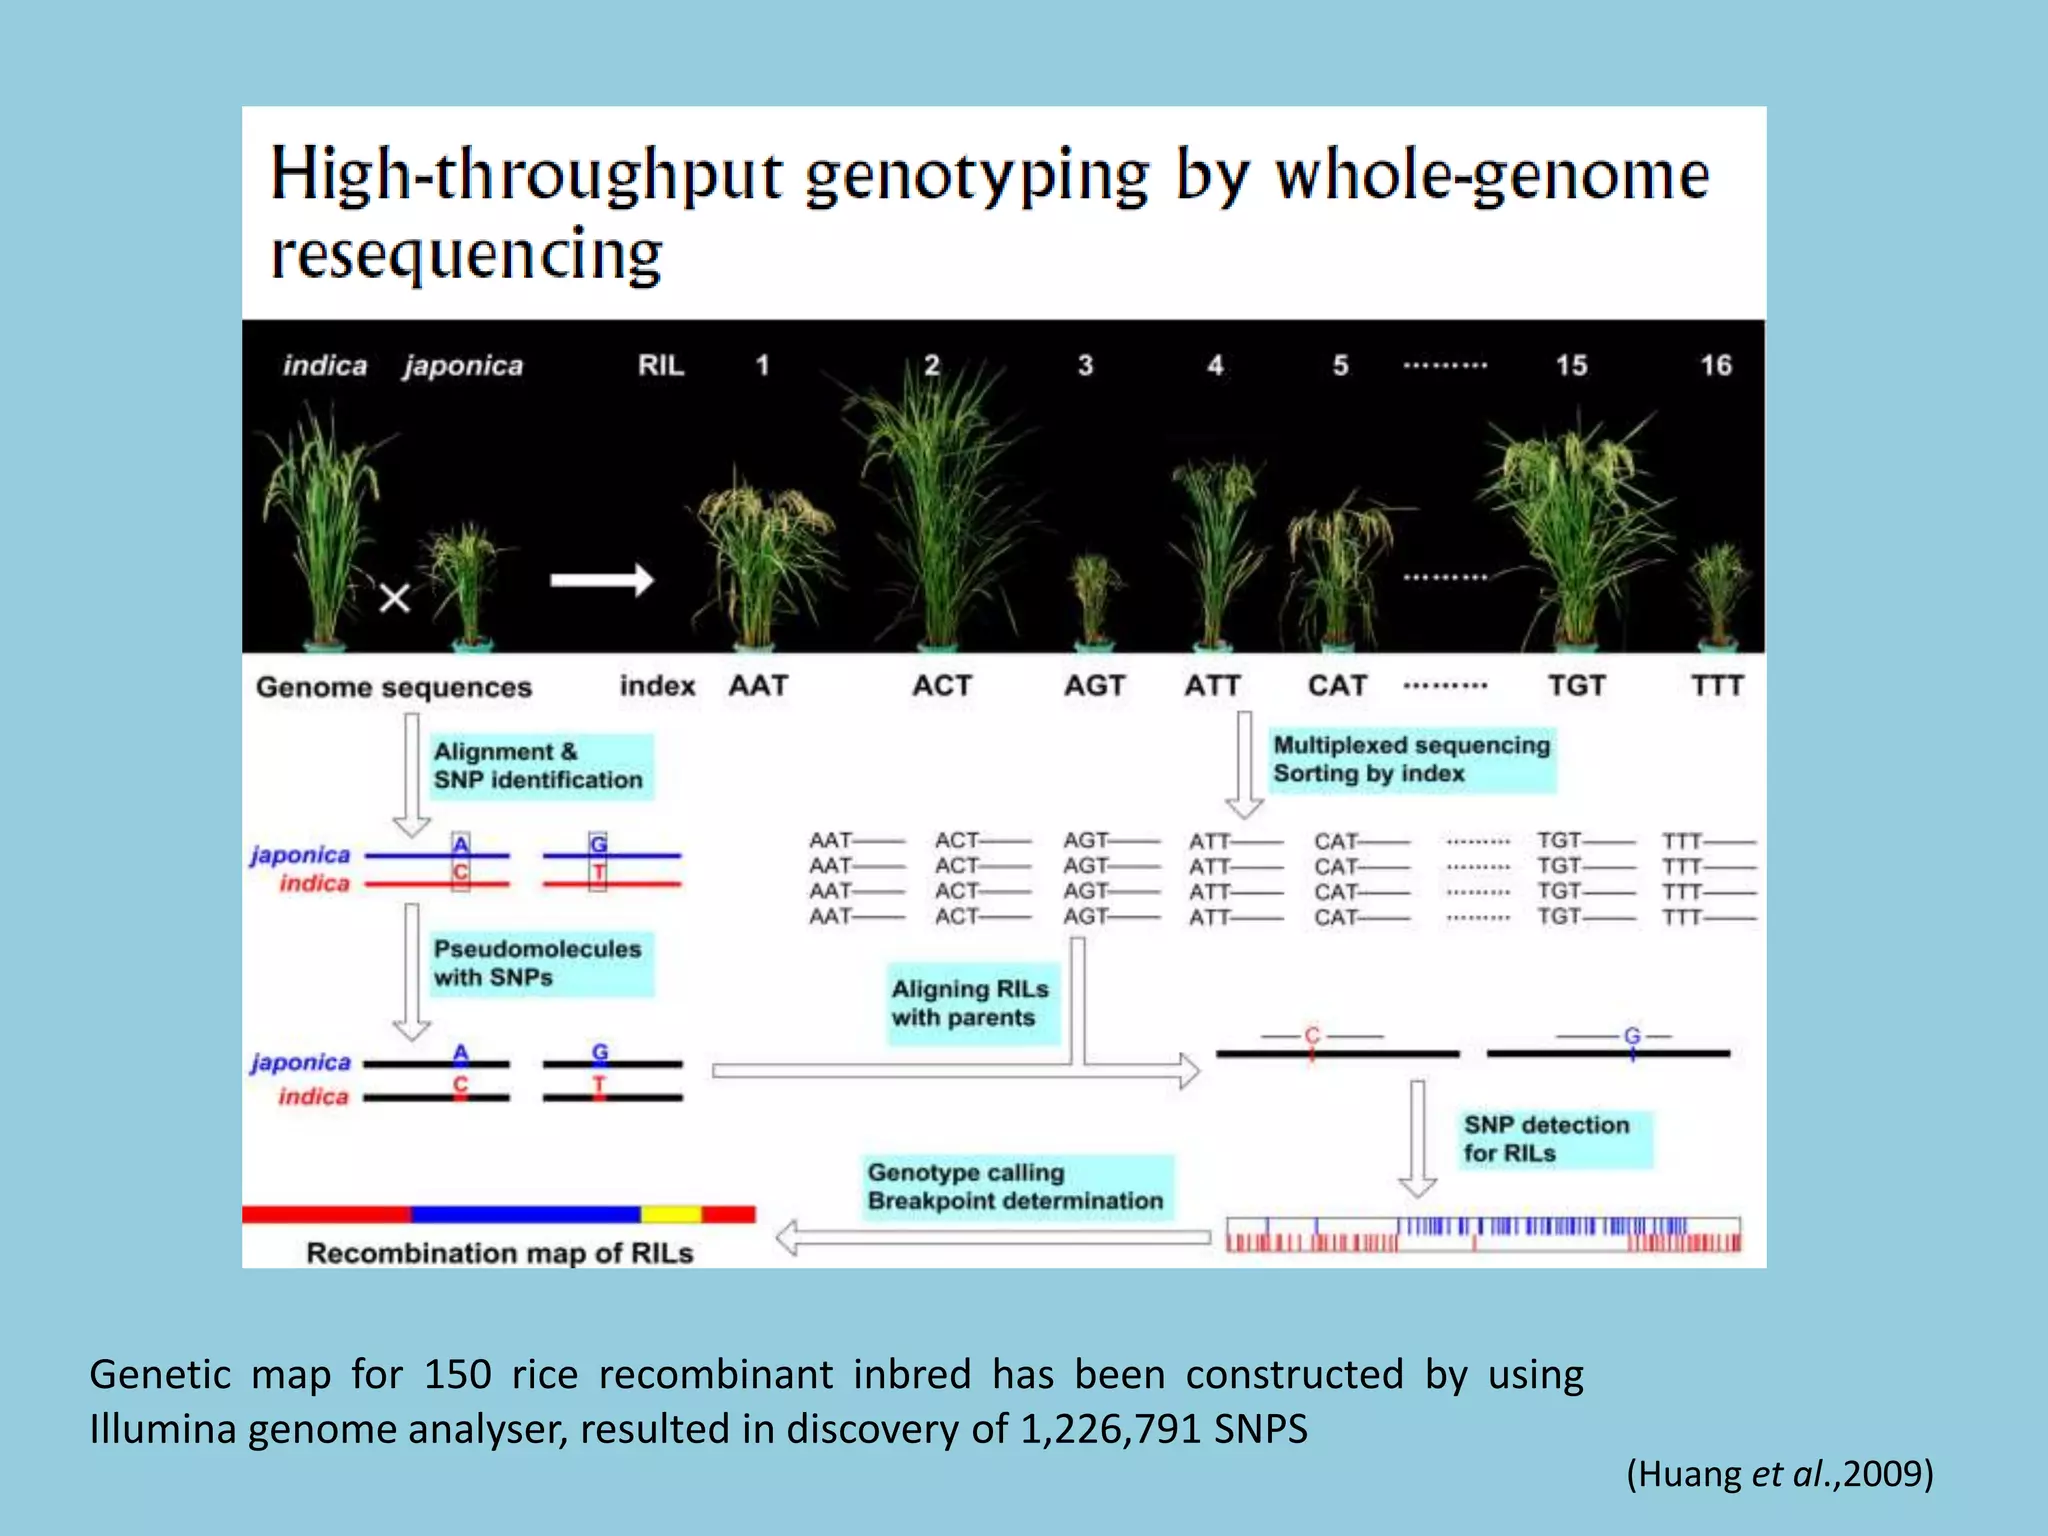
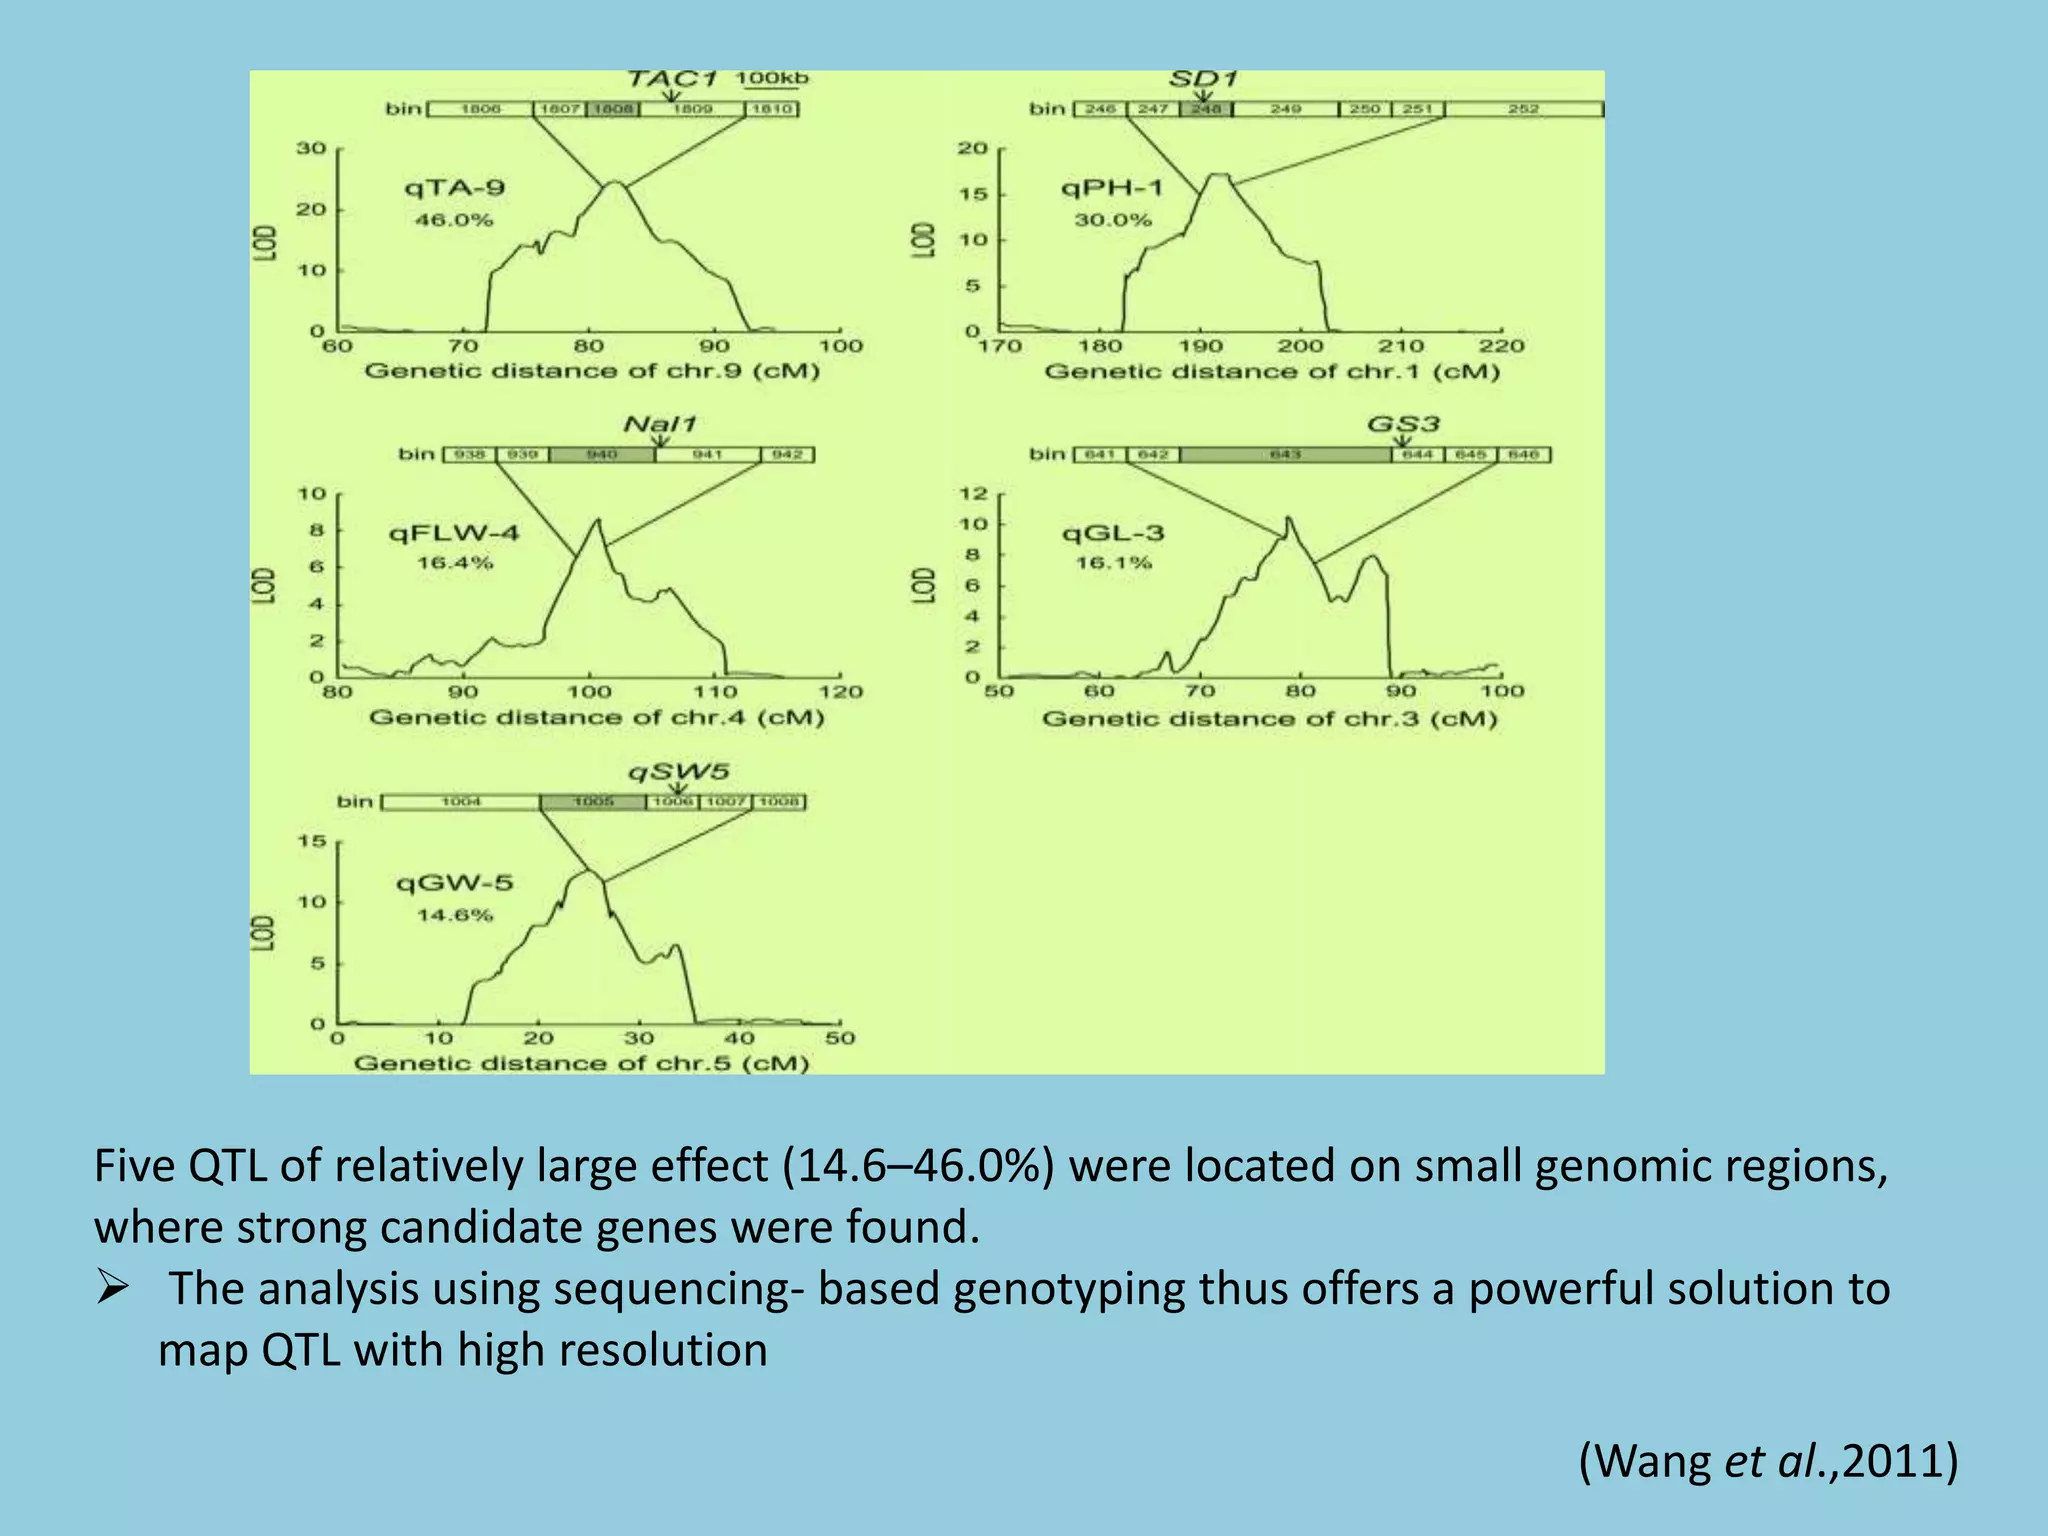
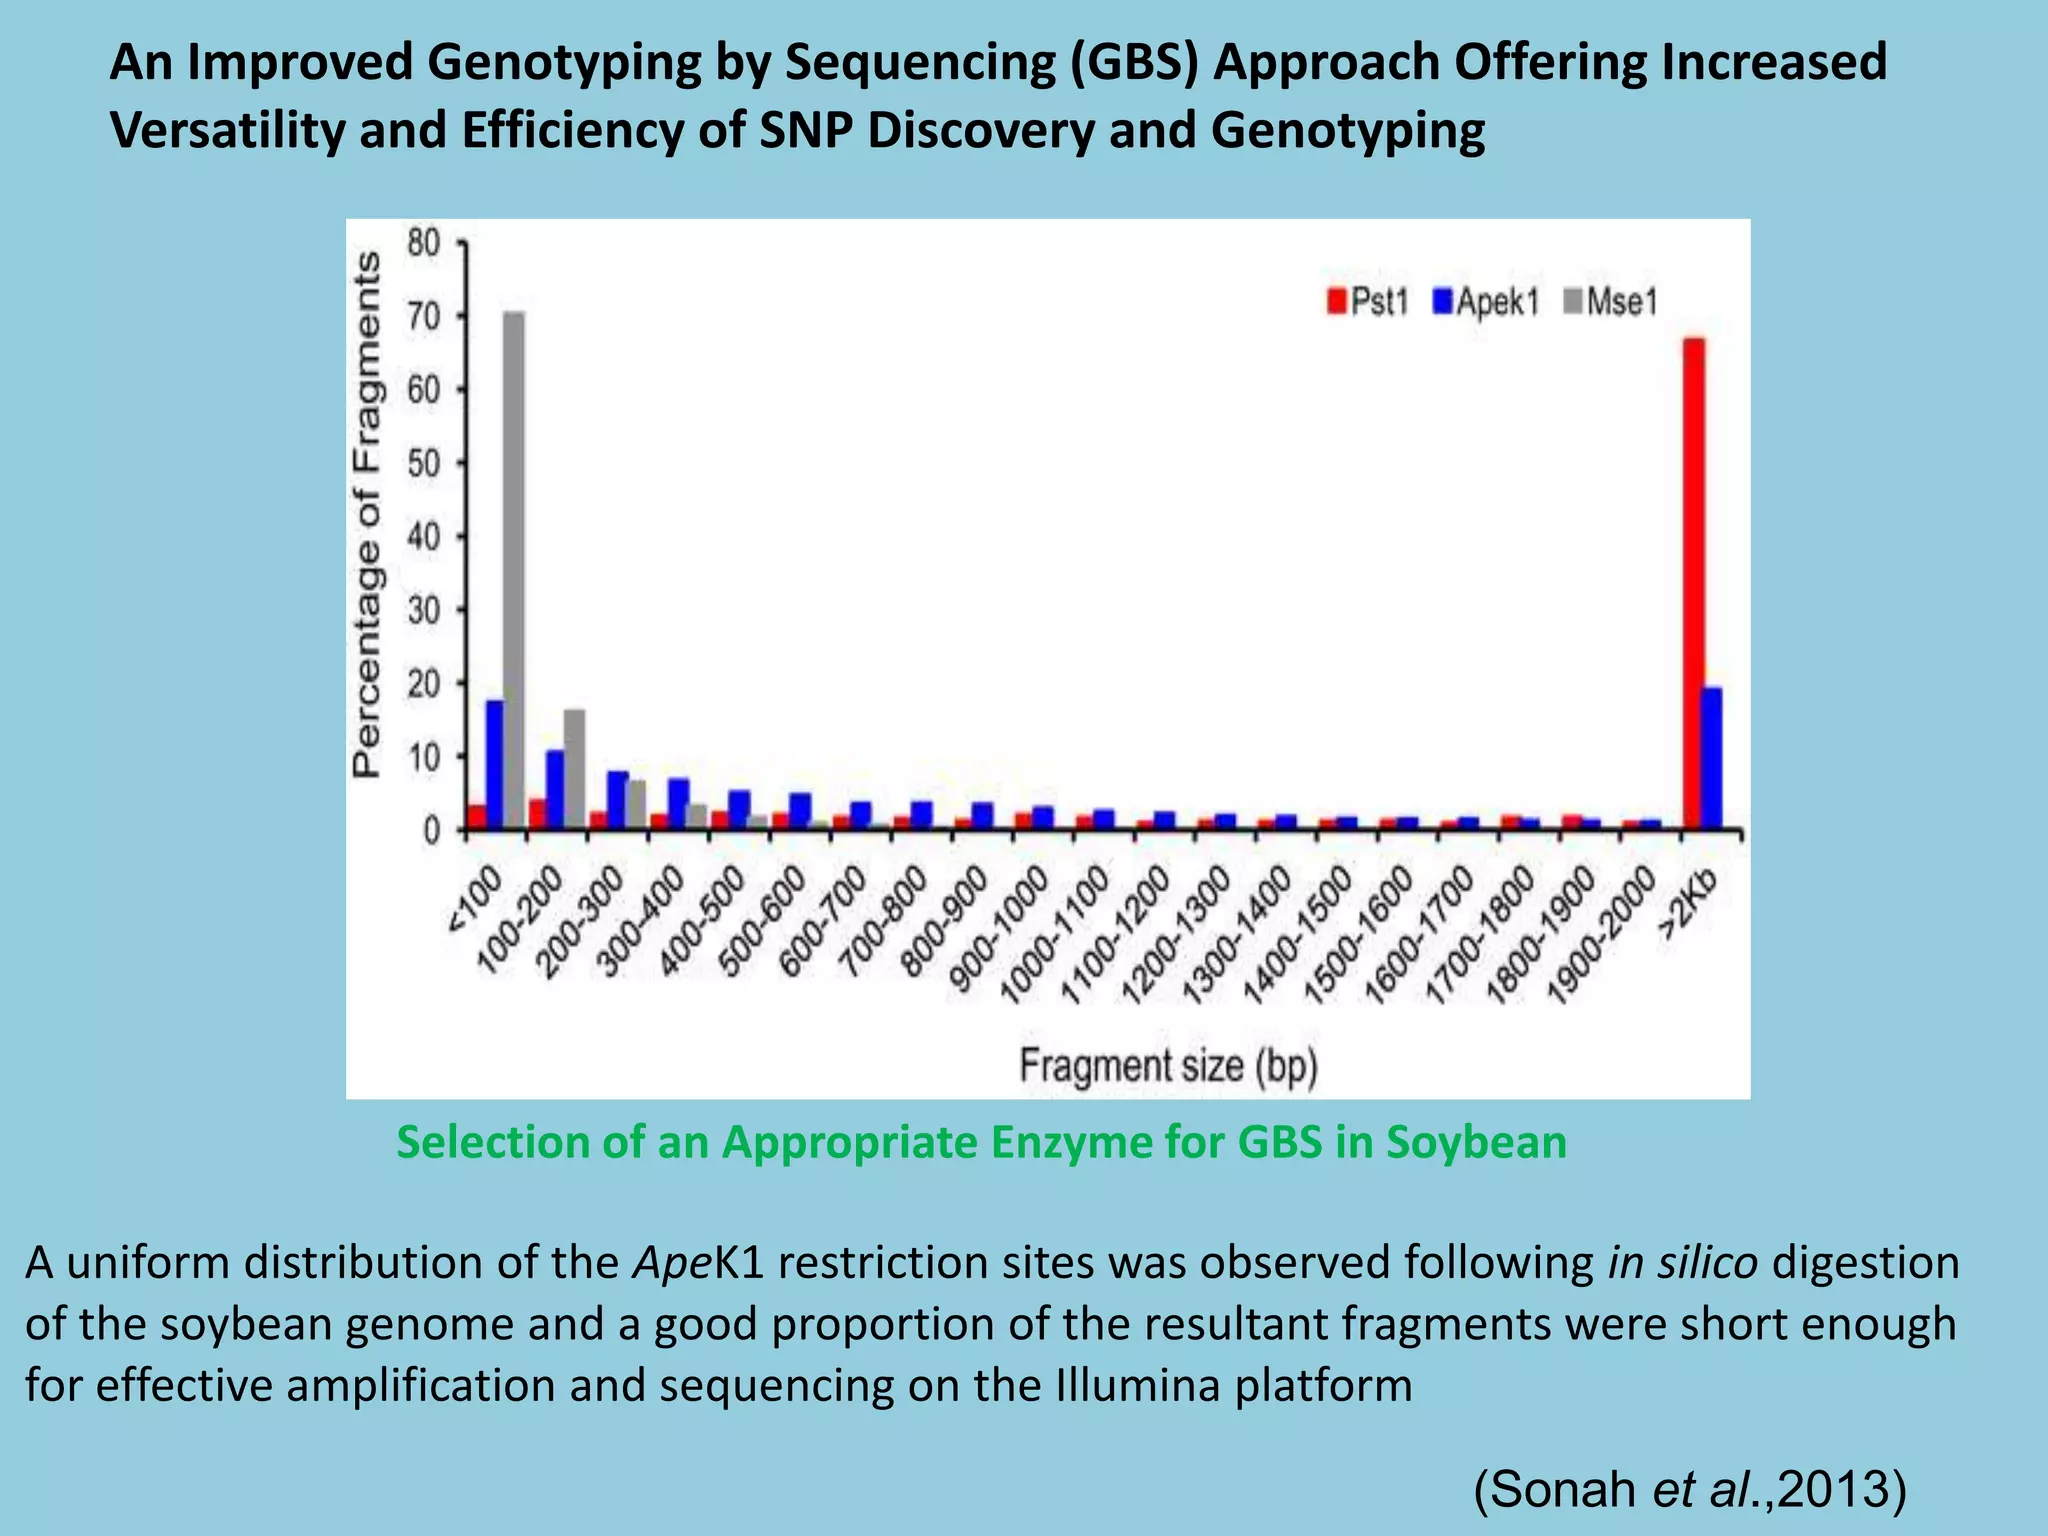
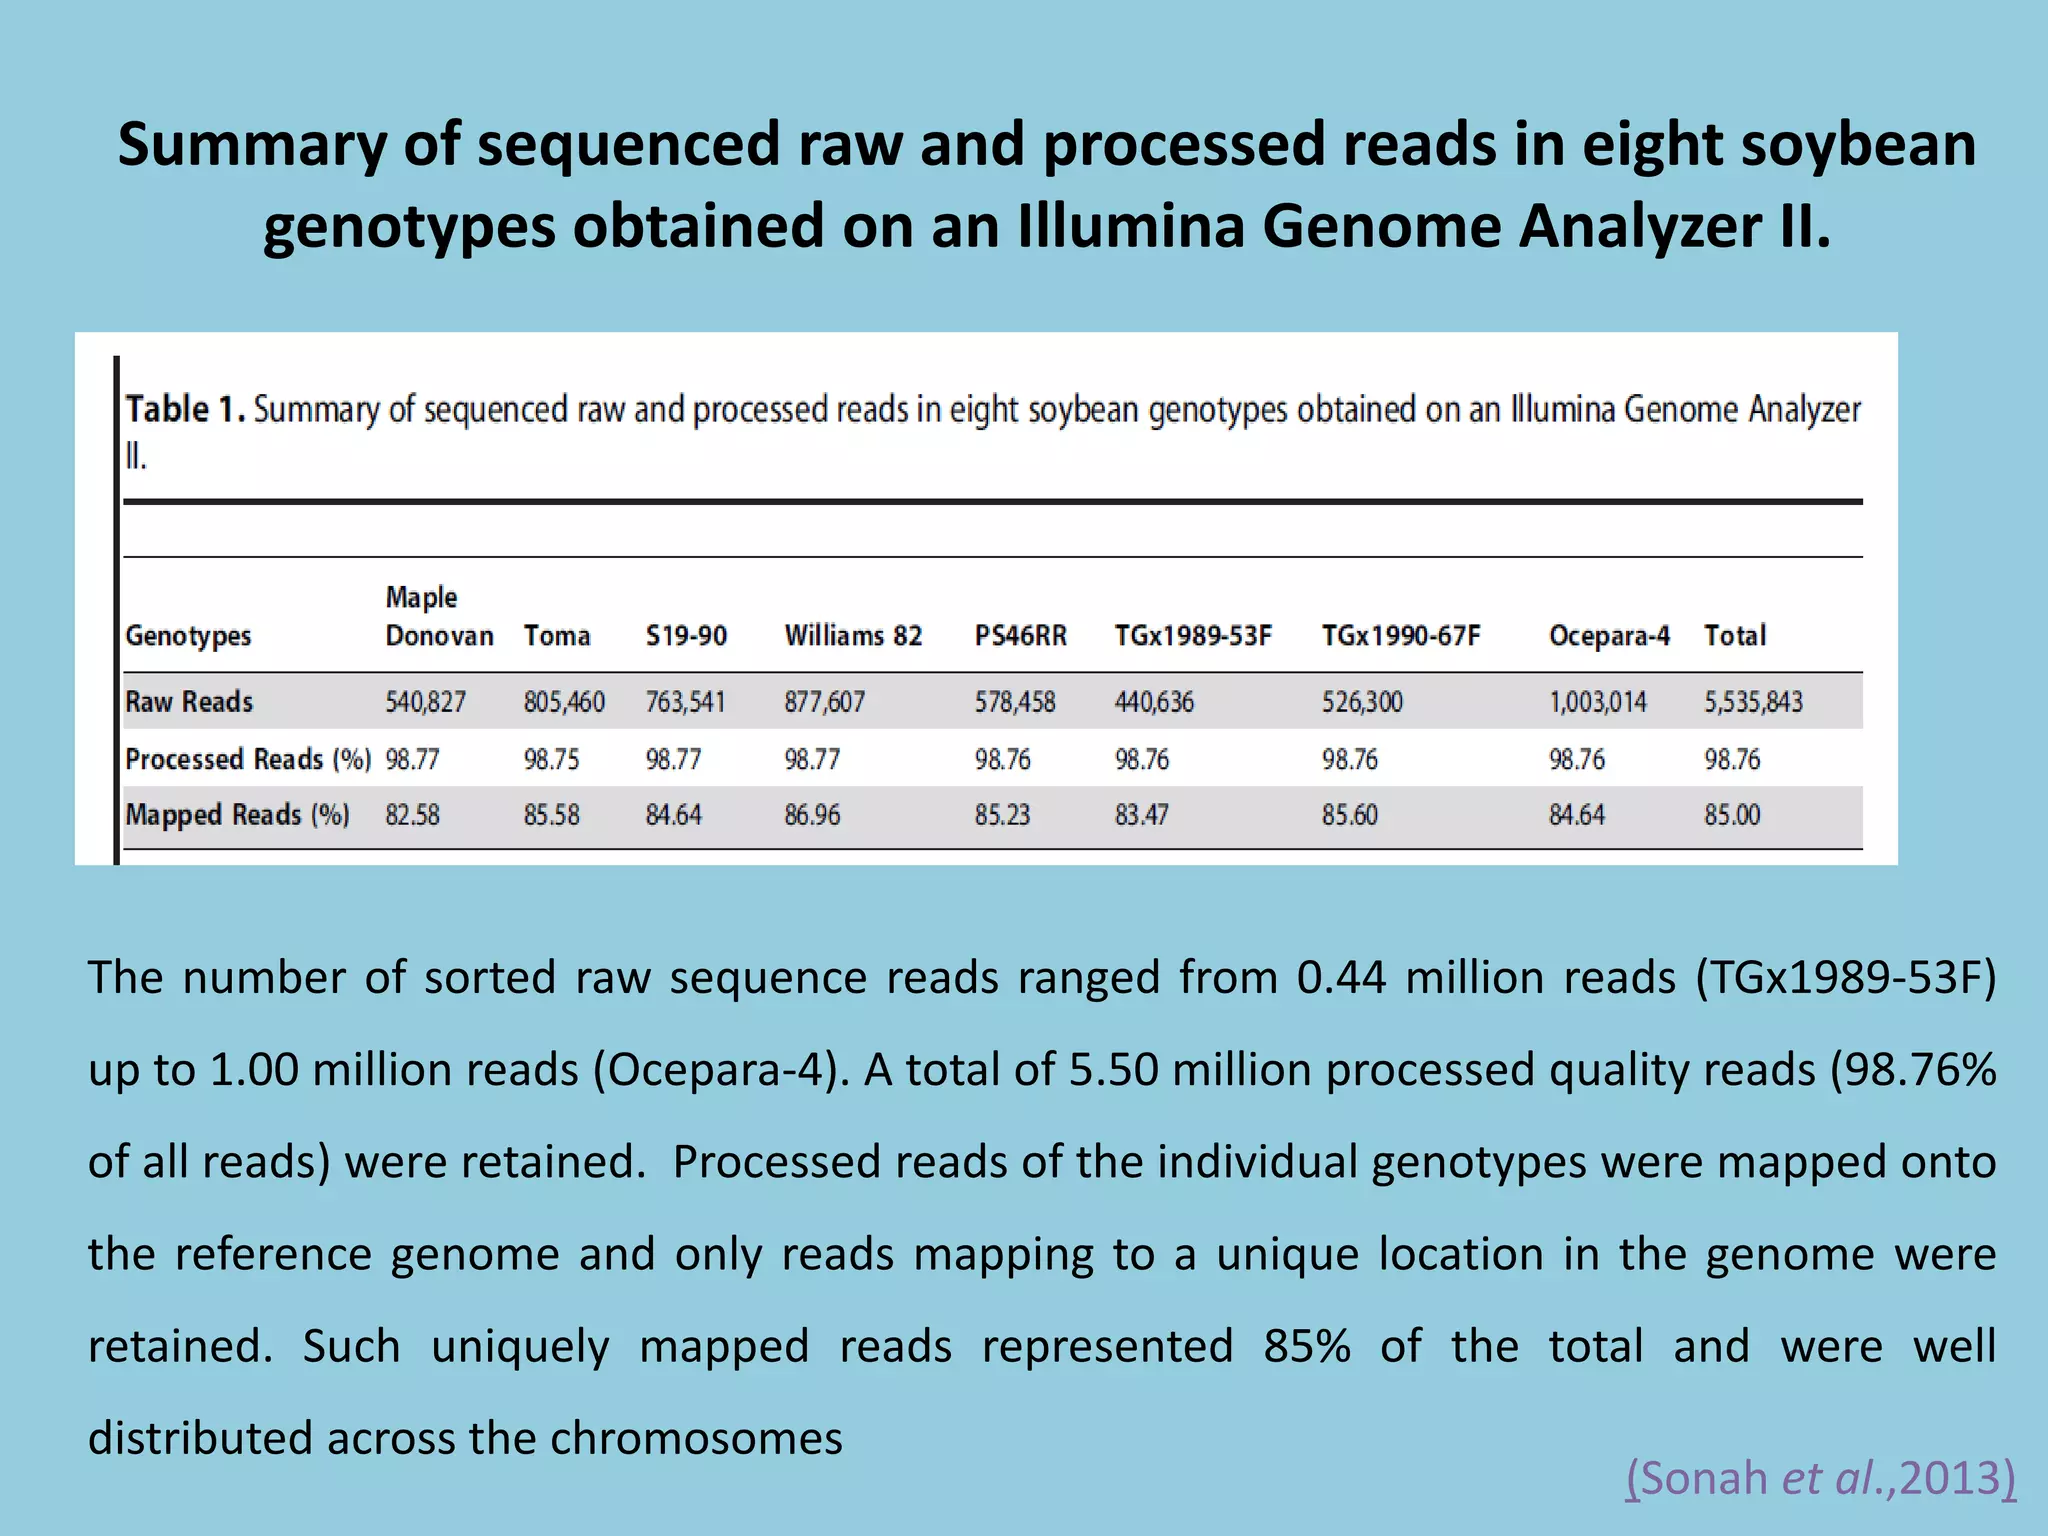
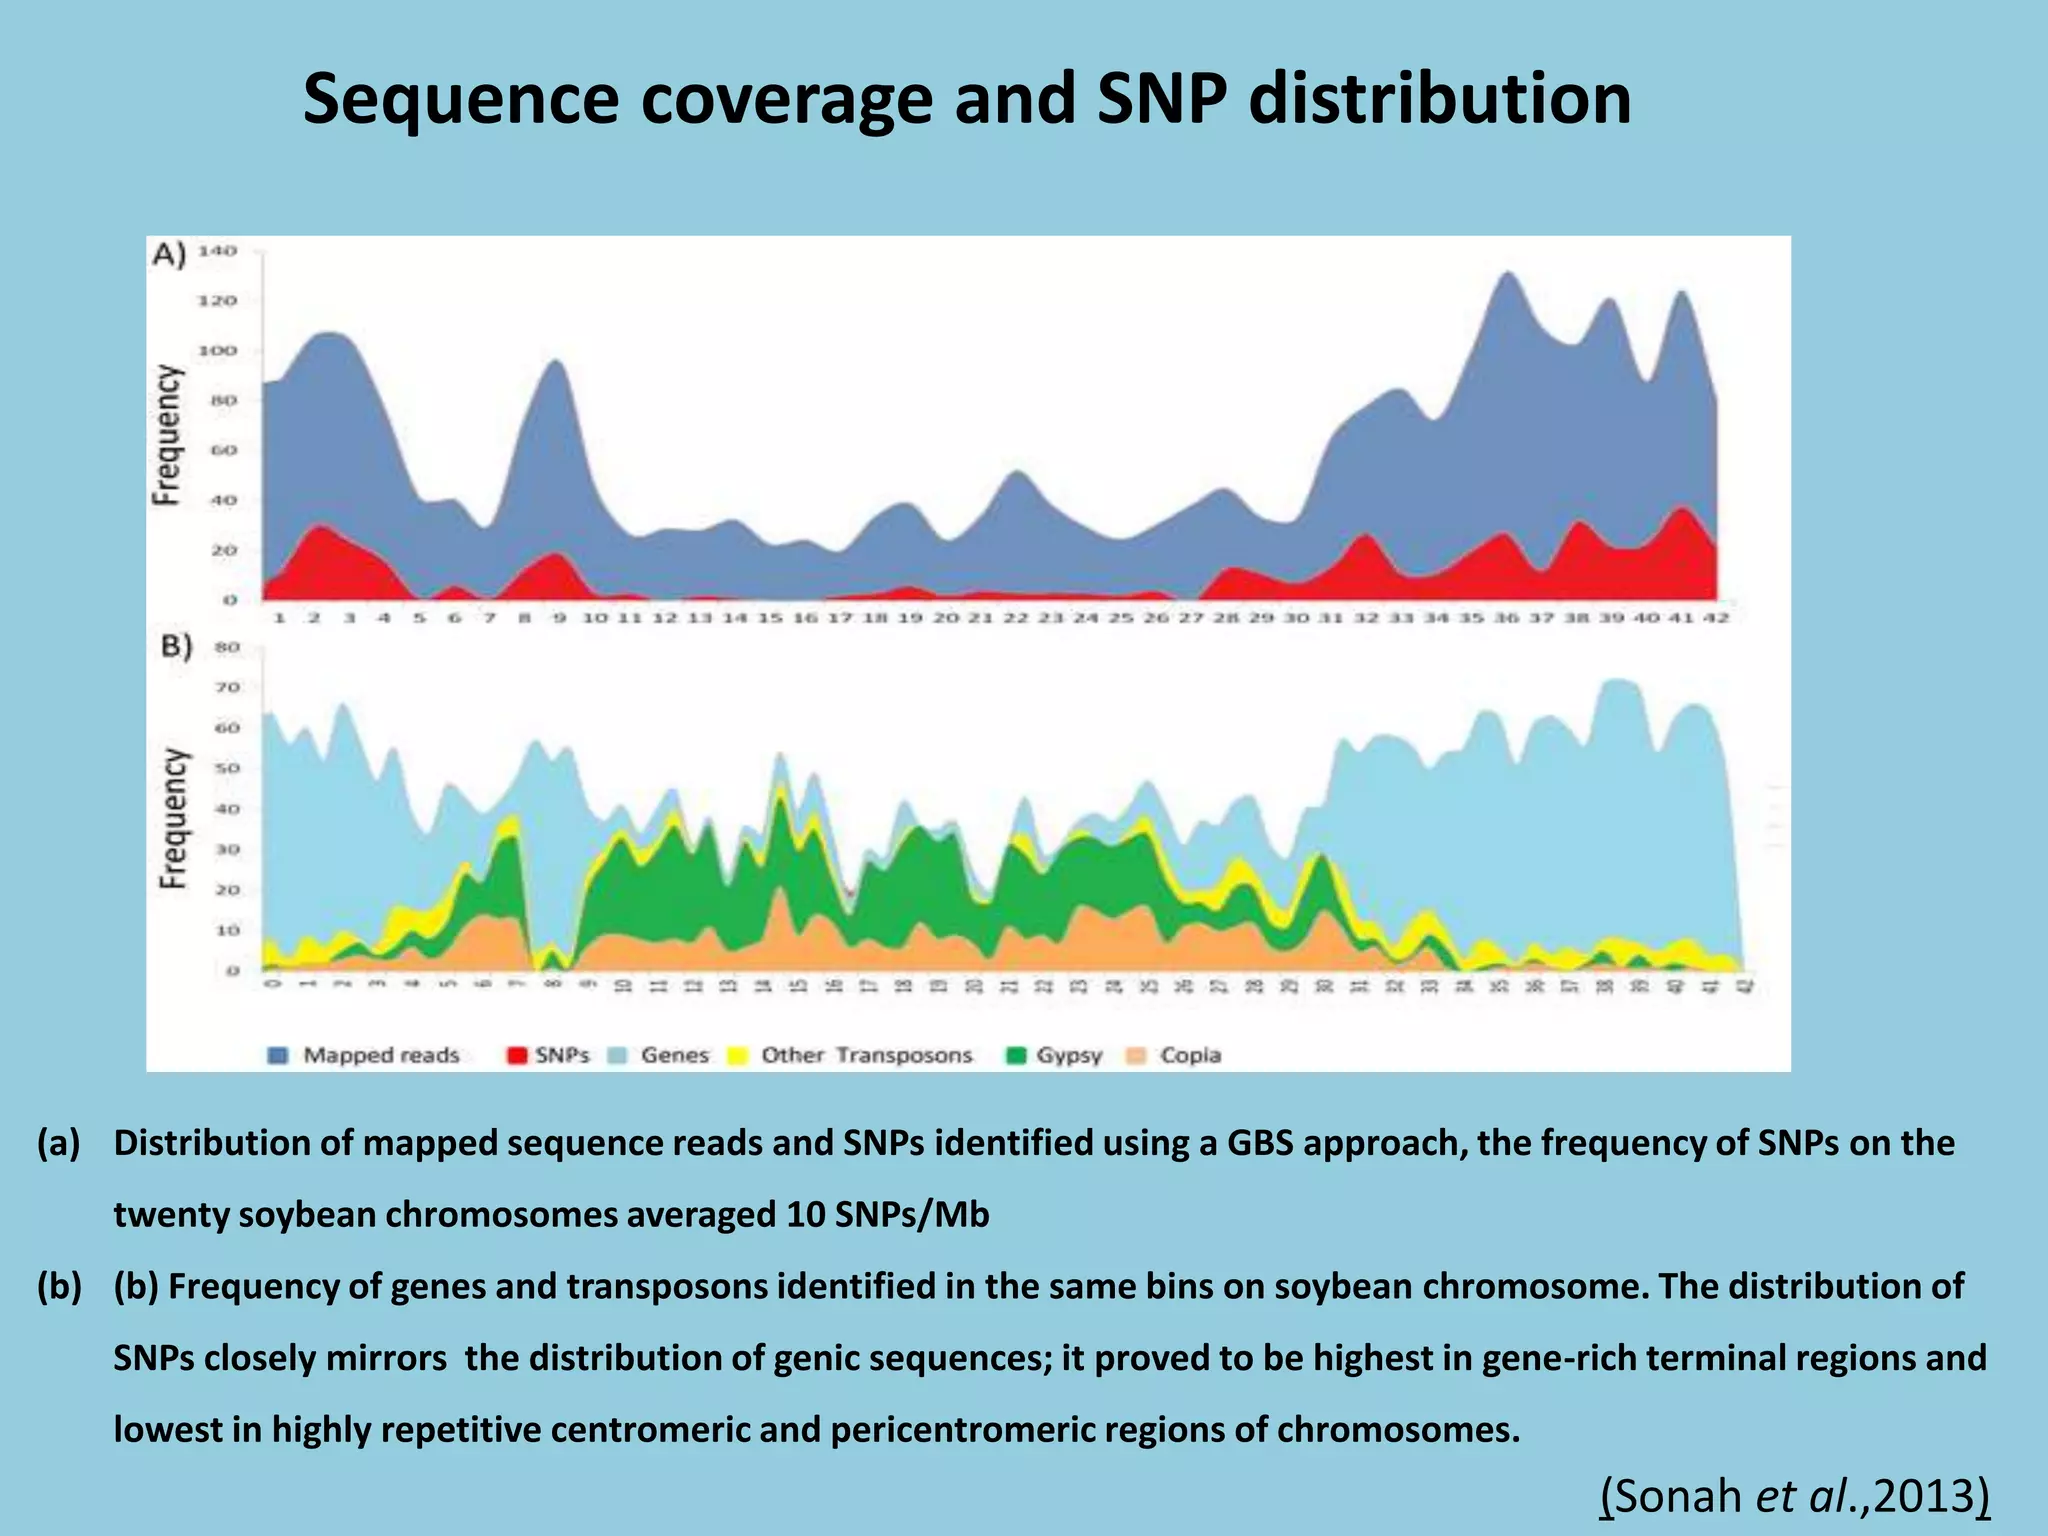
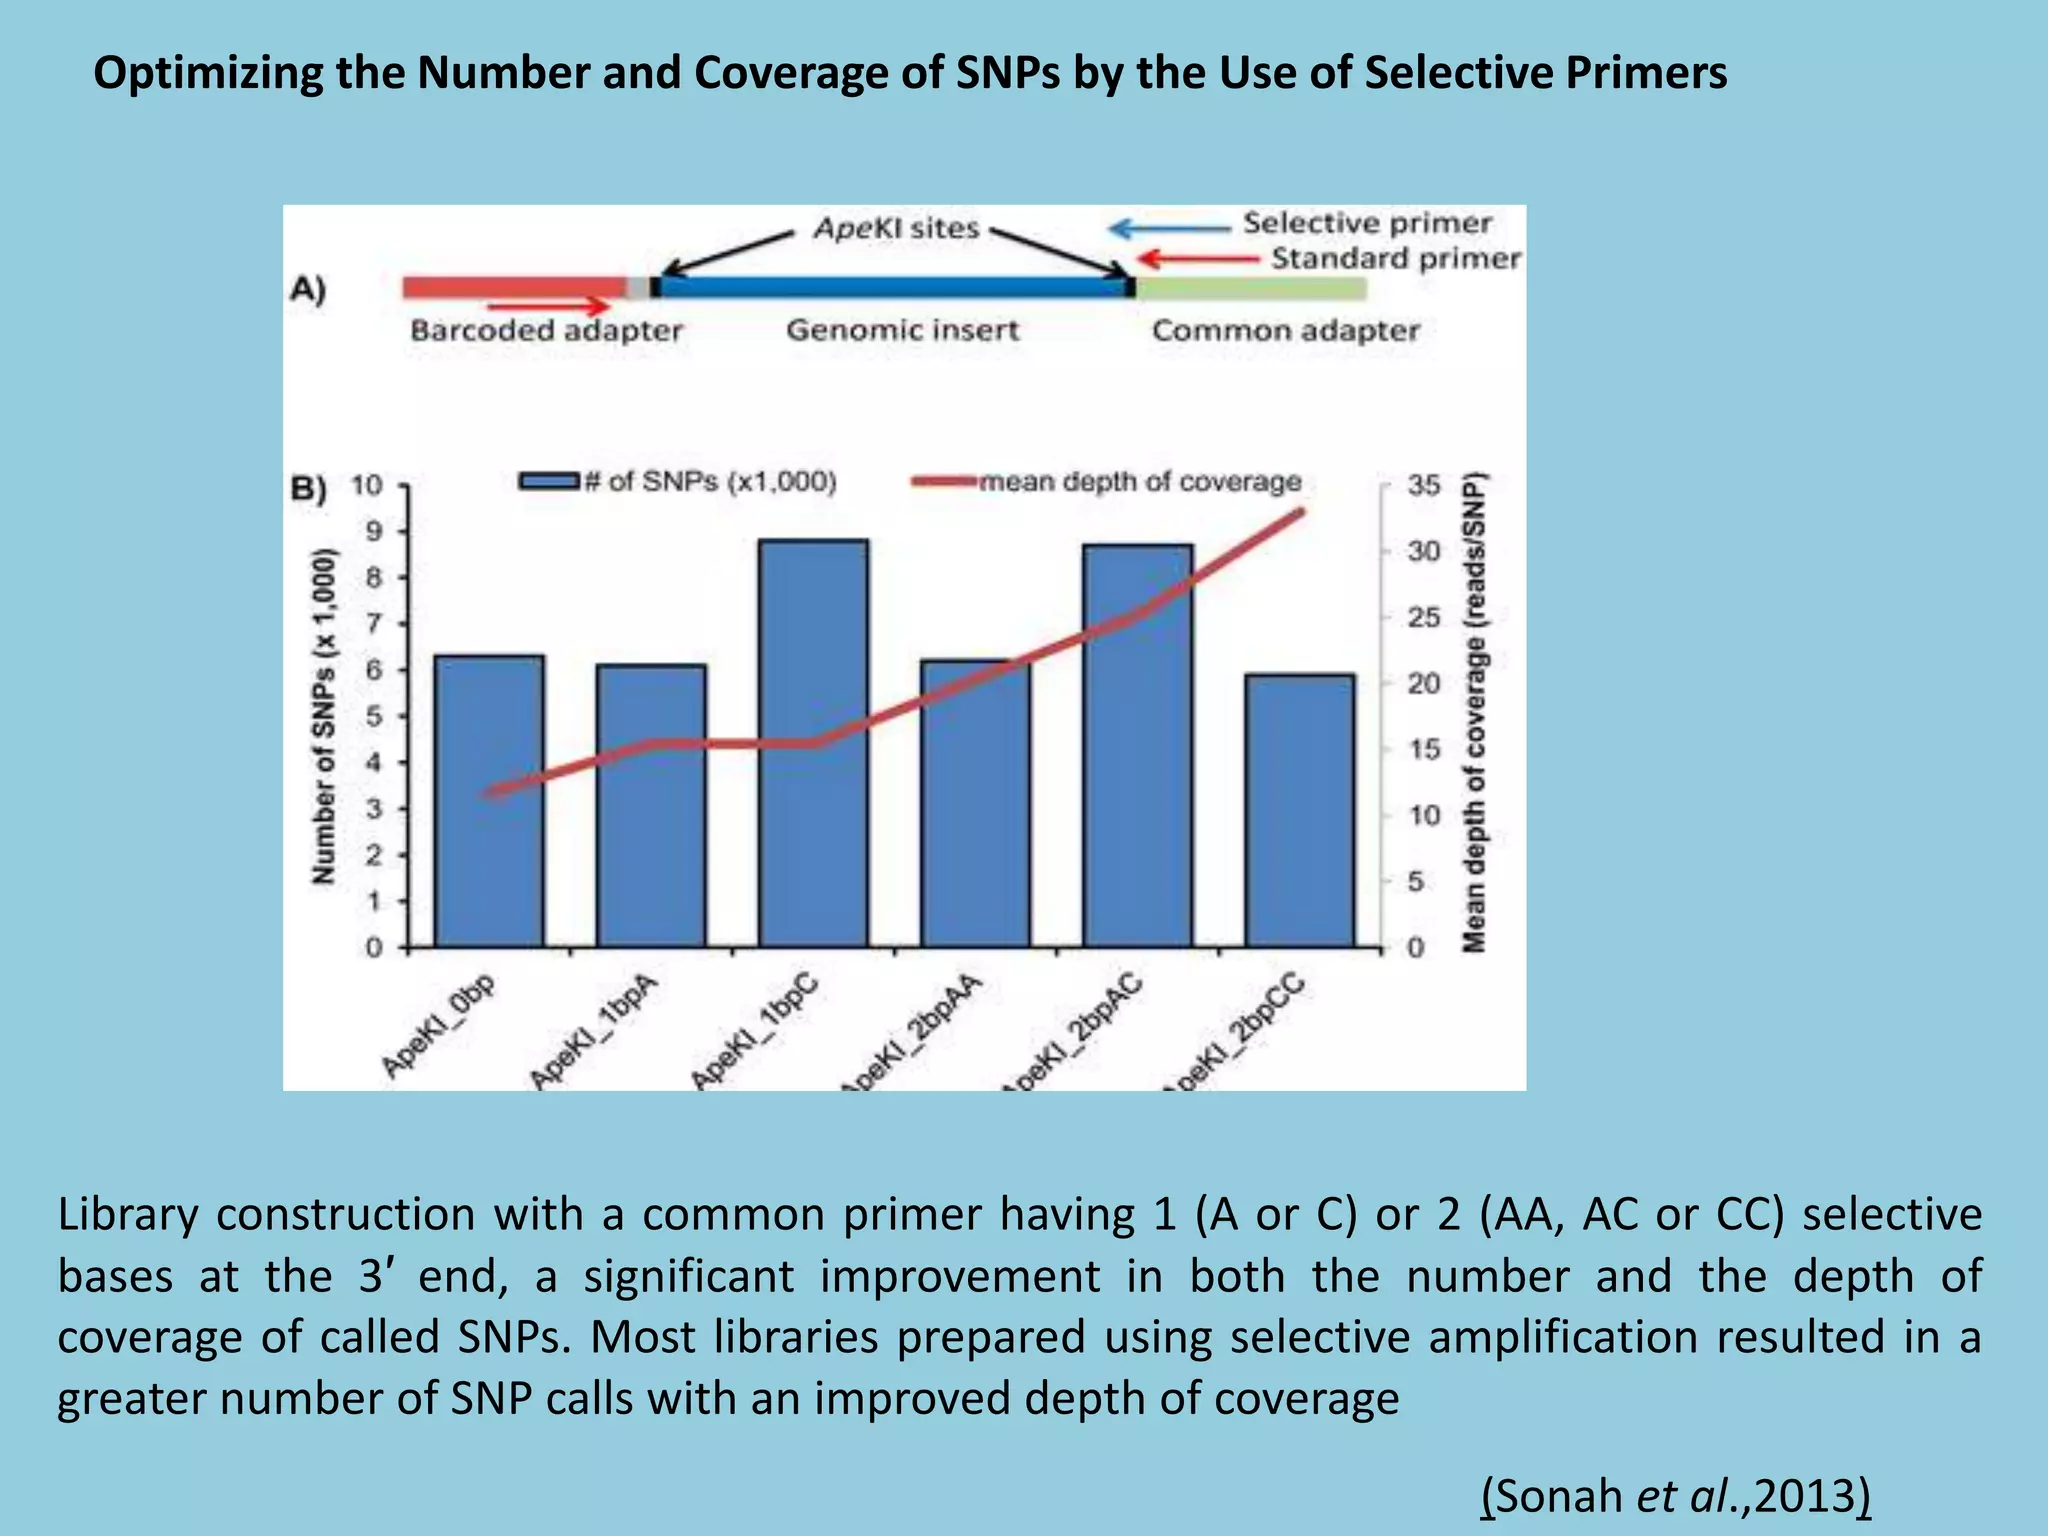
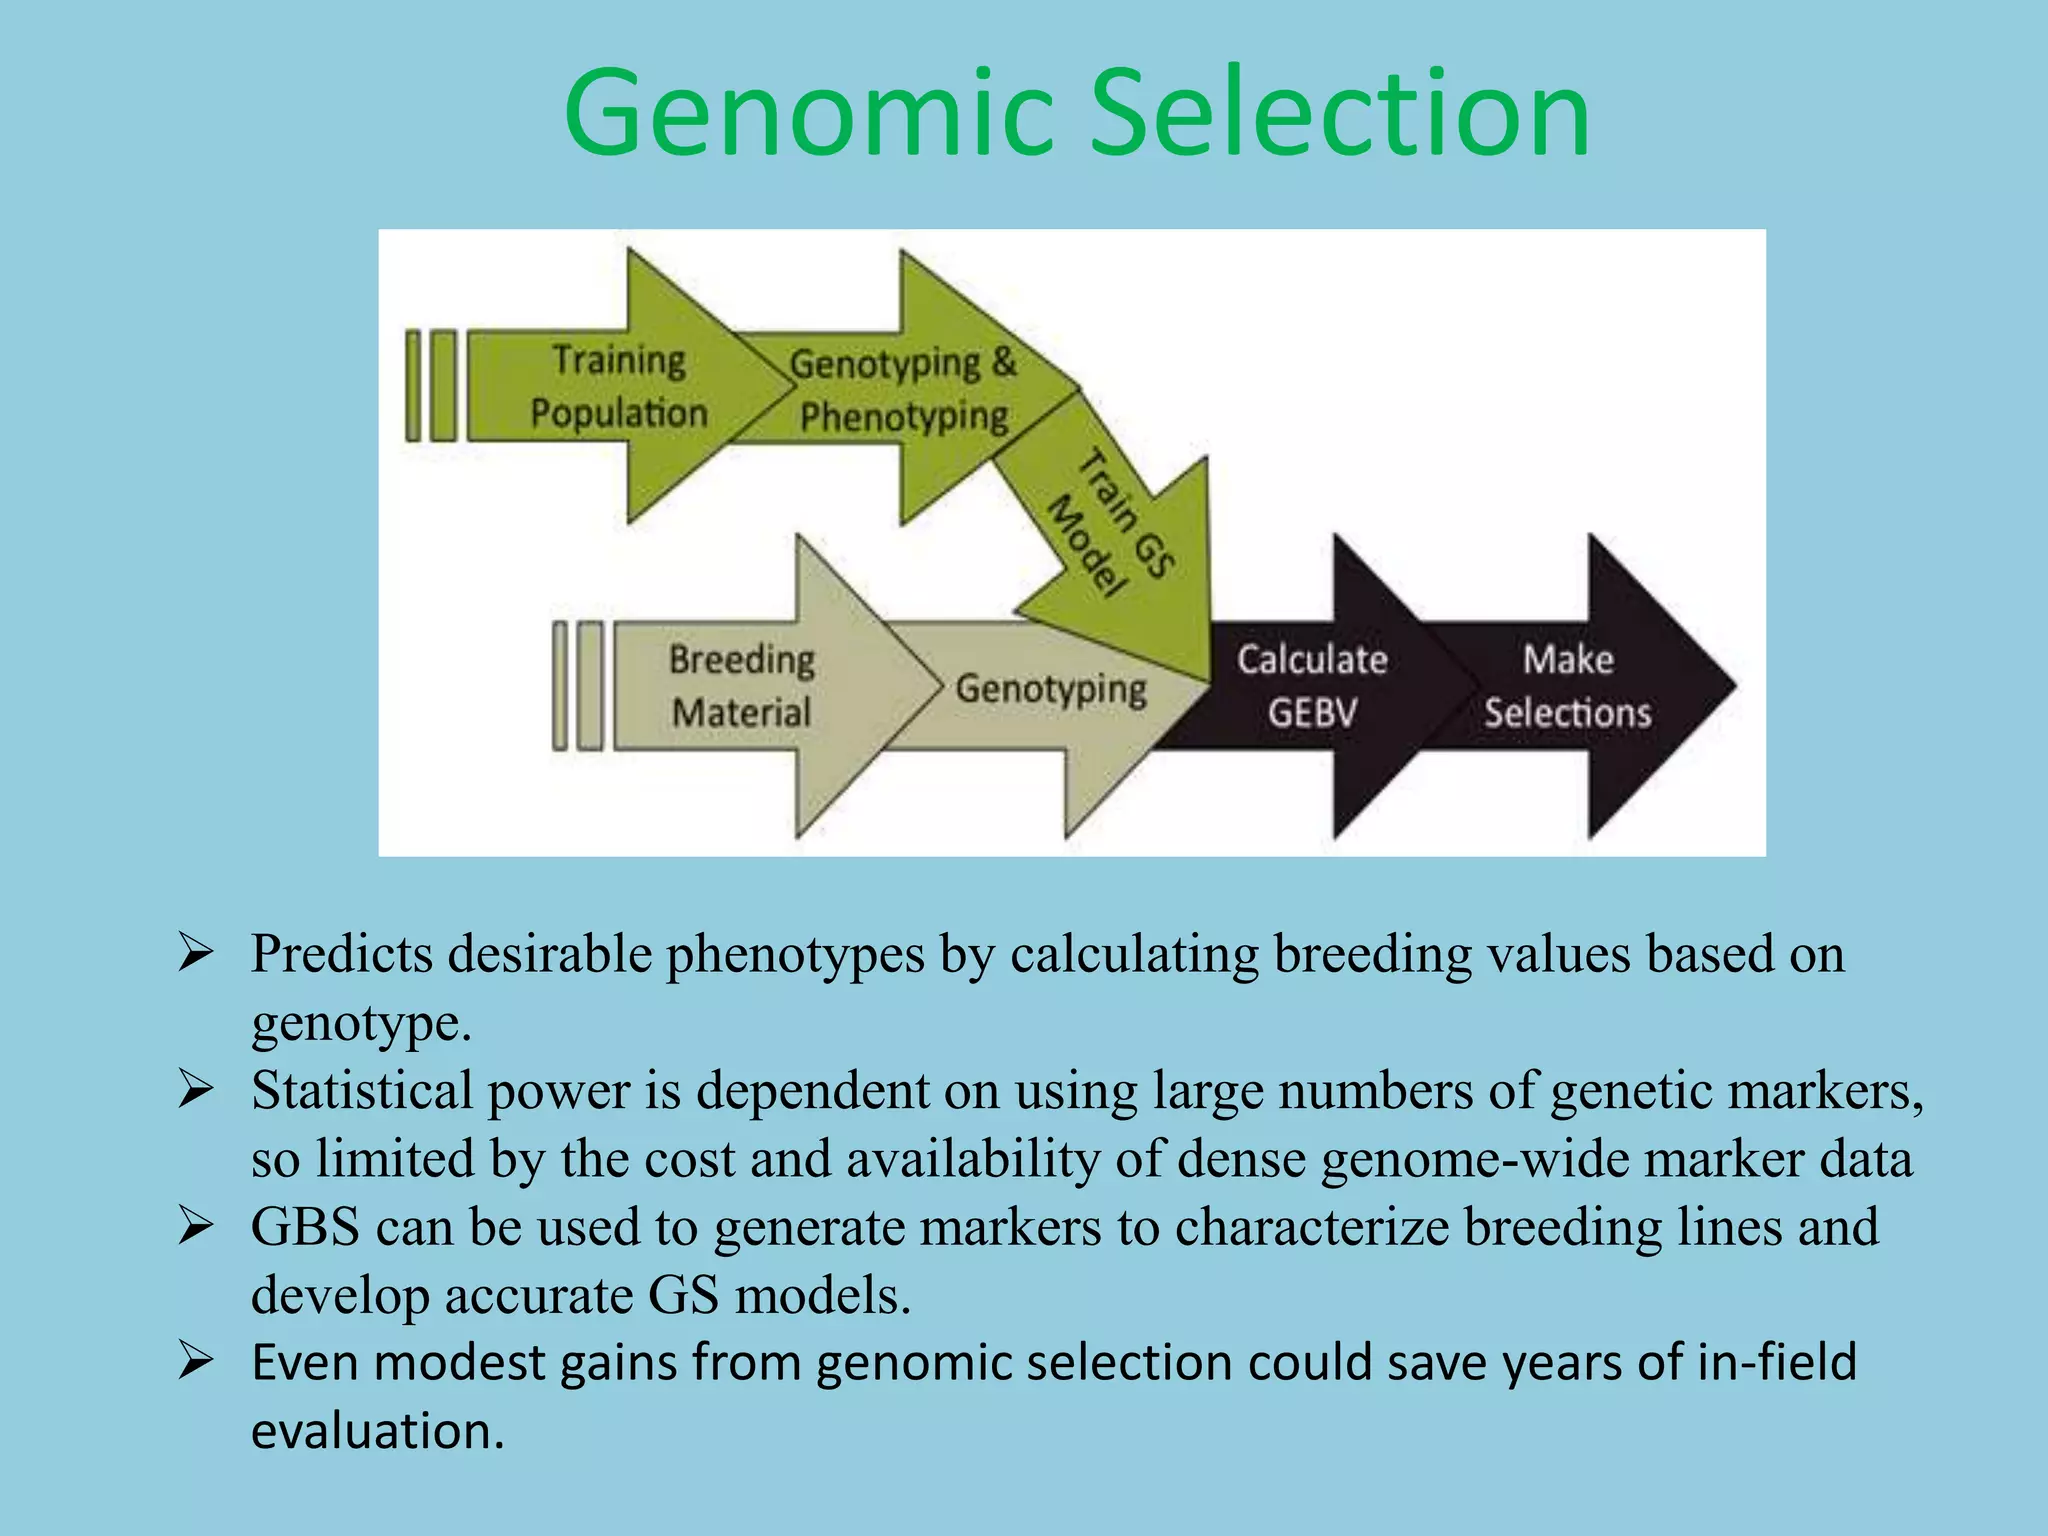
Genotyping by Sequencing (GBS) is an efficient method for high-throughput marker discovery and genotyping, particularly suited for complex genomes. GBS simplifies library preparation, reduces costs, and enhances accuracy in genomic selection, making it a valuable tool in plant genetics and breeding. The document discusses various GBS applications and advancements, showcasing its effectiveness in identifying single nucleotide polymorphisms (SNPs) across different species.