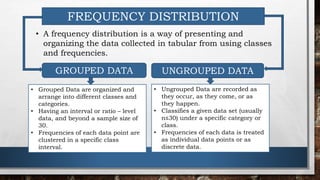
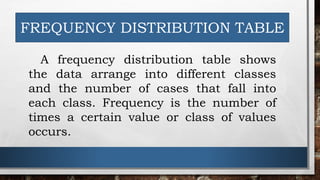
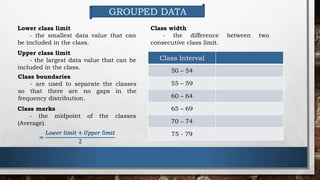
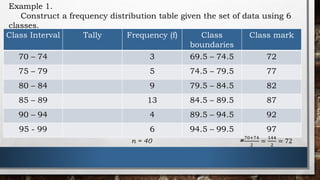
- A frequency distribution organizes data into classes and displays the frequency of observations in each class.
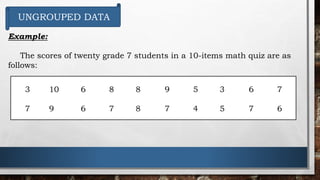
- Grouped data uses classes with cut-offs to group interval or ratio level data, while ungrouped data lists each observation individually for smaller data sets.
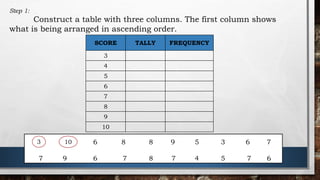
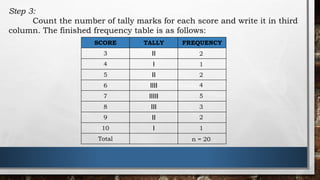
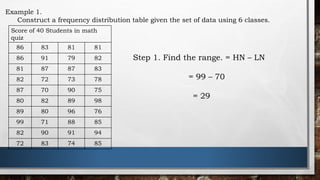
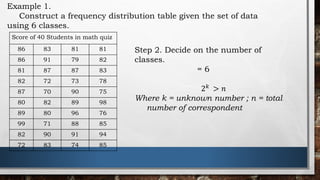
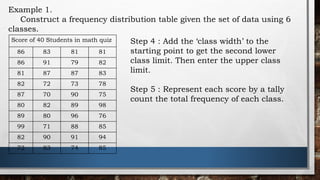
- To make a frequency distribution, the data's range is found and classes are determined. Each observation is tallied and frequencies per class are calculated. This displays the distribution of the data.