FREQUENCY
DISTRIBUTION
Frequency distribution isa
tabulation or grouping of data
into appropriate categories
showing the number of
observations in each group or
category.
A table that includes a set of
intervals and displays the
number of measurements in
each interval
3.
Class Limits/
Class Intervals
Class
Boundaries
Frequency
Class
Mark
Cumulative
FrequencyPercentage
<cf >cf
44 – 50 43.5 – 50.5 1 47 1 50 2%
51 – 57 50.5 – 57.5 5 54 6 49 10%
58 – 64 57.5 – 64.5 4 61 10 44 8%
65 – 71 64.5 – 71.5 13 68 23 40 26%
72 – 78 71.5 – 78.5 11 75 34 27 22%
79 – 85 78.5 – 85.5 11 82 45 16 22%
86 – 92 85.5 – 92.5 4 89 49 5 8%
93 – 99 92.5 – 99.5 1 96 50 1 2%
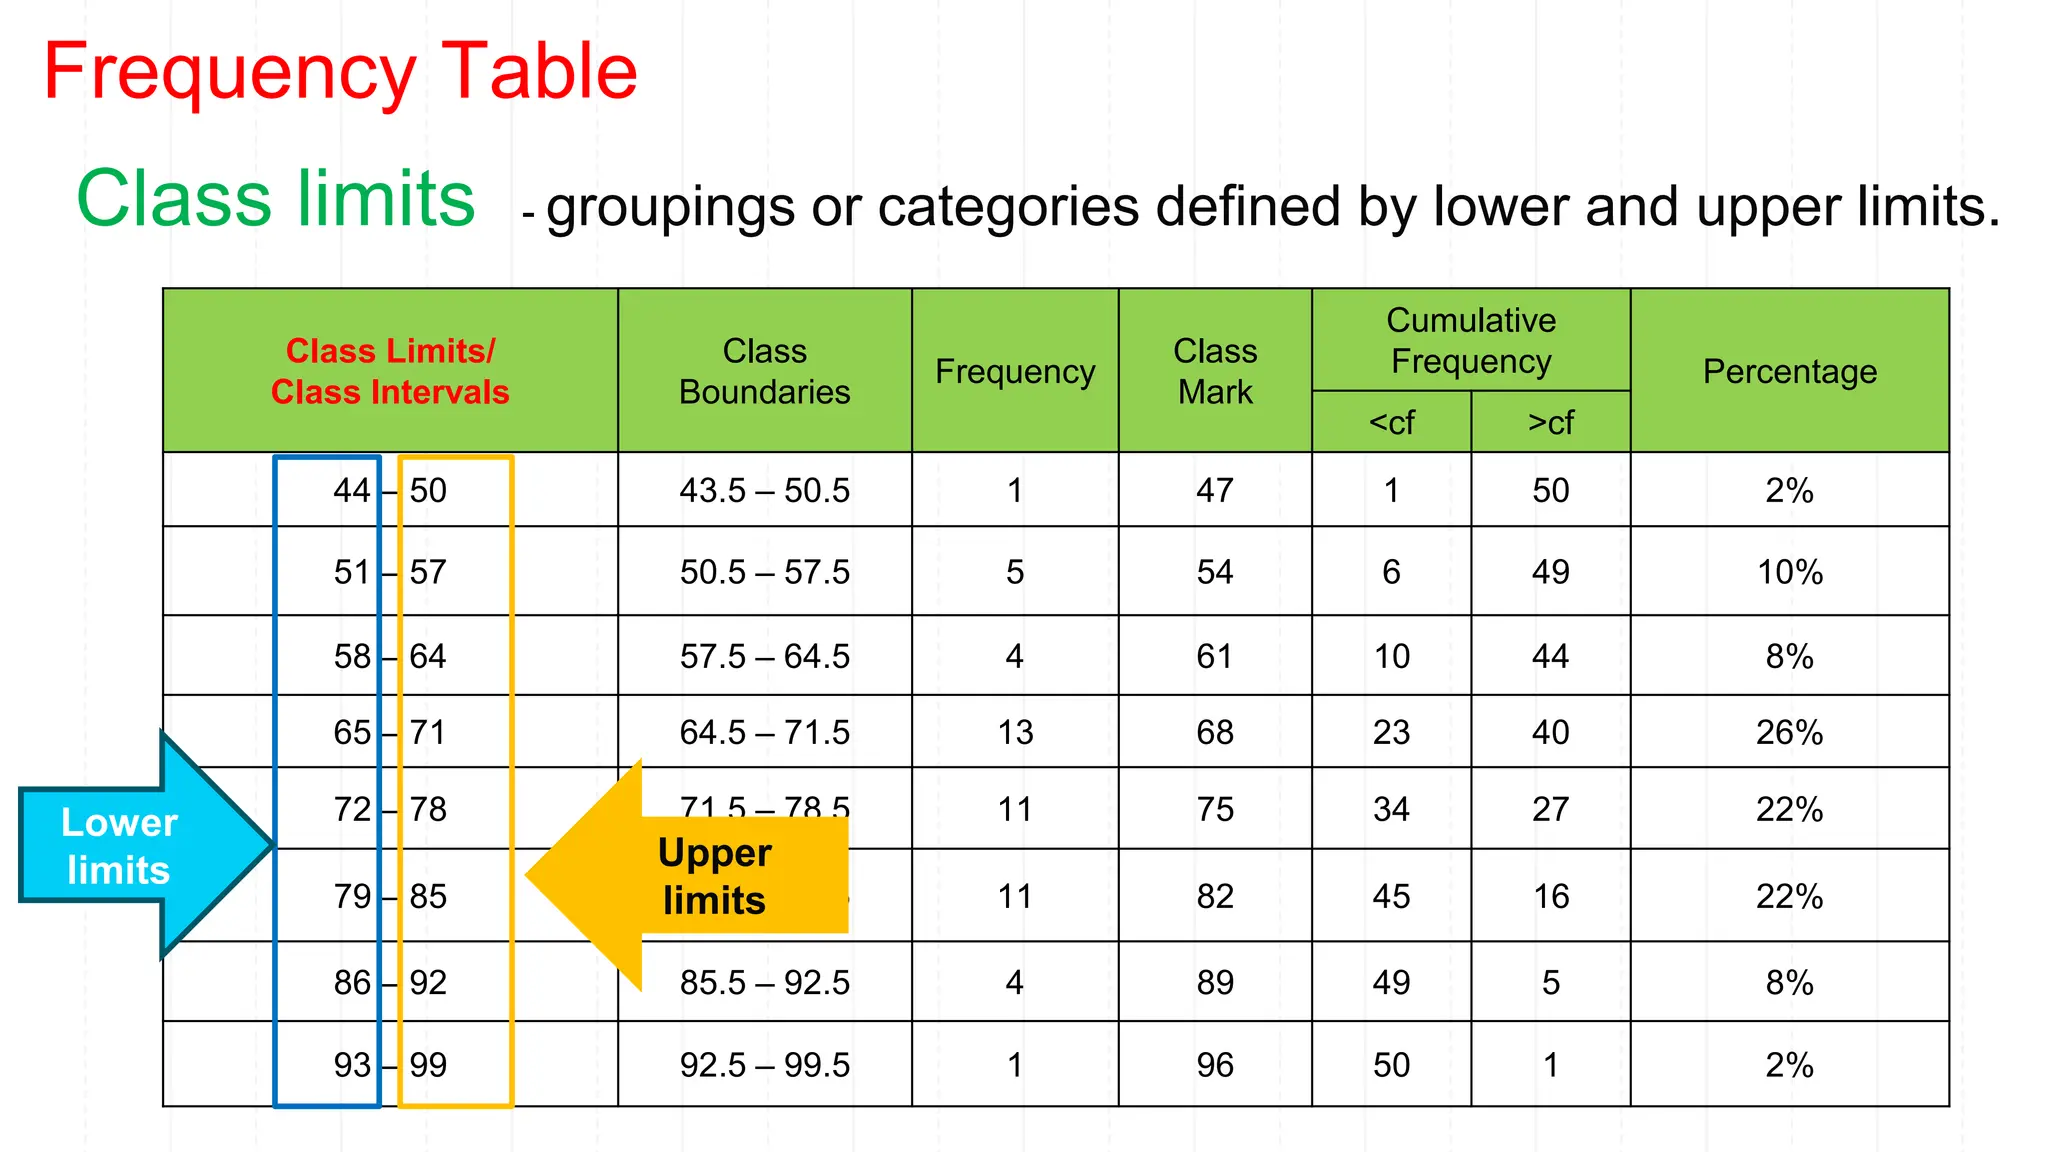
Frequency Table
Class limits - groupings or categories defined by lower and upper limits.
Lower
limits Upper
limits
4.
Class Limits/
Class Intervals
ClassBoundaries Frequency
Class
Mark
Cumulative
Frequency Percentage
<cf >cf
44 – 50 43.5 – 50.5 1 47 1 50 2%
51 – 57 50.5 – 57.5 5 54 6 49 10%
58 – 64 57.5 – 64.5 4 61 10 44 8%
65 – 71 64.5 – 71.5 13 68 23 40 26%
72 – 78 71.5 – 78.5 11 75 34 27 22%
79 – 85 78.5 – 85.5 11 82 45 16 22%
86 – 92 85.5 – 92.5 4 89 49 5 8%
93 – 99 92.5 – 99.5 1 96 50 1 2%
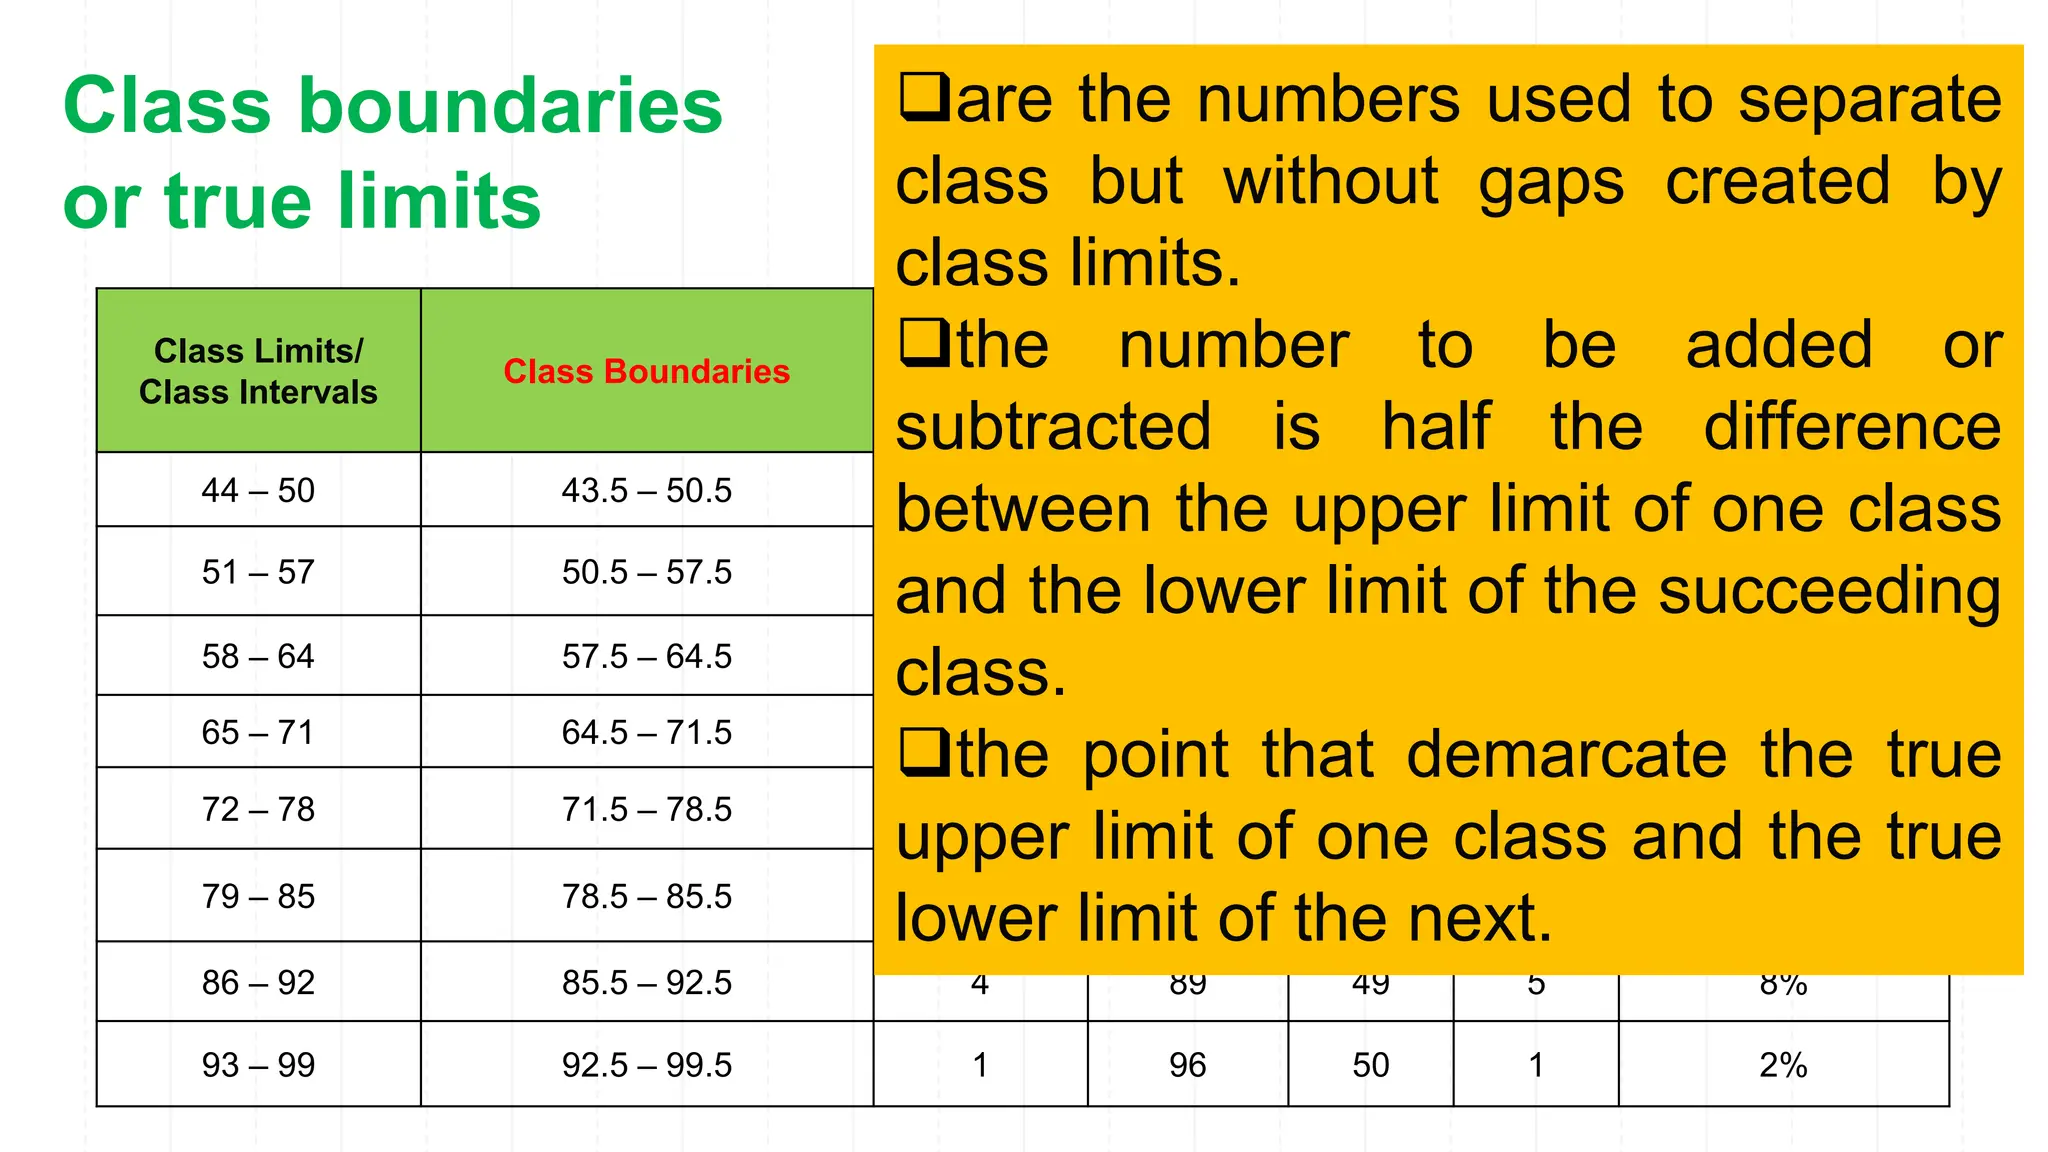
Class boundaries
or true limits
❑are the numbers used to separate
class but without gaps created by
class limits.
❑the number to be added or
subtracted is half the difference
between the upper limit of one class
and the lower limit of the succeeding
class.
❑the point that demarcate the true
upper limit of one class and the true
lower limit of the next.
5.
Class Limits/
Class Intervals
ClassBoundaries Frequency Class Mark
Cumulative
Frequency Percentage
<cf >cf
44 – 50 43.5 – 50.5 1 47 1 50 2%
51 – 57 50.5 – 57.5 5 54 6 49 10%
58 – 64 57.5 – 64.5 4 61 10 44 8%
65 – 71 64.5 – 71.5 13 68 23 40 26%
72 – 78 71.5 – 78.5 11 75 34 27 22%
79 – 85 78.5 – 85.5 11 82 45 16 22%
86 – 92 85.5 – 92.5 4 89 49 5 8%
93 – 99 92.5 – 99.5 1 96 50 1 2%
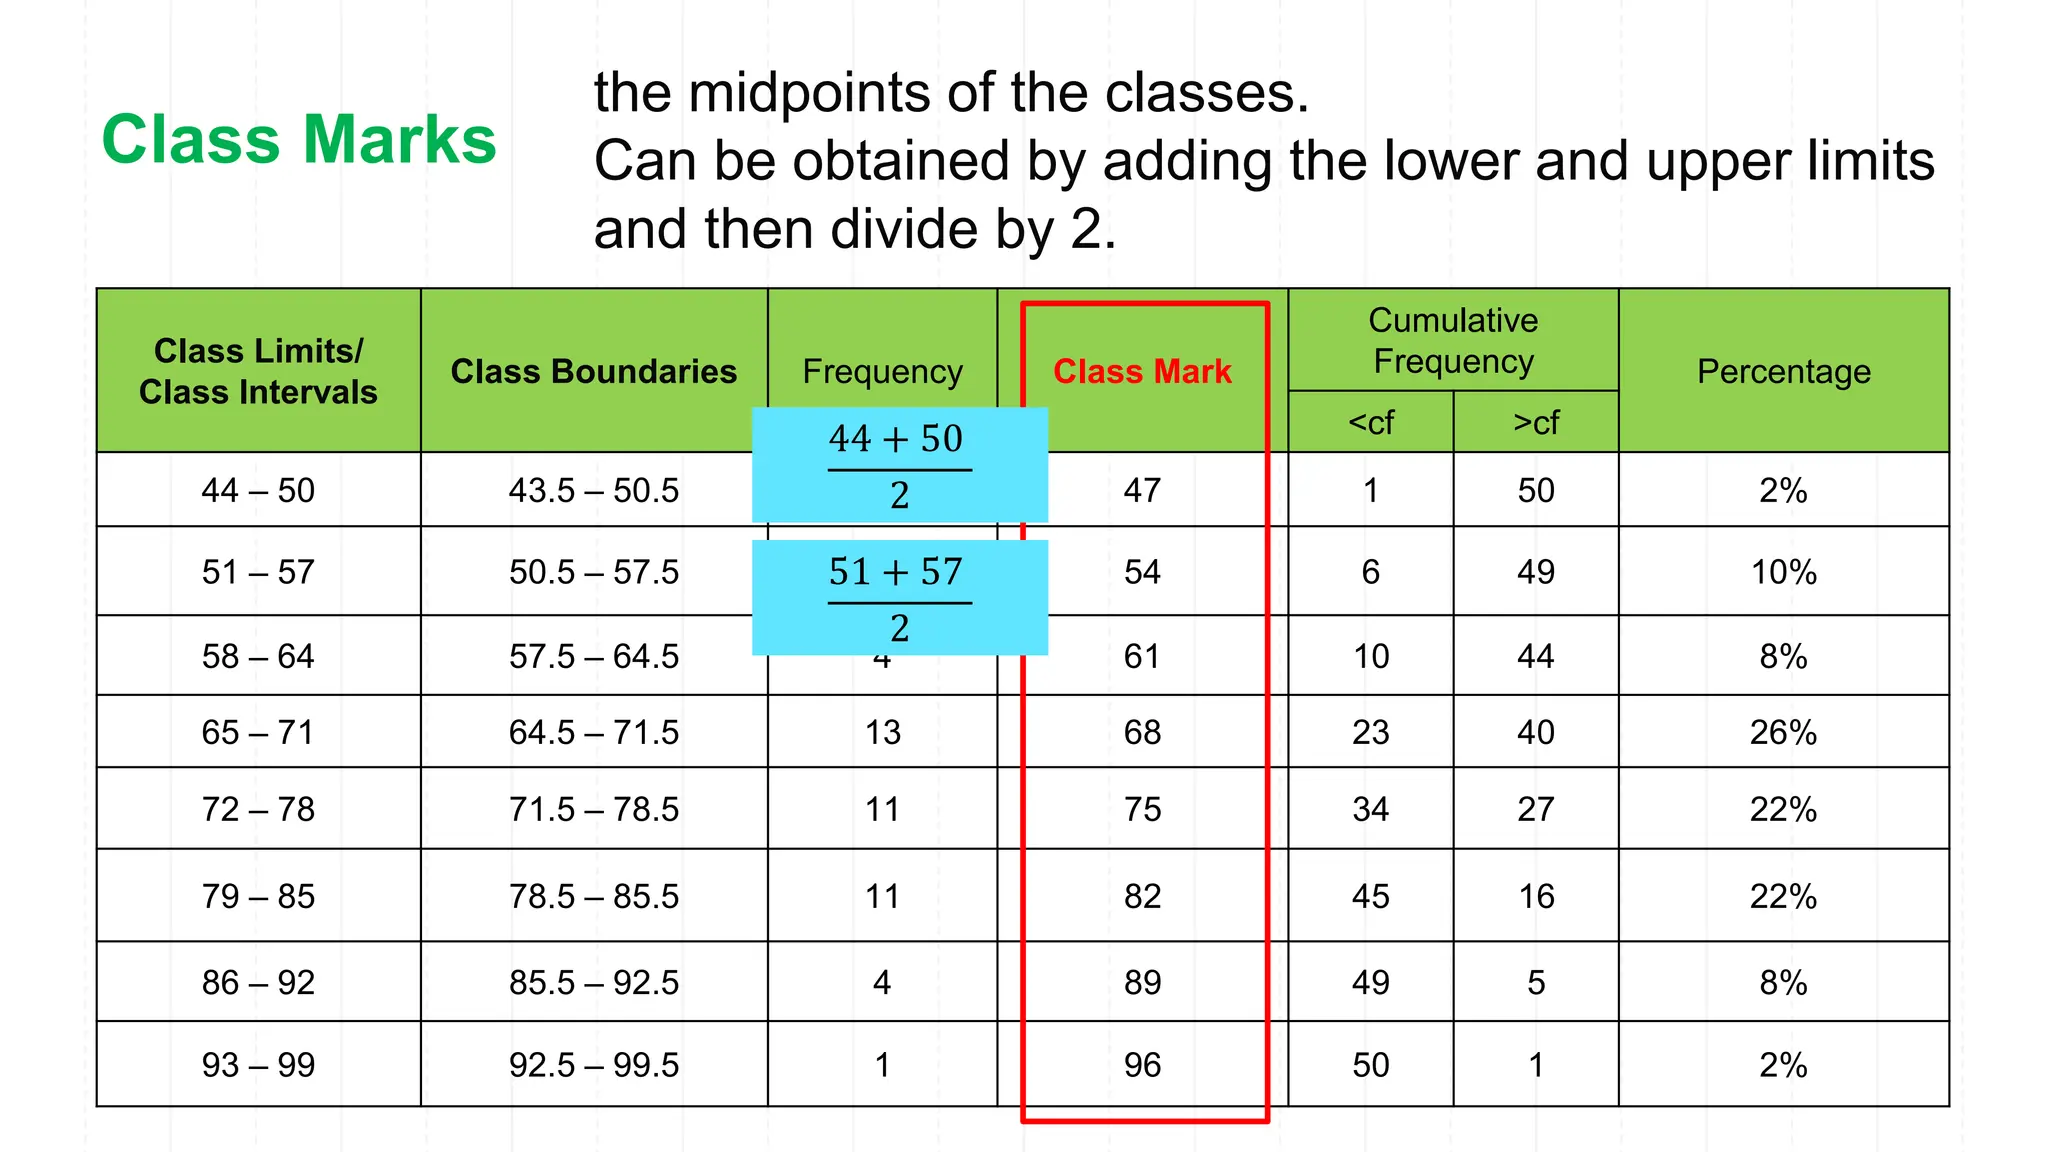
the midpoints of the classes.
Can be obtained by adding the lower and upper limits
and then divide by 2.
Class Marks
44 + 50
2
51 + 57
2
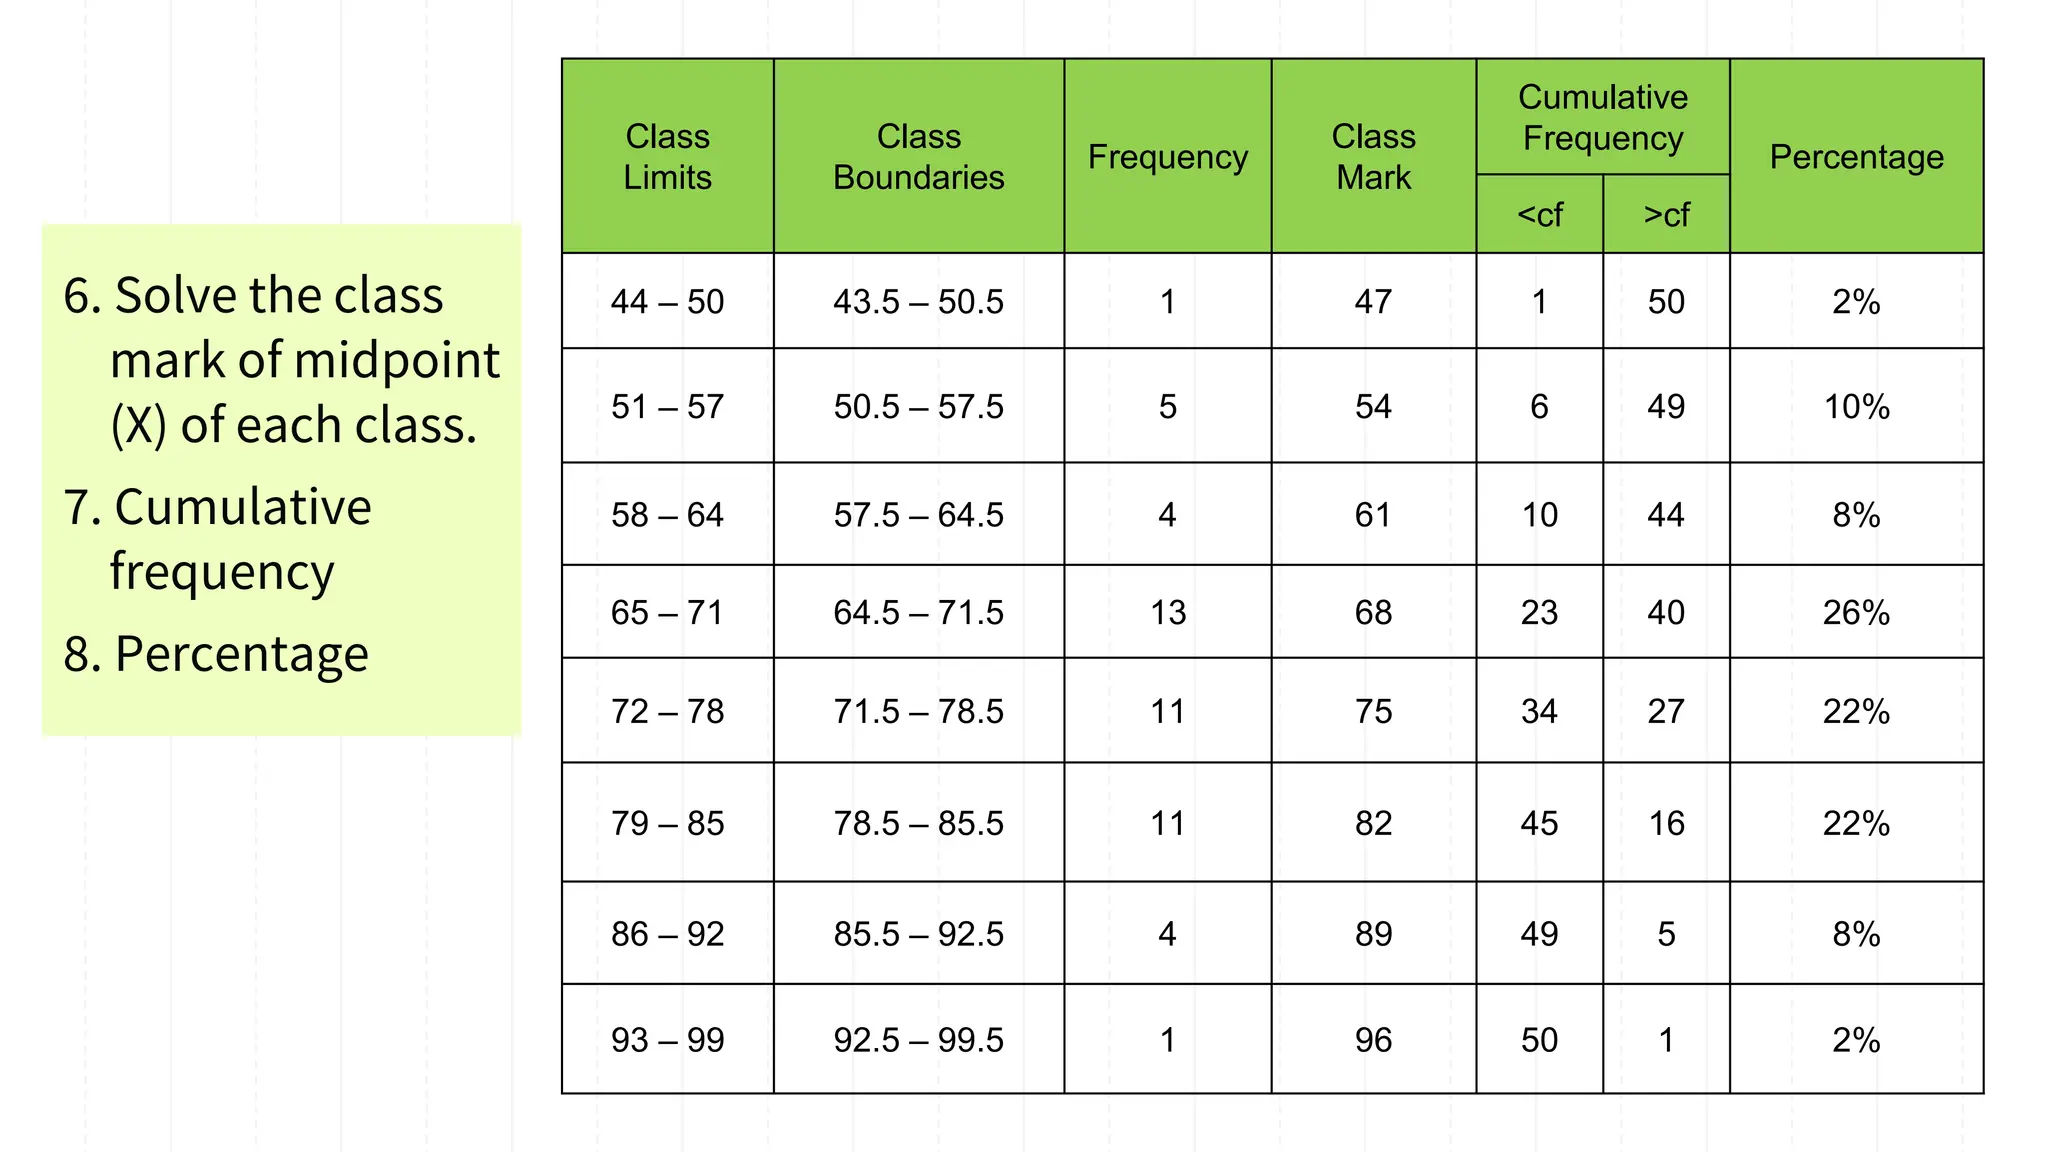
6.
Class Limits/
Class Intervals
ClassBoundaries Frequency Class Mark
Cumulative
Frequency Percentage
<cf >cf
44 – 50 43.5 – 50.5 1 47 1 50 2%
51 – 57 50.5 – 57.5 5 54 6 49 10%
58 – 64 57.5 – 64.5 4 61 10 44 8%
65 – 71 64.5 – 71.5 13 68 23 40 26%
72 – 78 71.5 – 78.5 11 75 34 27 22%
79 – 85 78.5 – 85.5 11 82 45 16 22%
86 – 92 85.5 – 92.5 4 89 49 5 8%
93 – 99 92.5 – 99.5 1 96 50 1 2%
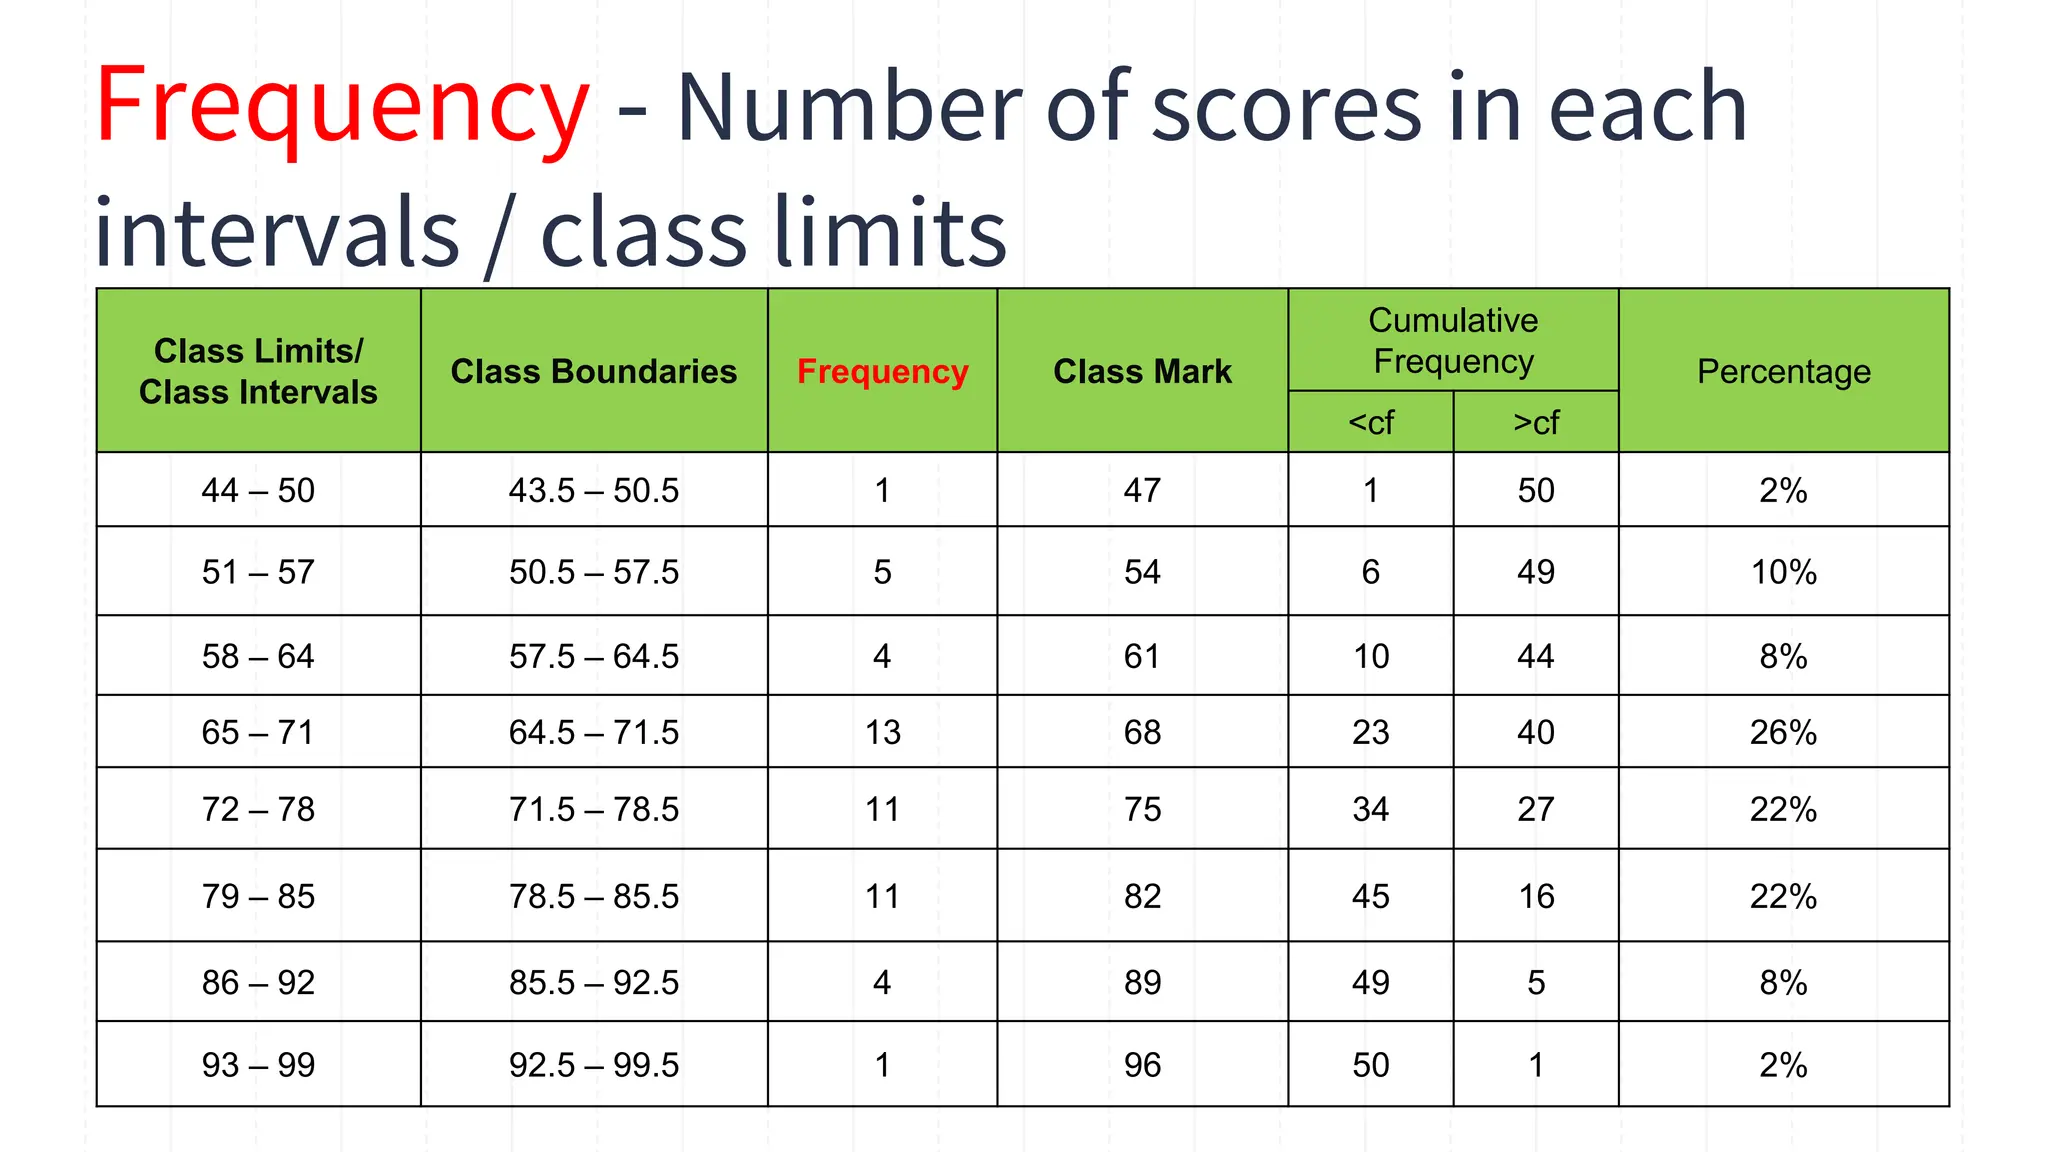
Frequency - Number of scores in each
intervals / class limits
8
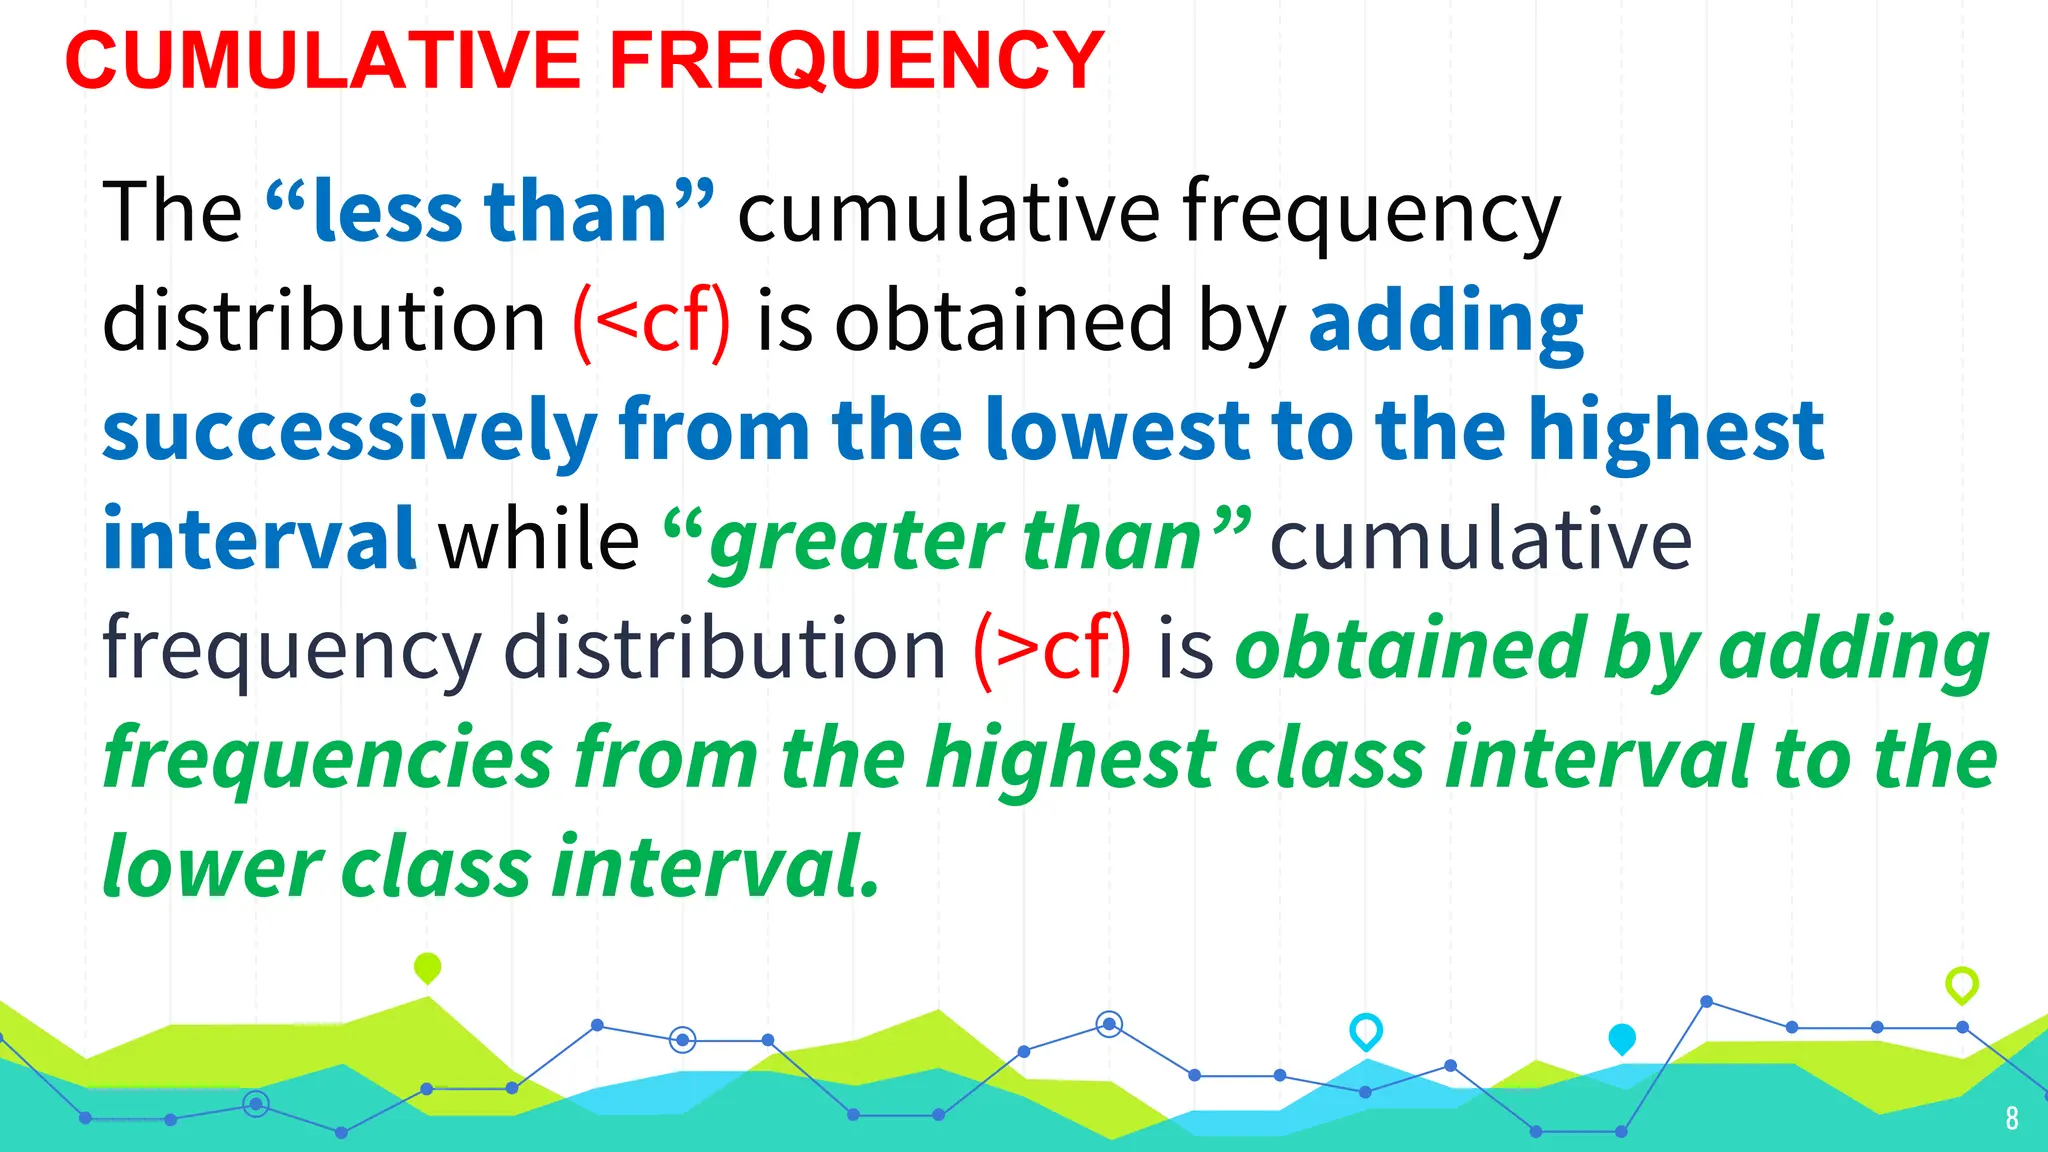
The “less than”cumulative frequency
distribution (<cf) is obtained by adding
successively from the lowest to the highest
interval while “greater than” cumulative
frequency distribution (>cf) is obtained by adding
frequencies from the highest class interval to the
lower class interval.
CUMULATIVE FREQUENCY
9.
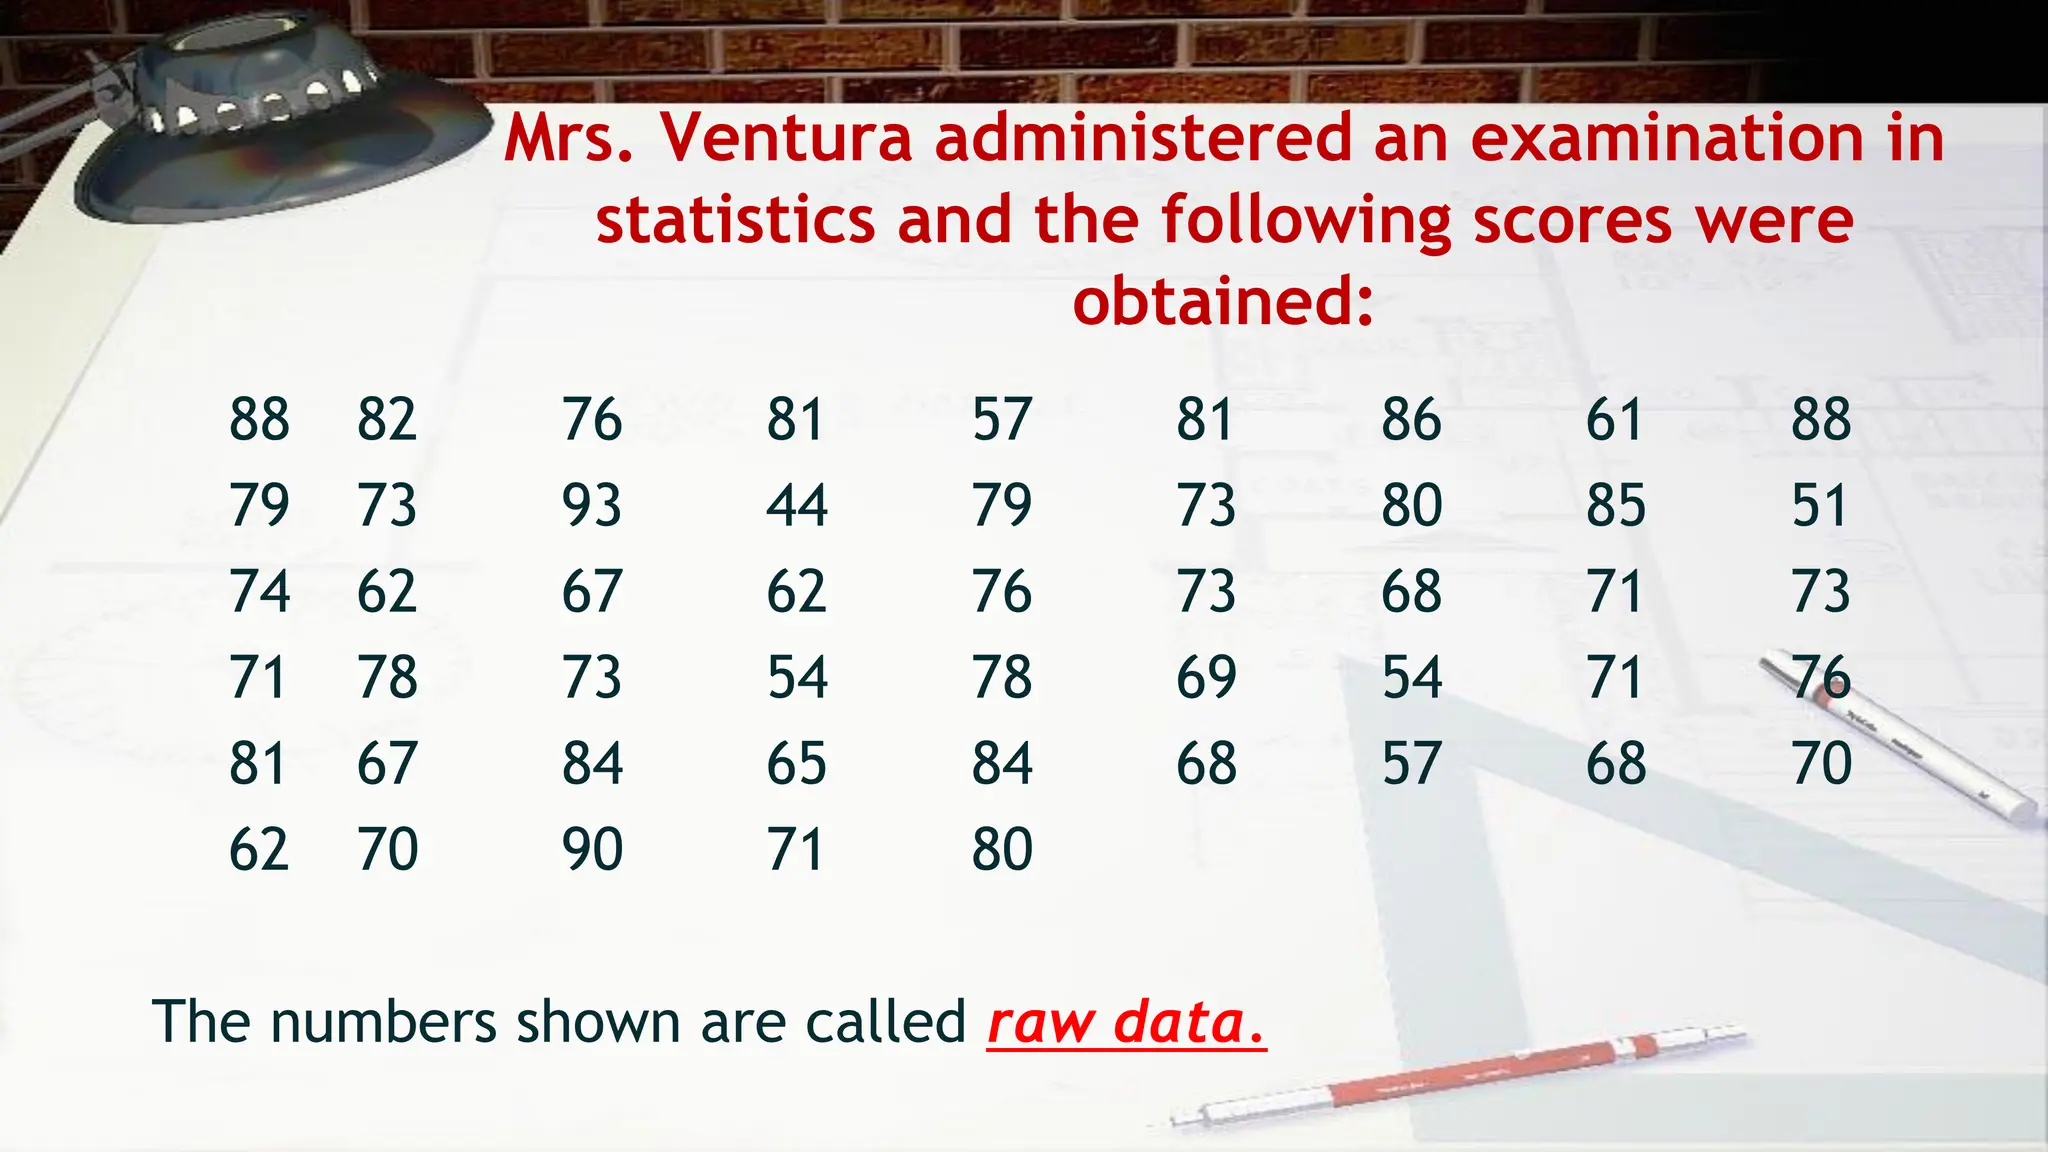
Mrs. Ventura administeredan examination in
statistics and the following scores were
obtained:
88 82 76 81 57 81 86 61 88
79 73 93 44 79 73 80 85 51
74 62 67 62 76 73 68 71 73
71 78 73 54 78 69 54 71 76
81 67 84 65 84 68 57 68 70
62 70 90 71 80
The numbers shown are called raw data.
10.
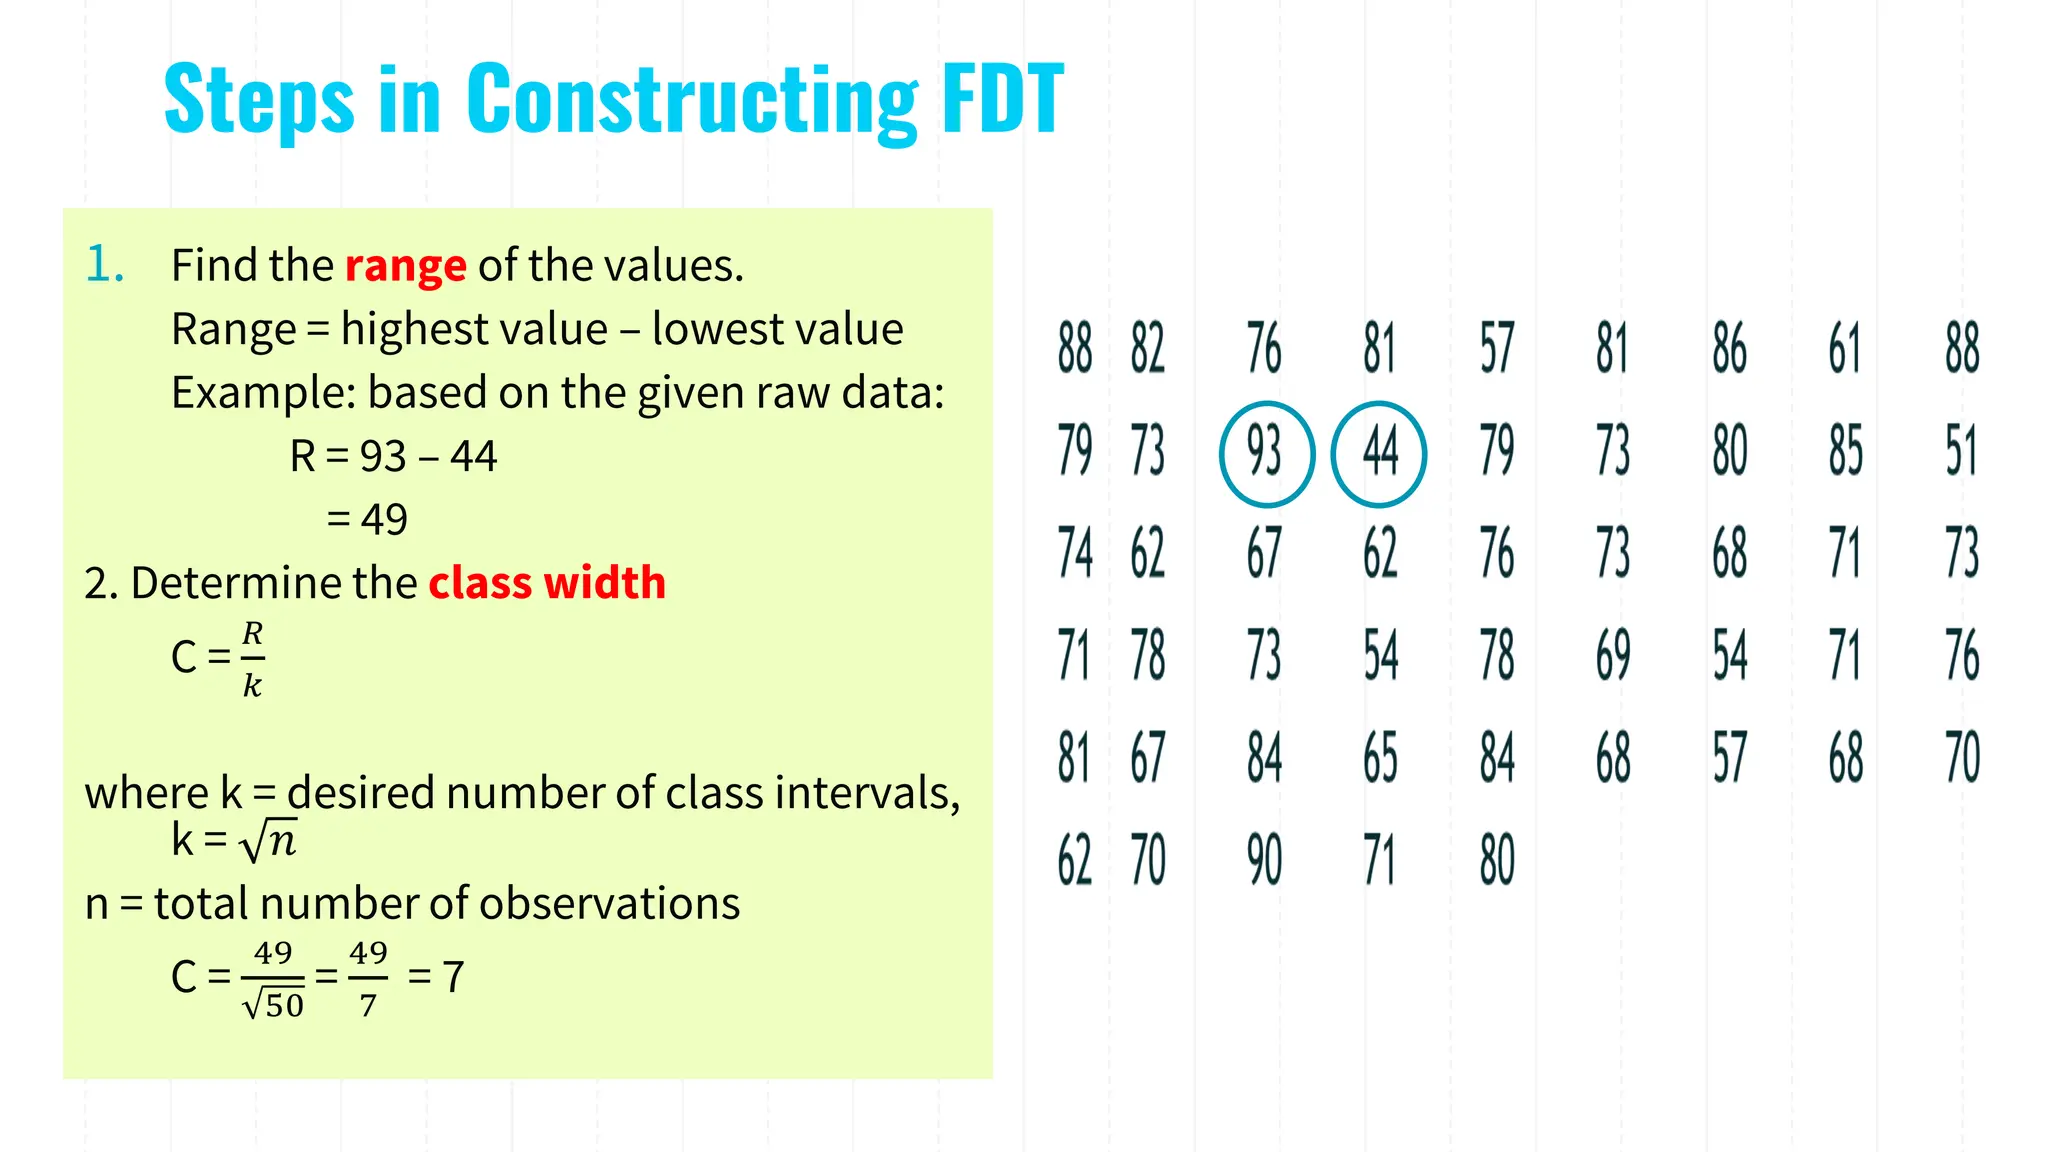
Steps in ConstructingFDT
1. Find the range of the values.
Range = highest value – lowest value
Example: based on the given raw data:
R = 93 – 44
= 49
2. Determine the class width
C =
𝑅
𝑘
where k = desired number of class intervals,
k = 𝑛
n = total number of observations
C =
49
50
=
49
7
= 7
11.
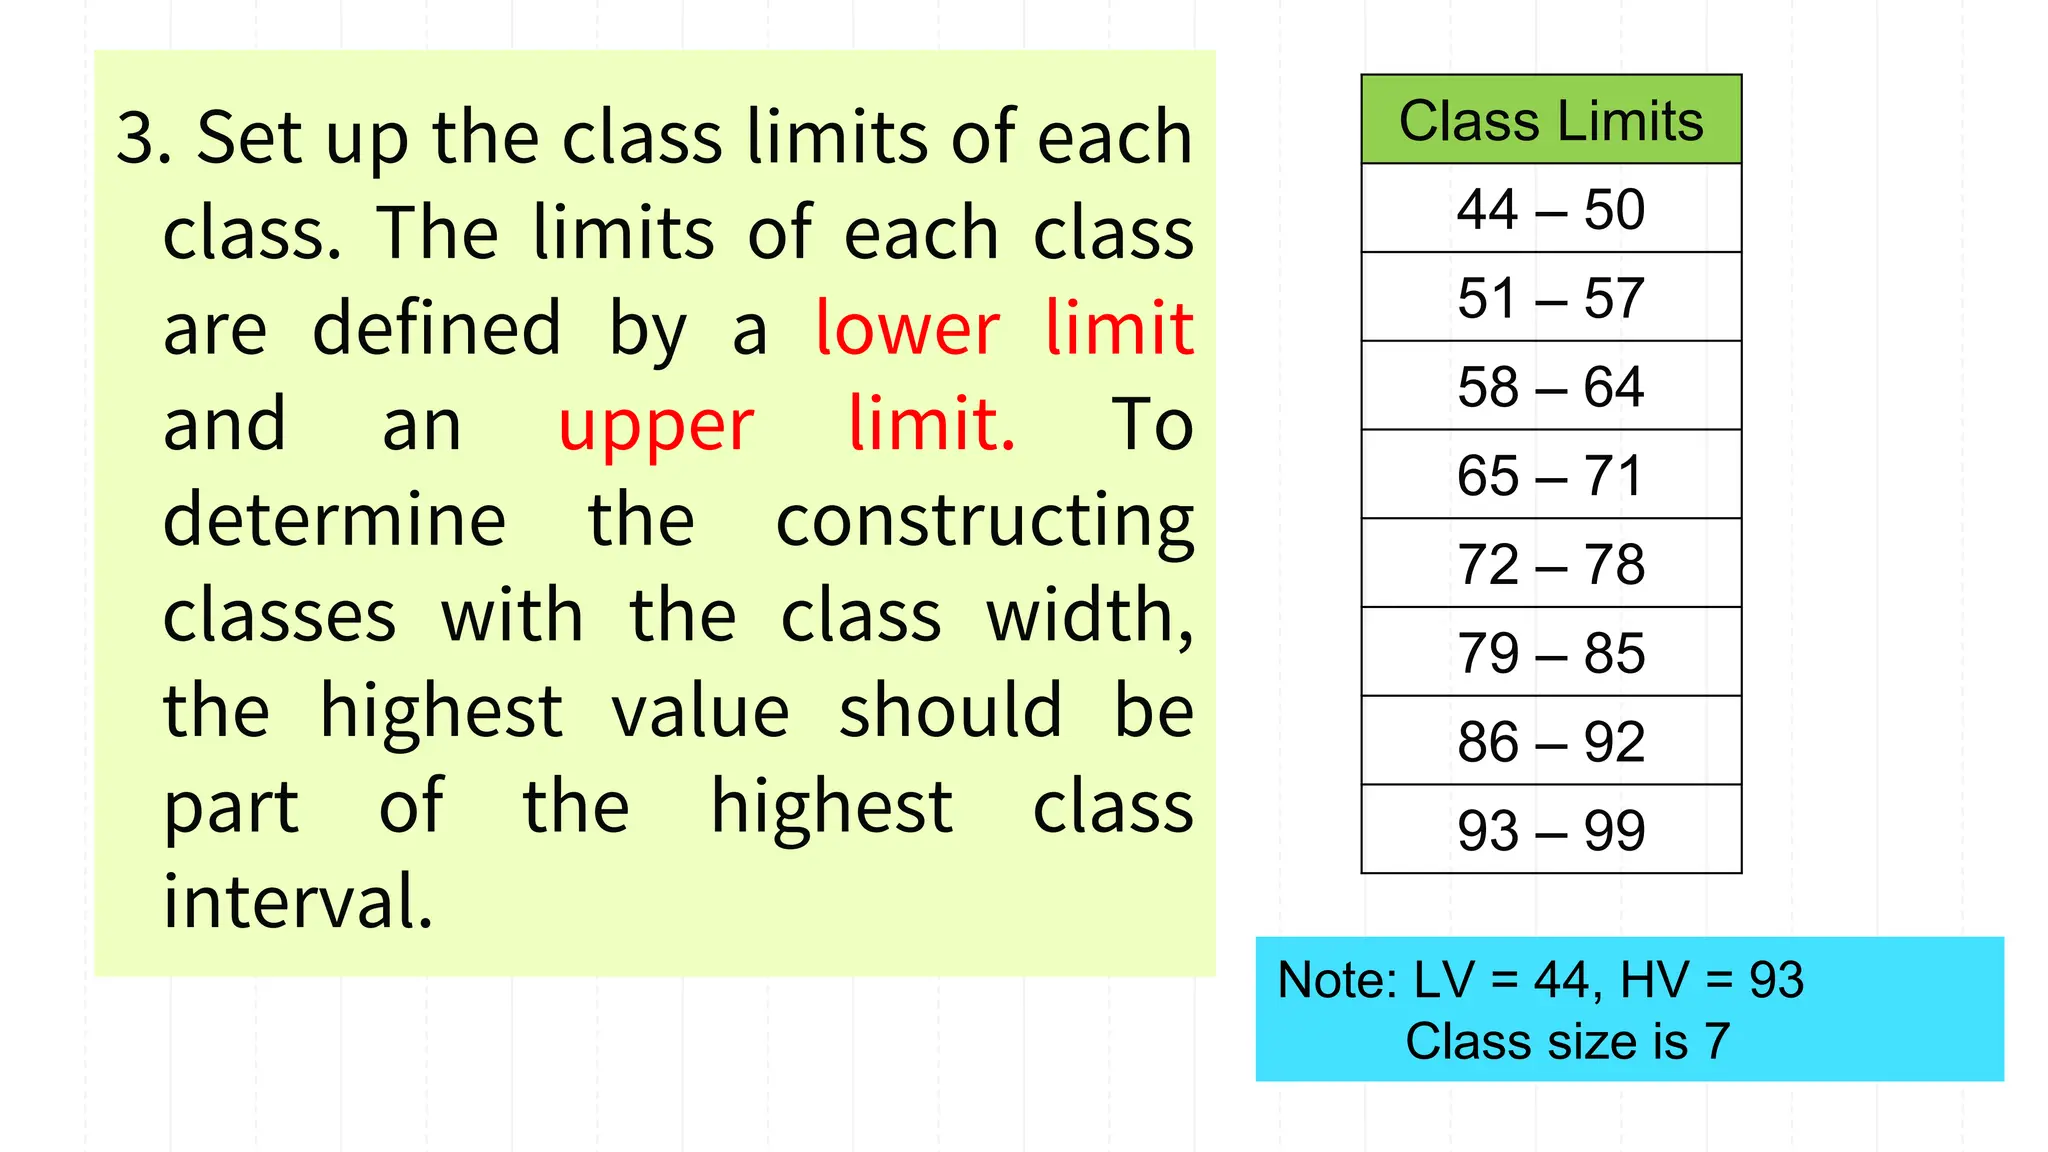
3. Set upthe class limits of each
class. The limits of each class
are defined by a lower limit
and an upper limit. To
determine the constructing
classes with the class width,
the highest value should be
part of the highest class
interval.
Class Limits
44 – 50
51 – 57
58 – 64
65 – 71
72 – 78
79 – 85
86 – 92
93 – 99
Note: LV = 44, HV = 93
Class size is 7
12.
Class Limits
Class
Boundaries
44 –50 43.5 – 50.5
51 – 57 50.5 – 57.5
58 – 64 57.5 – 64.5
65 – 71 64.5 – 71.5
72 – 78 71.5 – 78.5
79 – 85 78.5 – 85.5
86 – 92 85.5 – 92.5
93 – 99 92.5 – 99.5
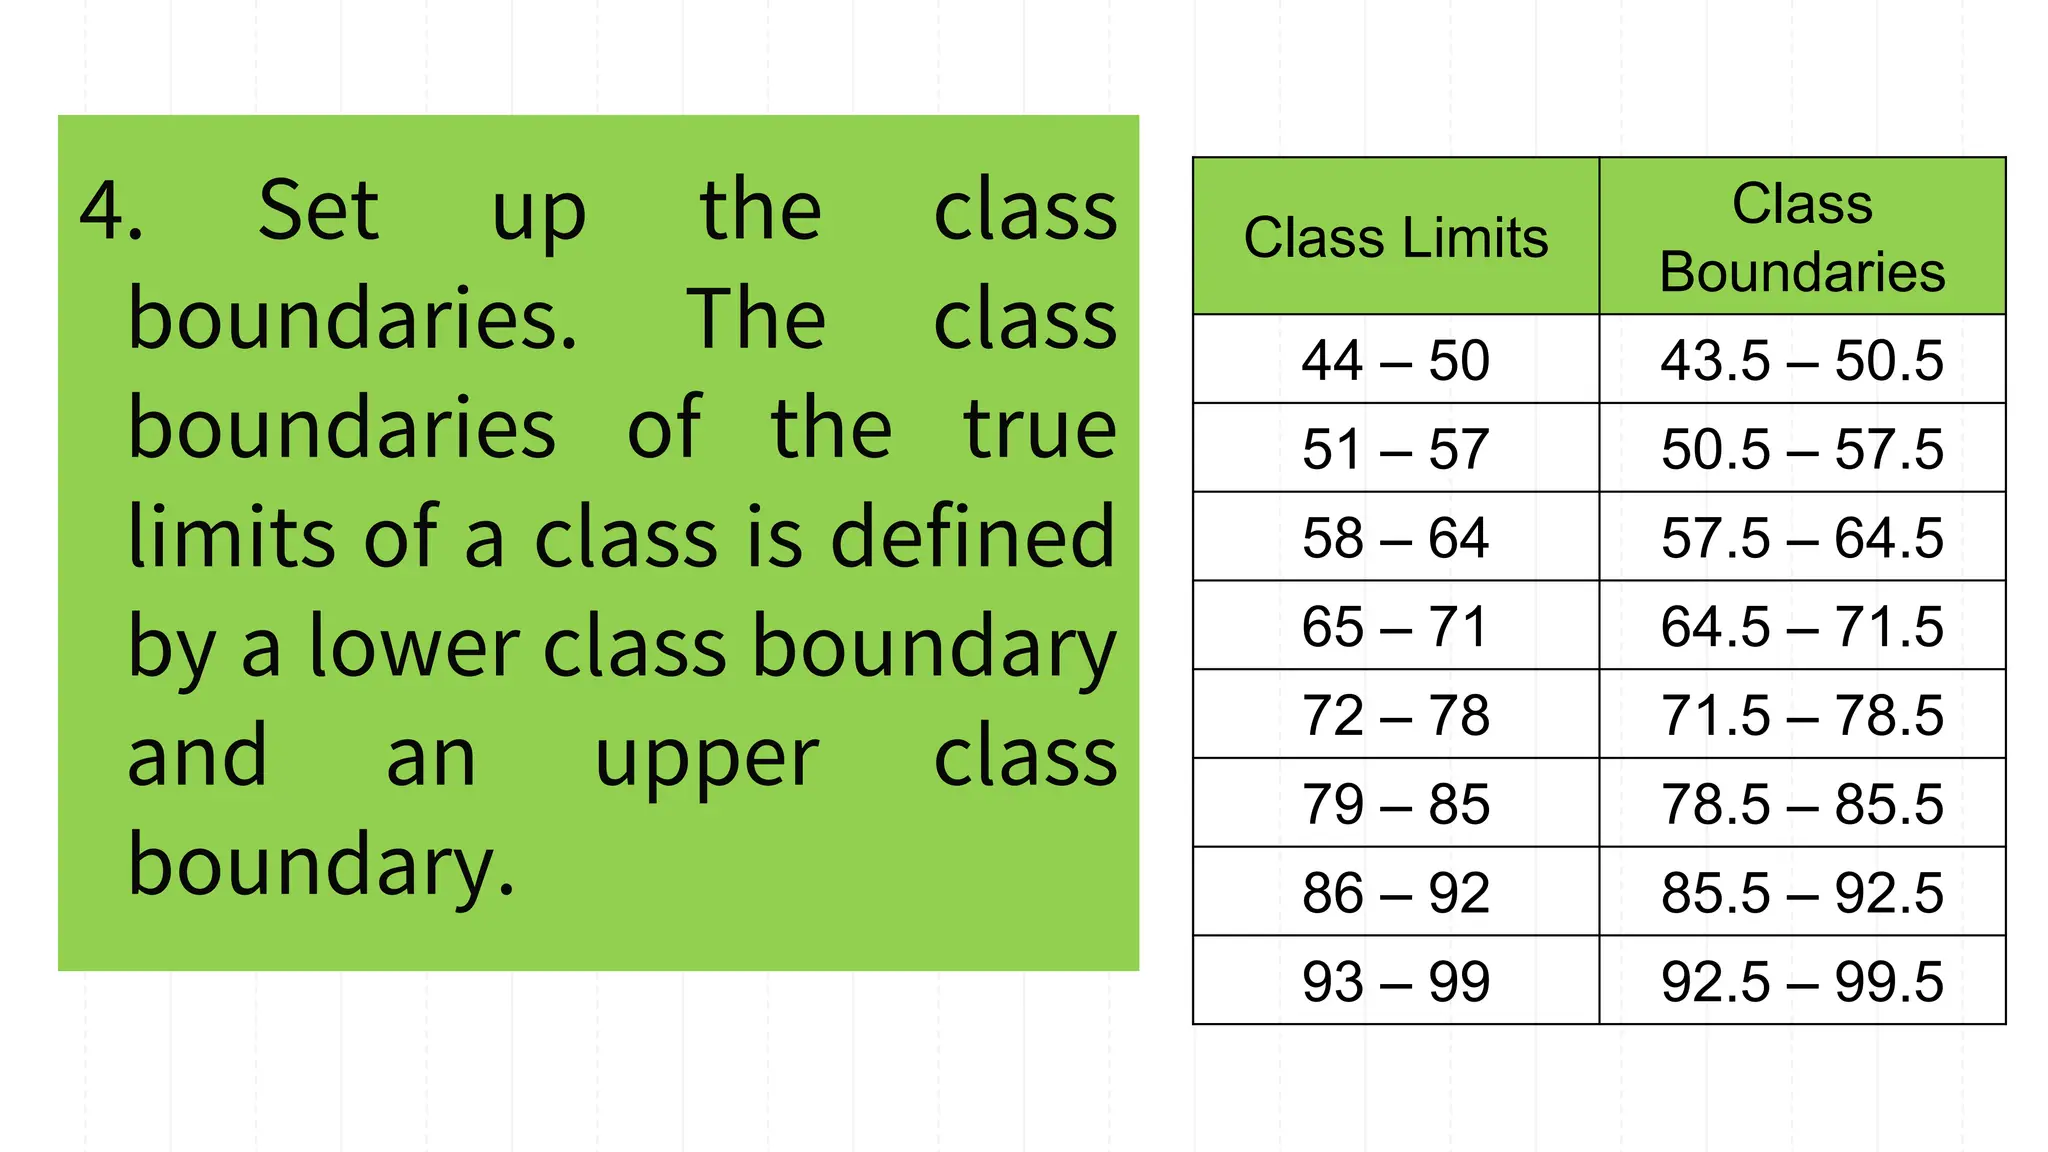
4. Set up the class
boundaries. The class
boundaries of the true
limits of a class is defined
by a lower class boundary
and an upper class
boundary.
13.
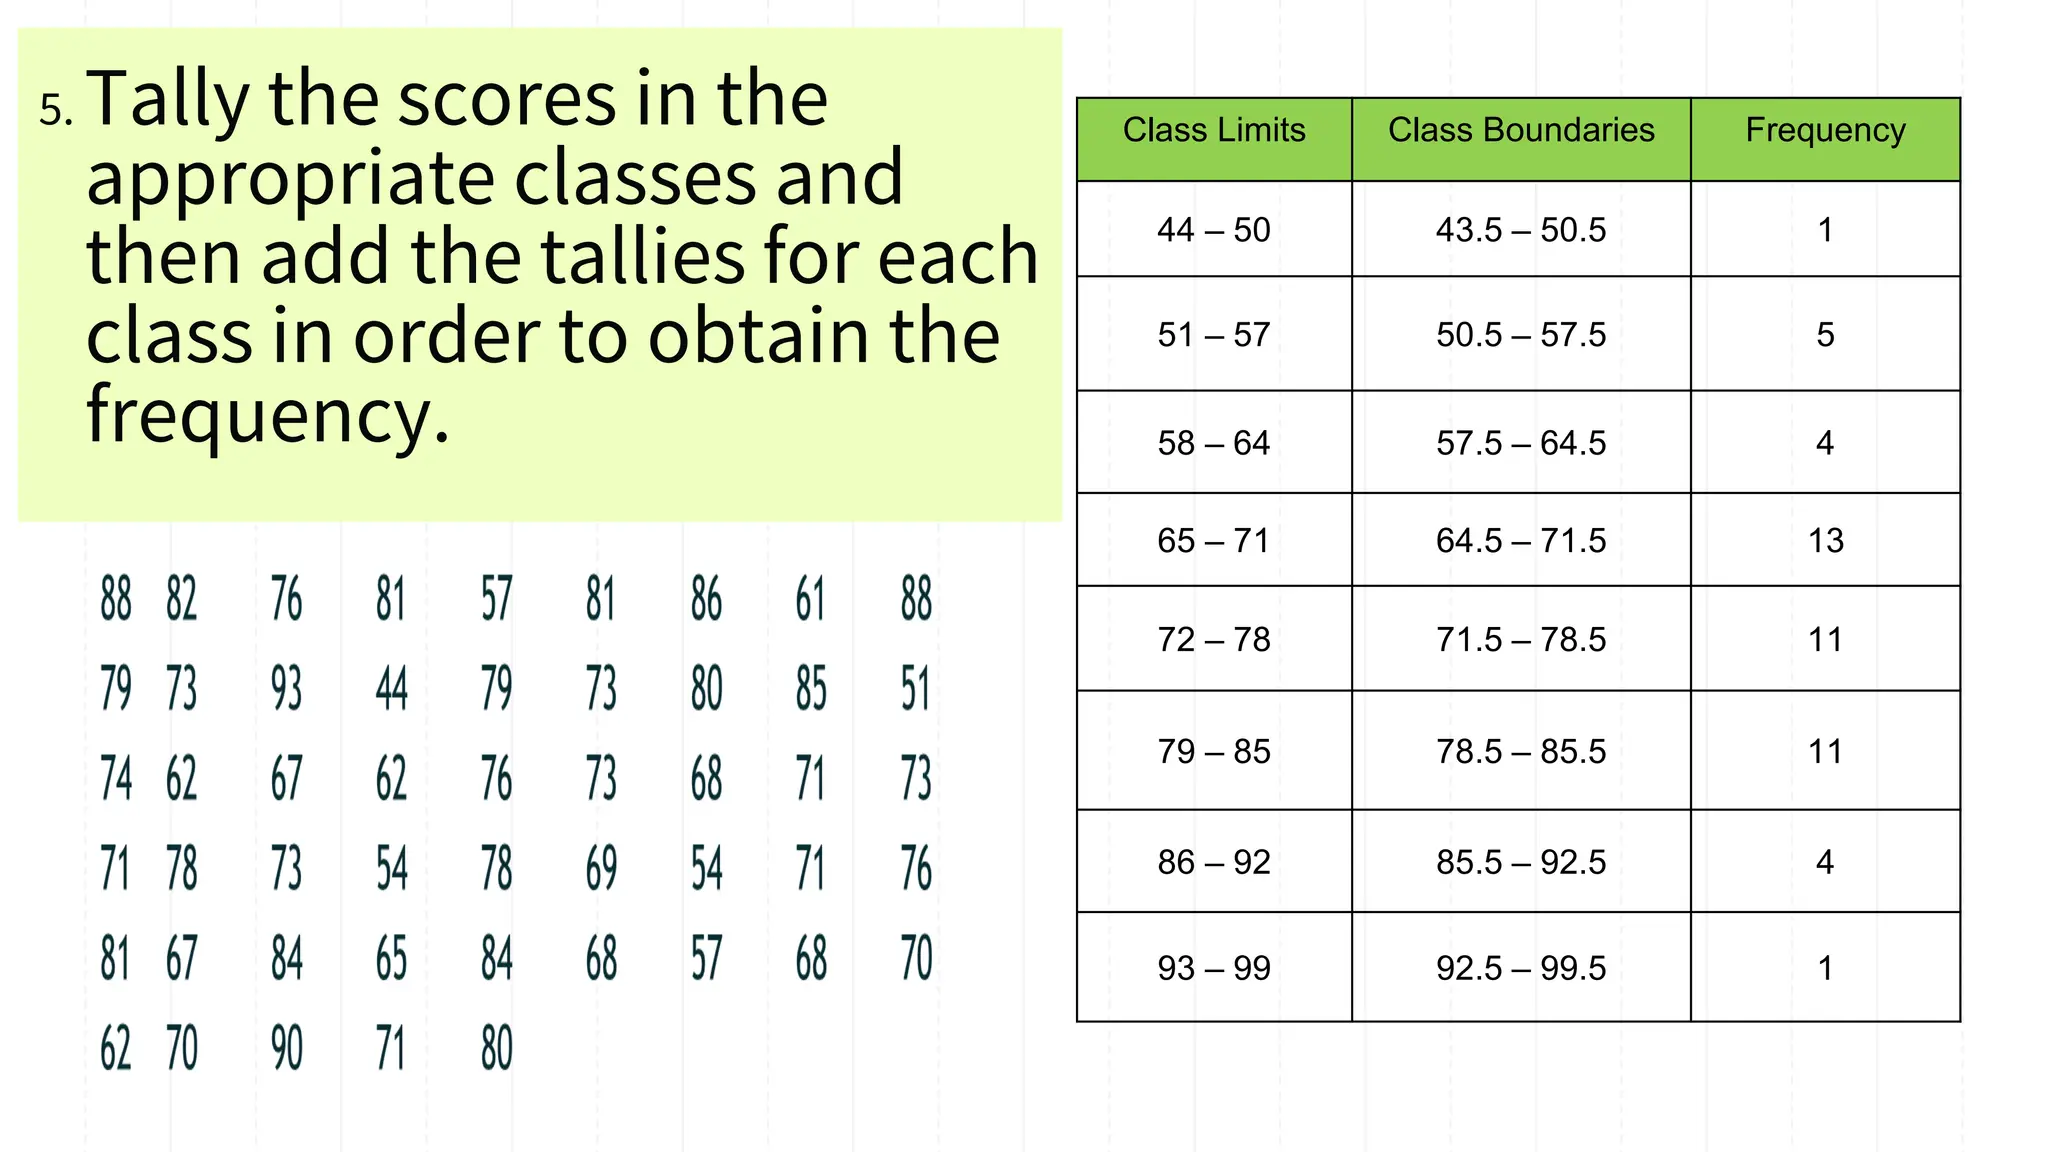
5. Tally thescores in the
appropriate classes and
then add the tallies for each
class in order to obtain the
frequency.
Class Limits Class Boundaries Frequency
44 – 50 43.5 – 50.5 1
51 – 57 50.5 – 57.5 5
58 – 64 57.5 – 64.5 4
65 – 71 64.5 – 71.5 13
72 – 78 71.5 – 78.5 11
79 – 85 78.5 – 85.5 11
86 – 92 85.5 – 92.5 4
93 – 99 92.5 – 99.5 1
Answer the following
Referringto the table, determine the following:
1. Lower limit of the lowest class.
2. Upper limit of highest class.
3. Class boundaries of the second class.
4. Frequency of the third class.
5. Class width.
6. Percentage of the students in the highest class.
7. Number of students receiving scores below 65.
15
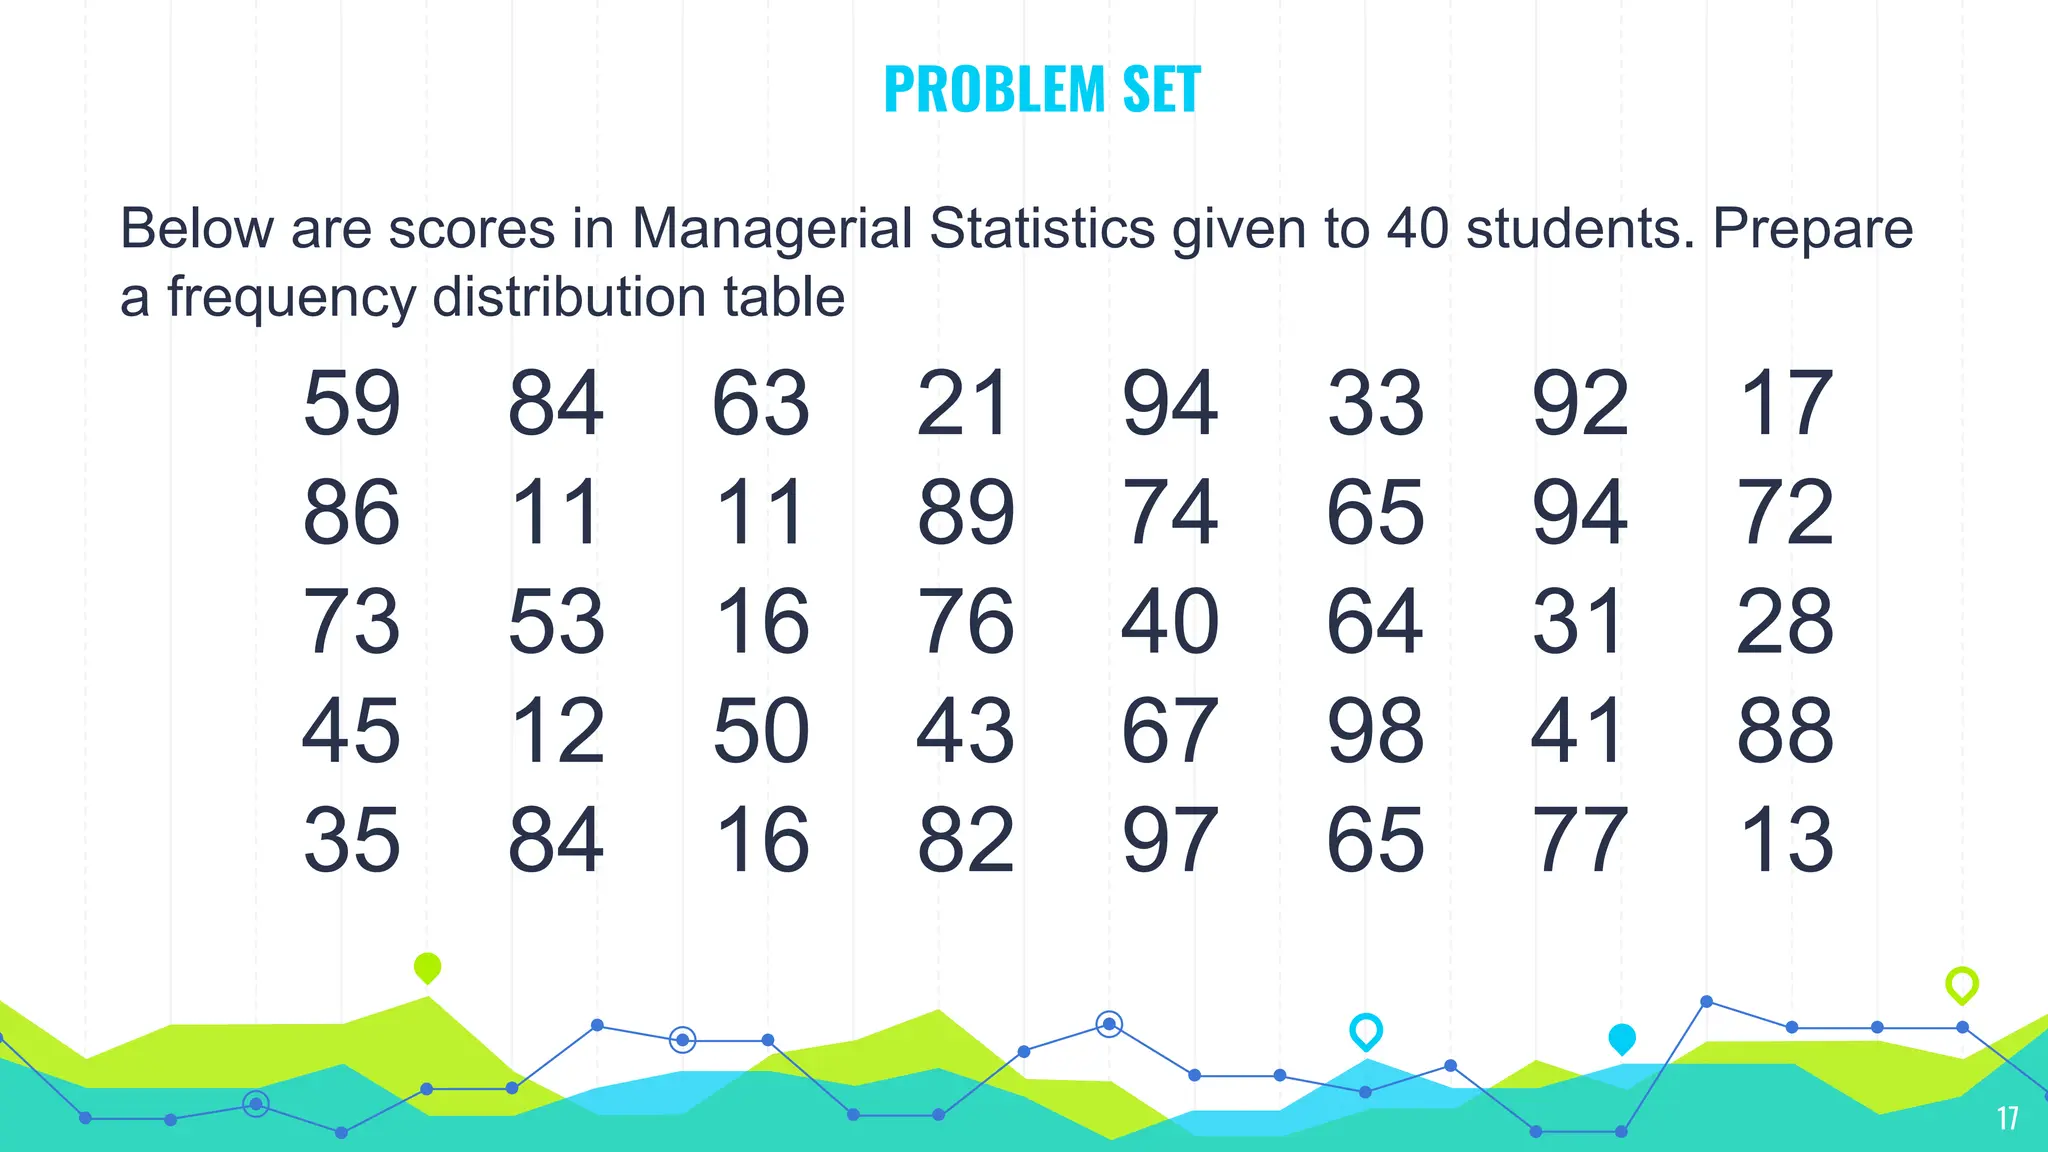
PROBLEM SET
Below arescores in Managerial Statistics given to 40 students. Prepare
a frequency distribution table
59 84 63 21 94 33 92 17
86 11 11 89 74 65 94 72
73 53 16 76 40 64 31 28
45 12 50 43 67 98 41 88
35 84 16 82 97 65 77 13
17
18.
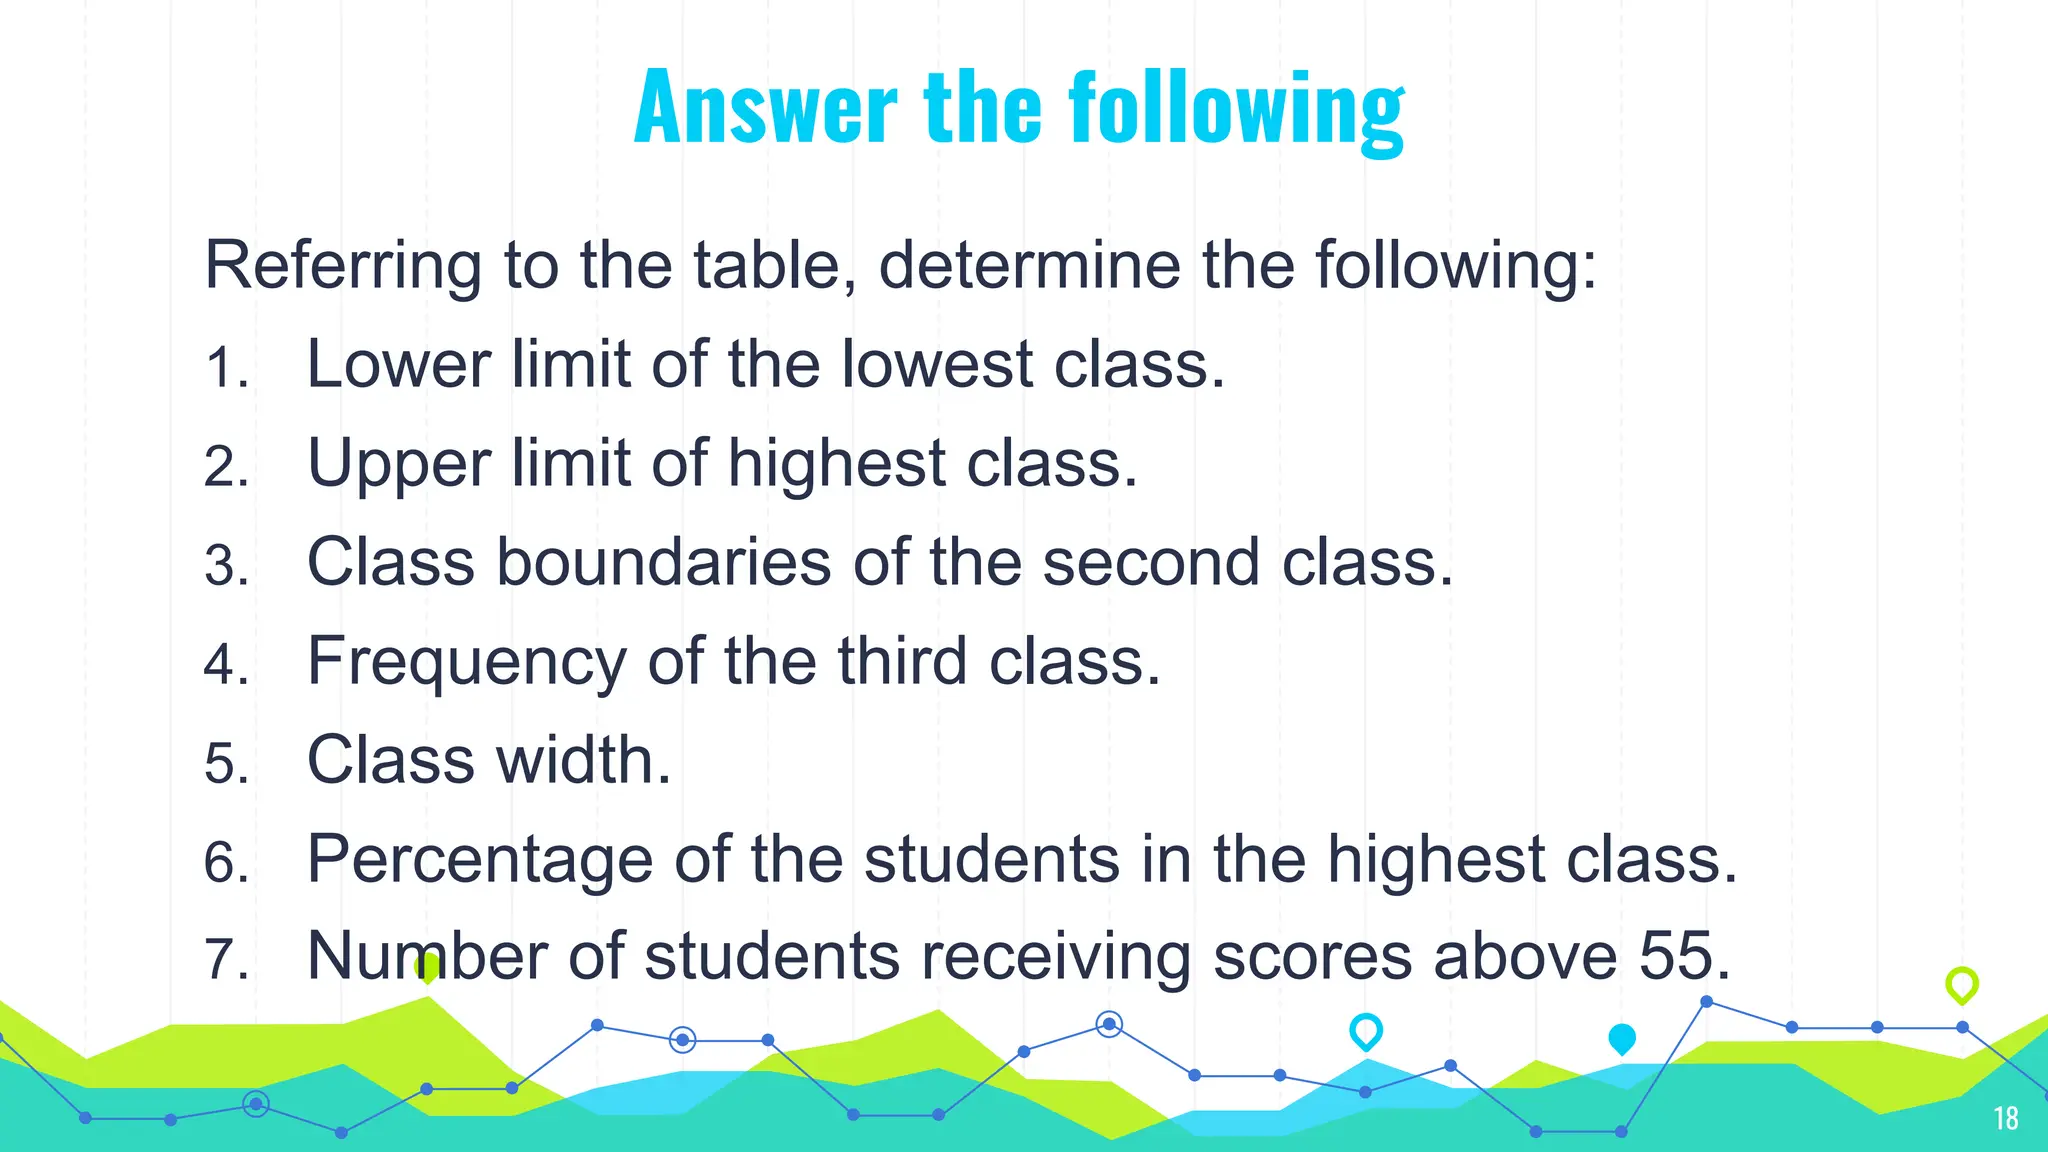
Answer the following
Referringto the table, determine the following:
1. Lower limit of the lowest class.
2. Upper limit of highest class.
3. Class boundaries of the second class.
4. Frequency of the third class.
5. Class width.
6. Percentage of the students in the highest class.
7. Number of students receiving scores above 55.
18
19.
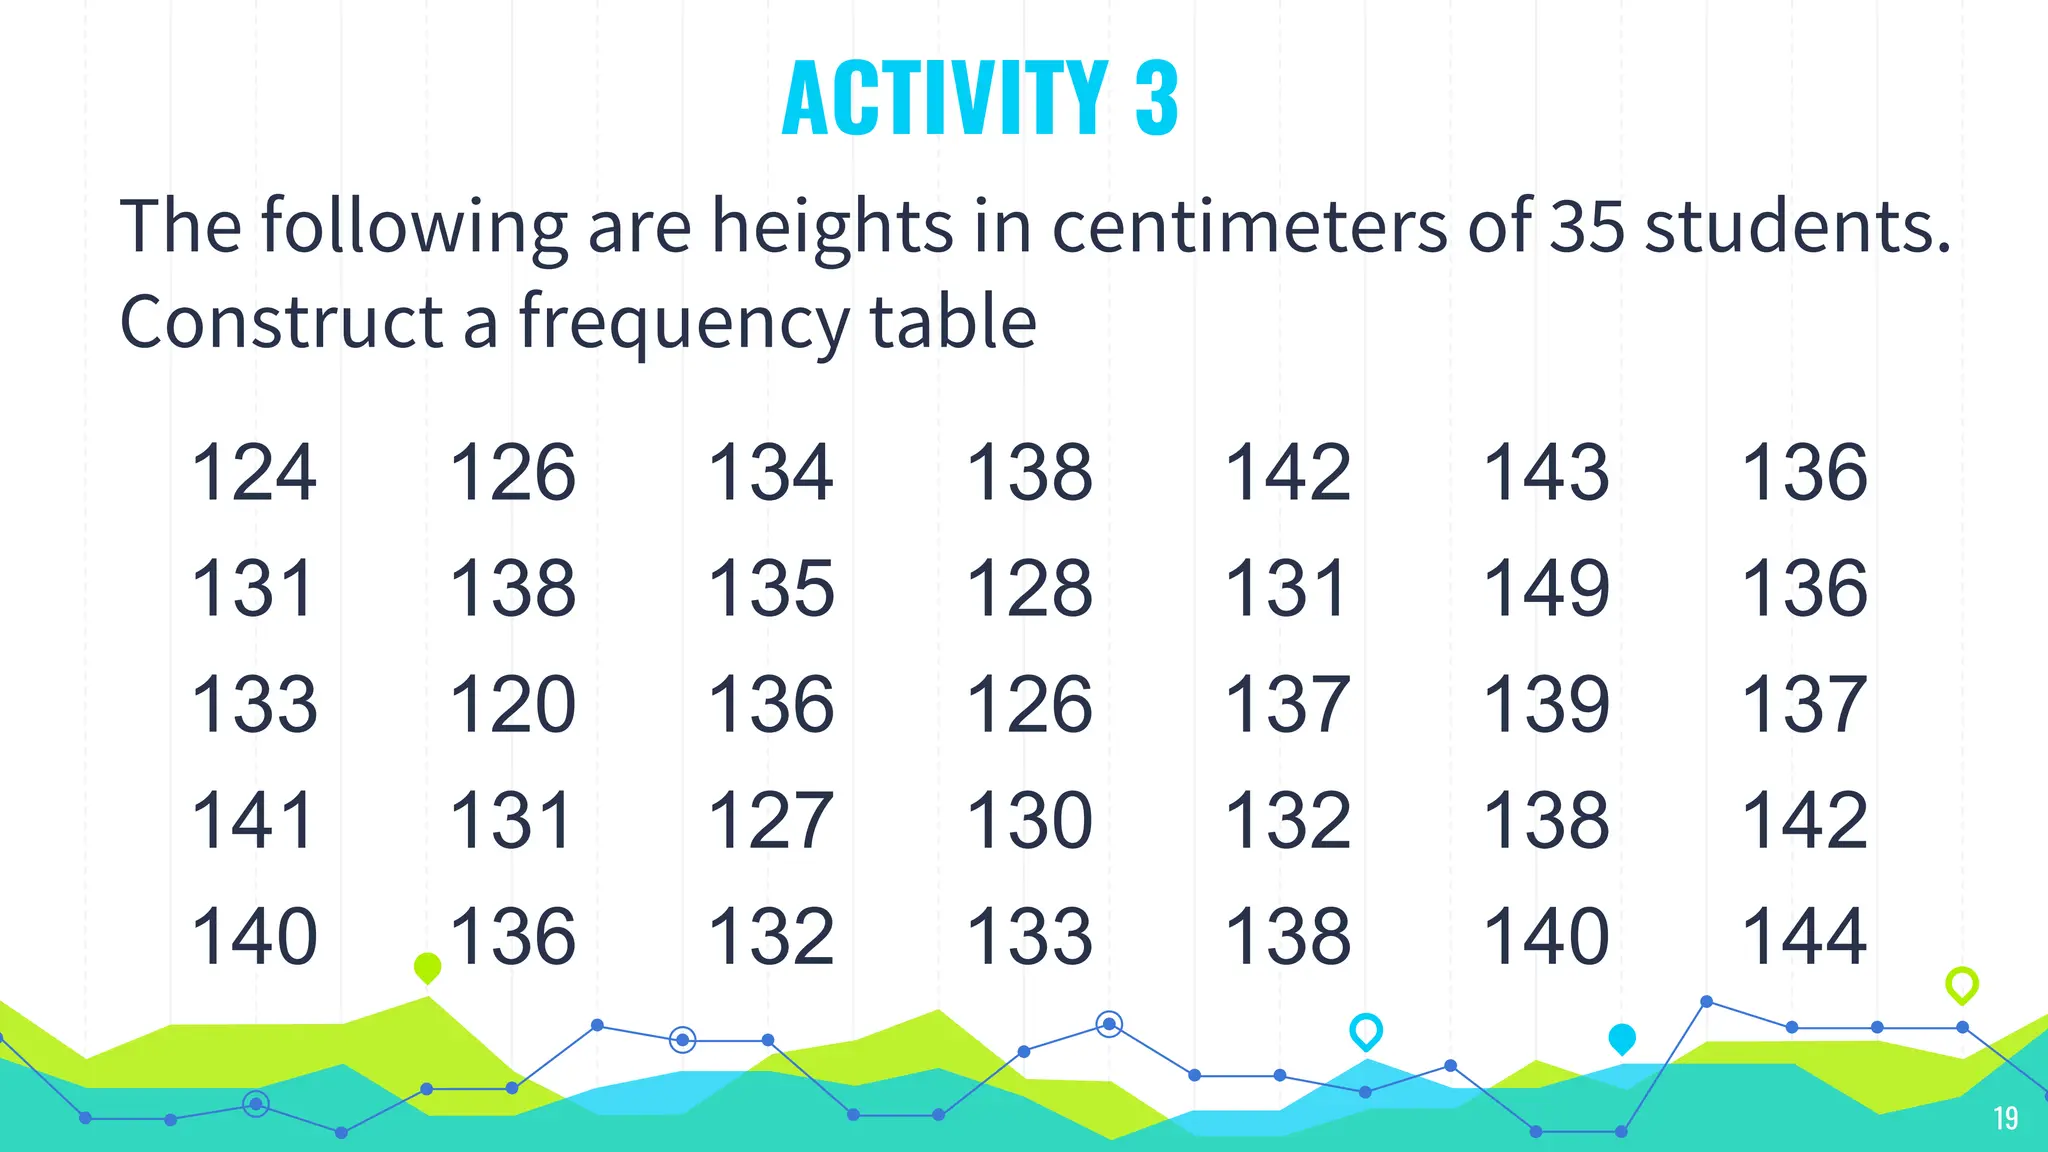
ACTIVITY 3
The followingare heights in centimeters of 35 students.
Construct a frequency table
19
124 126 134 138 142 143 136
131 138 135 128 131 149 136
133 120 136 126 137 139 137
141 131 127 130 132 138 142
140 136 132 133 138 140 144
20.
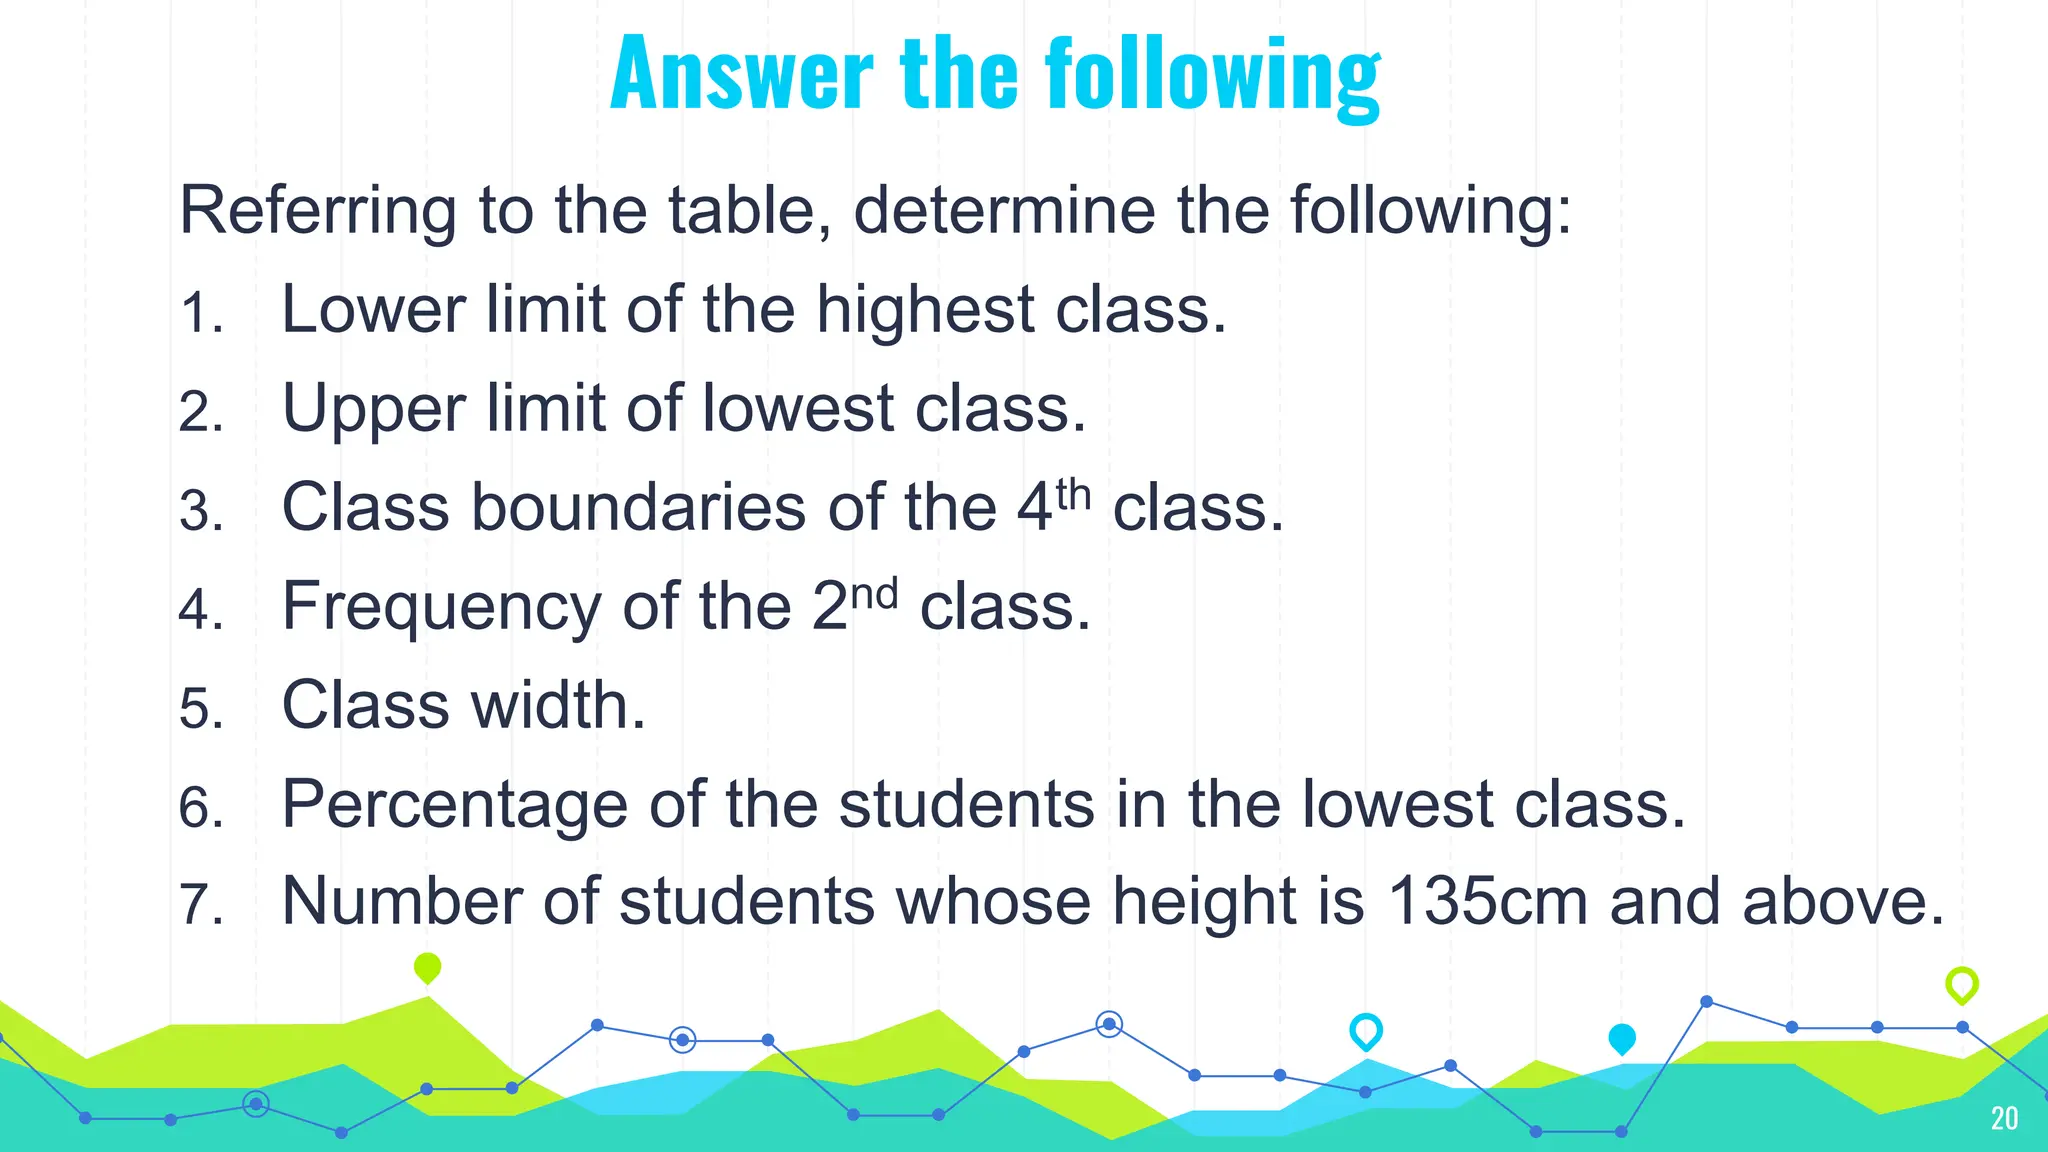
Answer the following
Referringto the table, determine the following:
1. Lower limit of the highest class.
2. Upper limit of lowest class.
3. Class boundaries of the 4th class.
4. Frequency of the 2nd class.
5. Class width.
6. Percentage of the students in the lowest class.
7. Number of students whose height is 135cm and above.
20
References
22
• Rivera, R.(2020). Principles of Managerial
Statistics and Data Science. John Wiley & Sons, Inc.
• Bhattacherjee, A. (2012). Social Science Research:
Principles, Methods and Practices
• Kothari, C. R. (2004). Research Methodology:
Methods and Techniques. New Age International