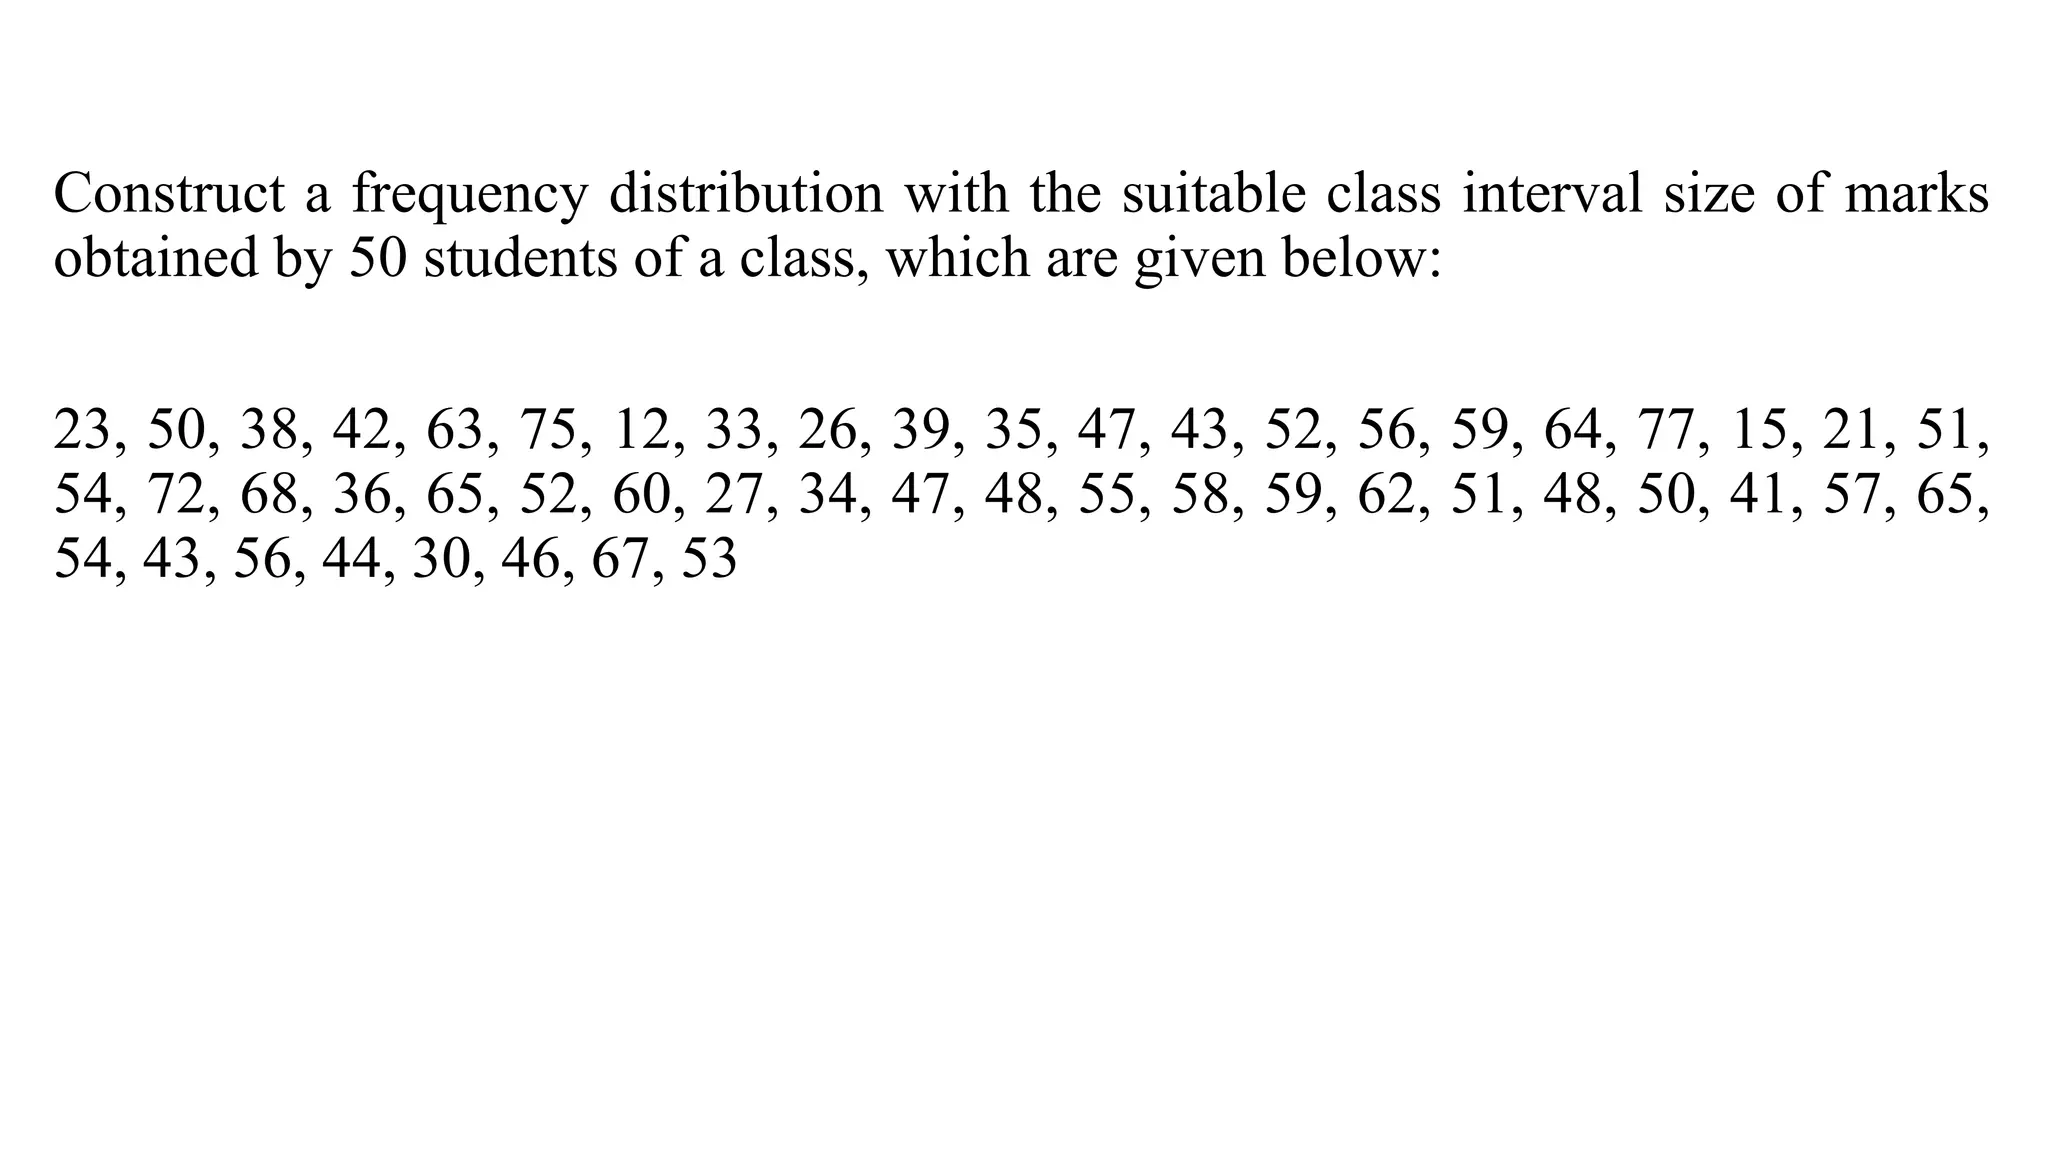
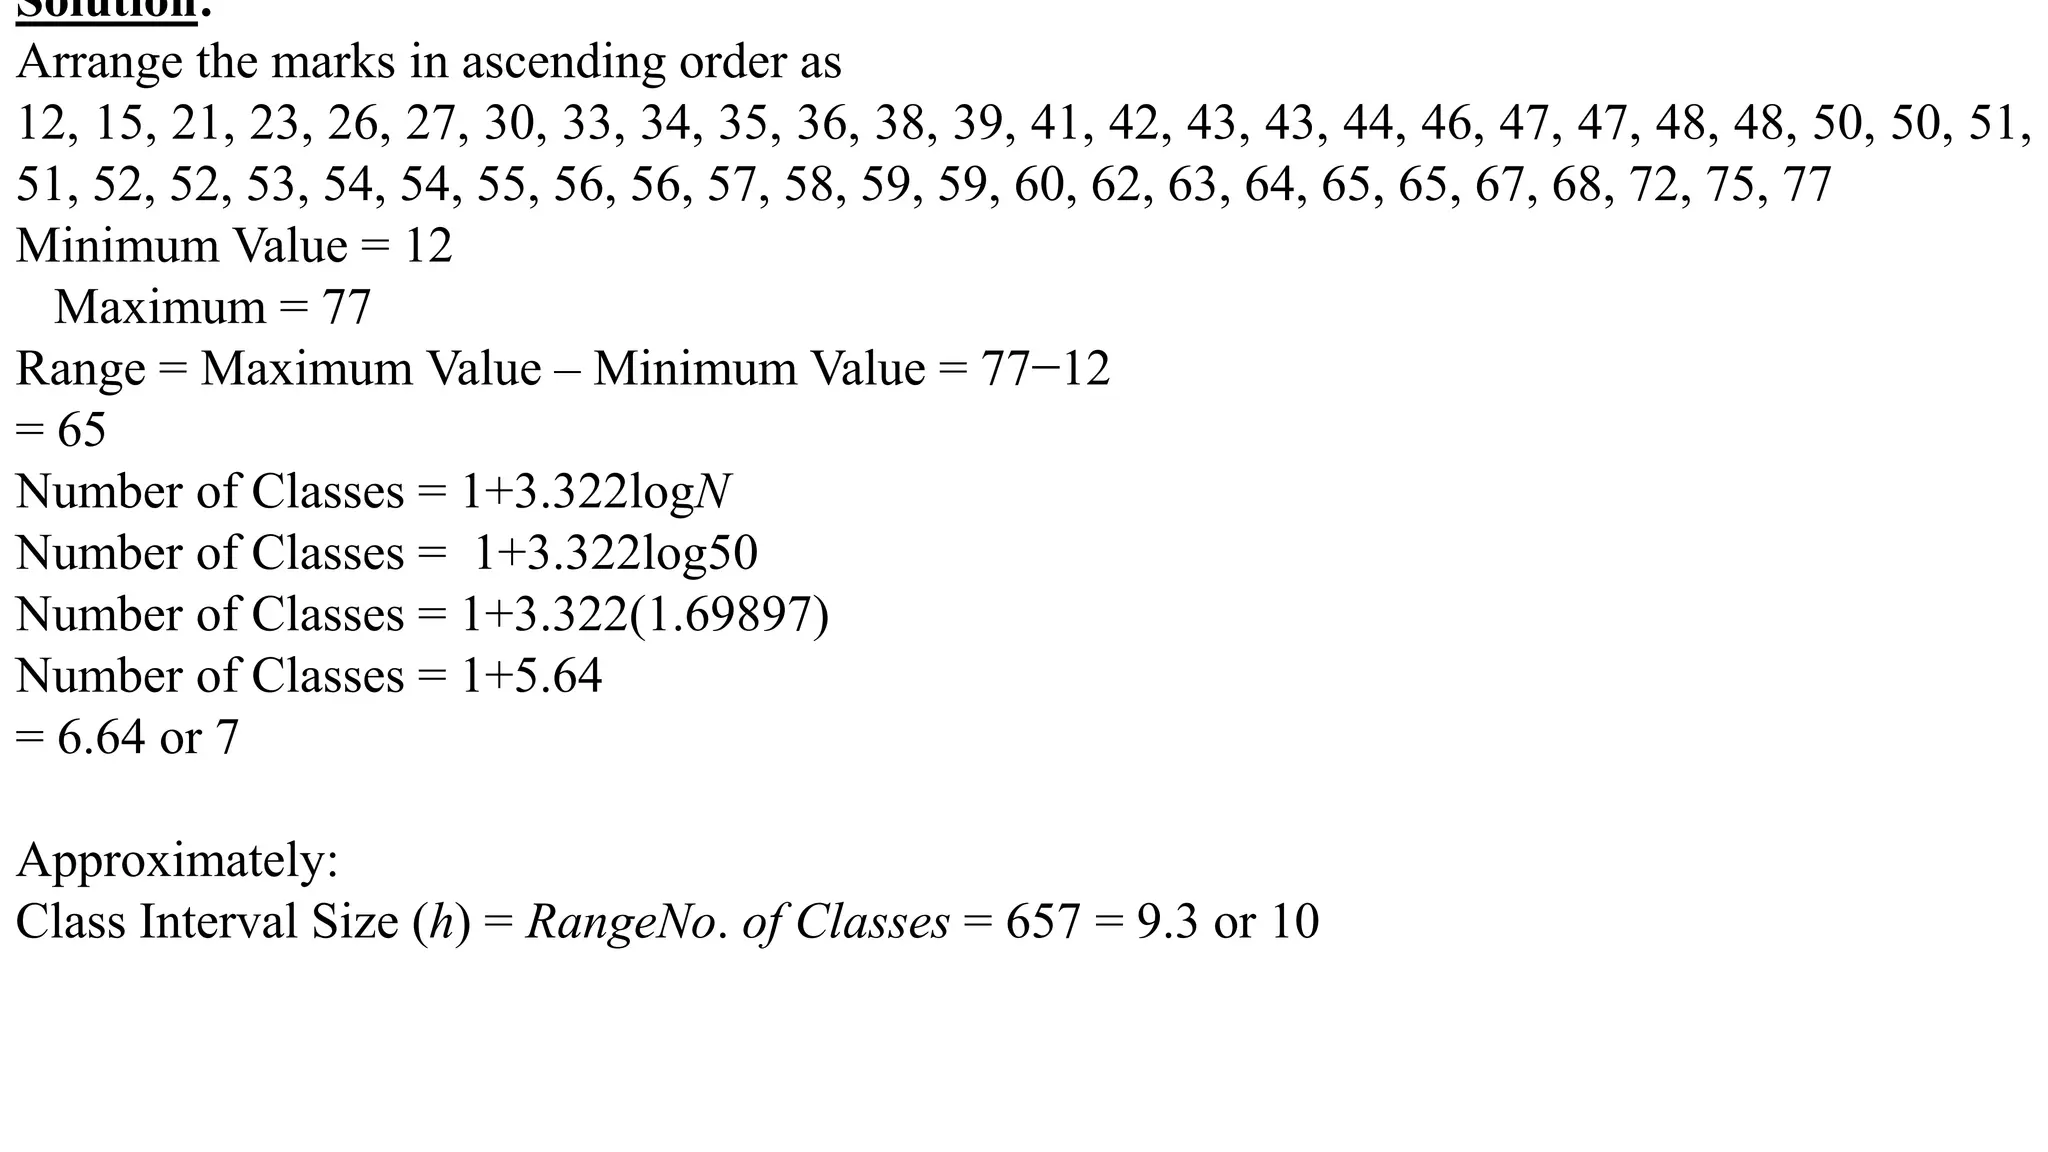
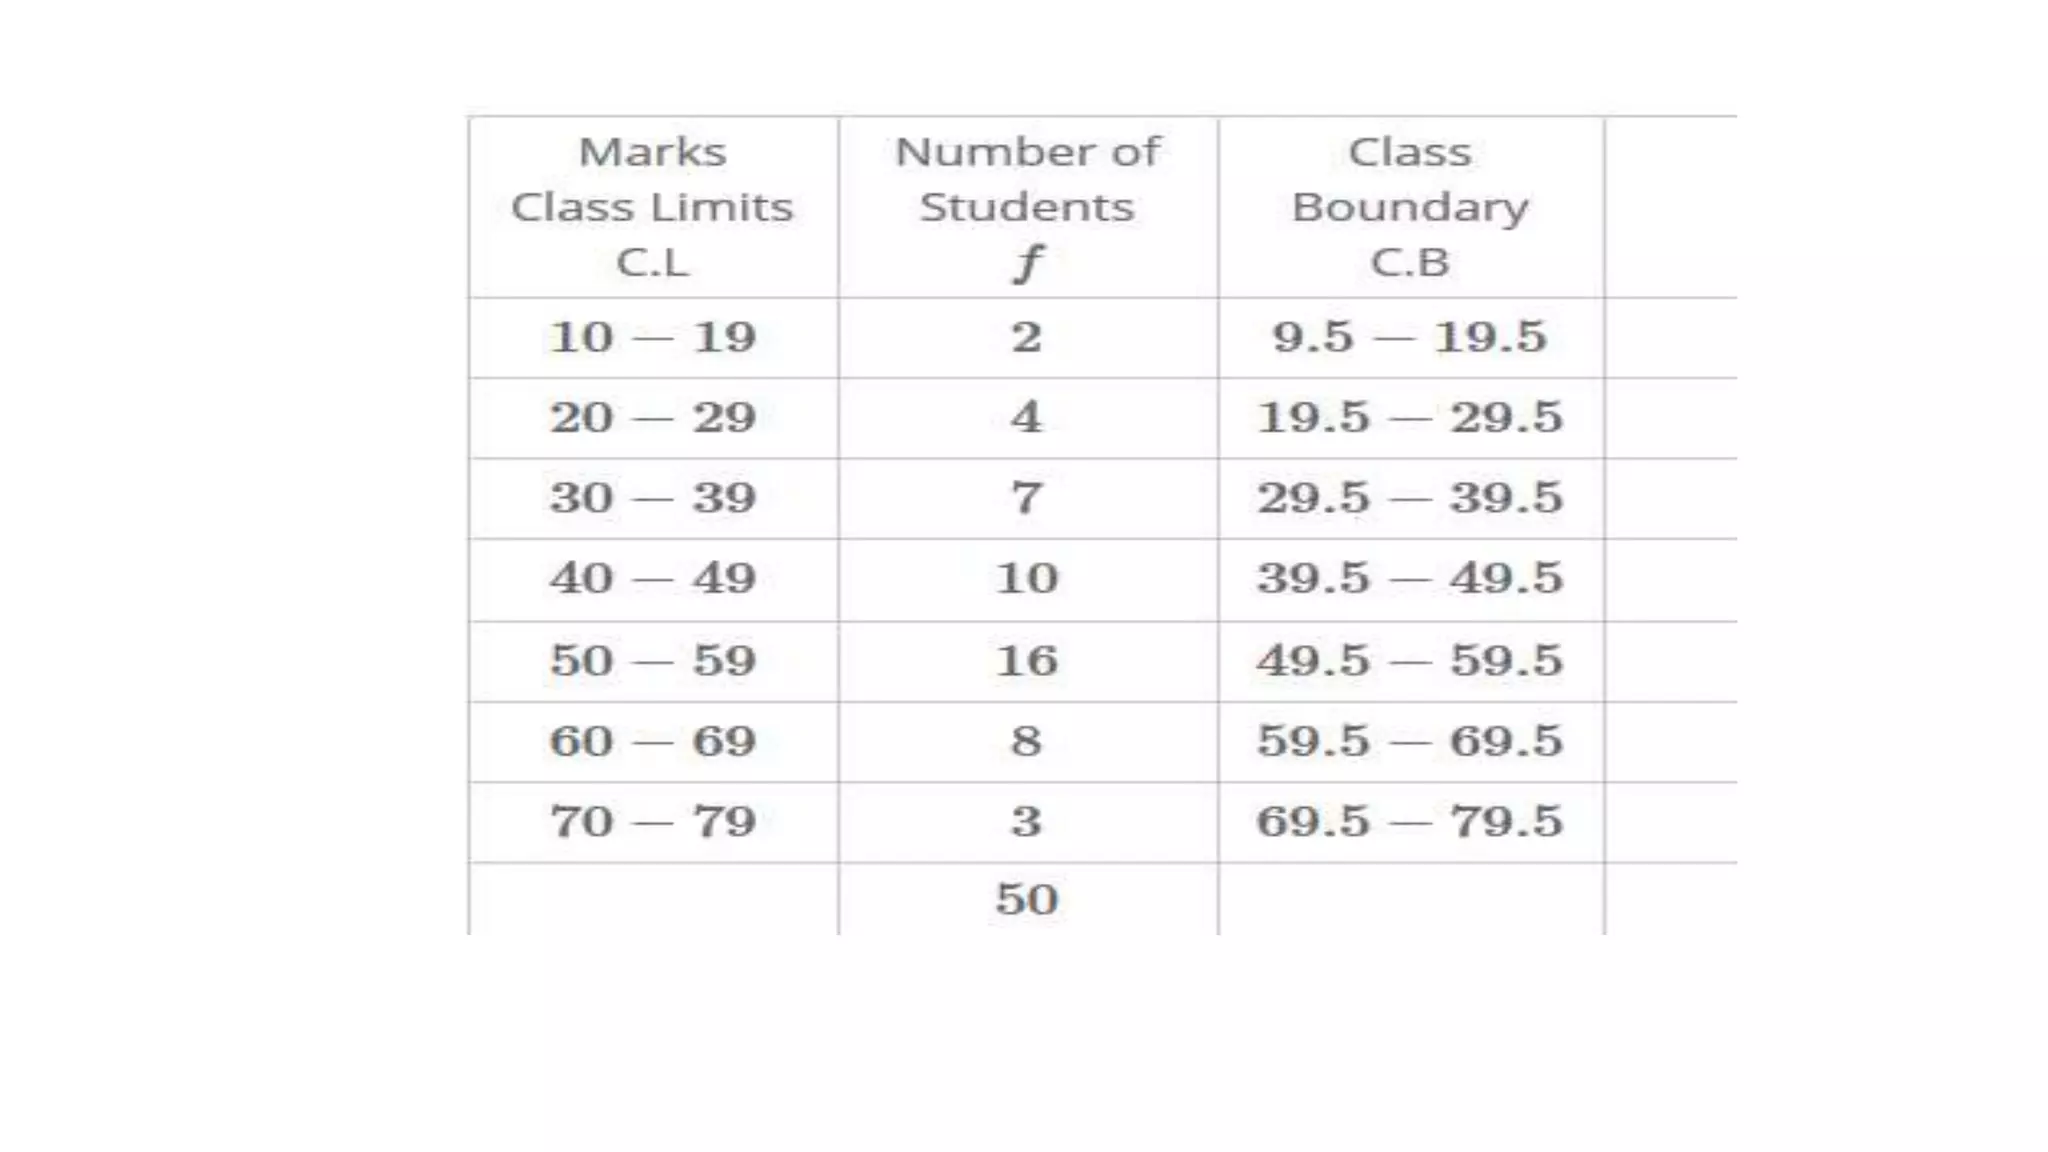
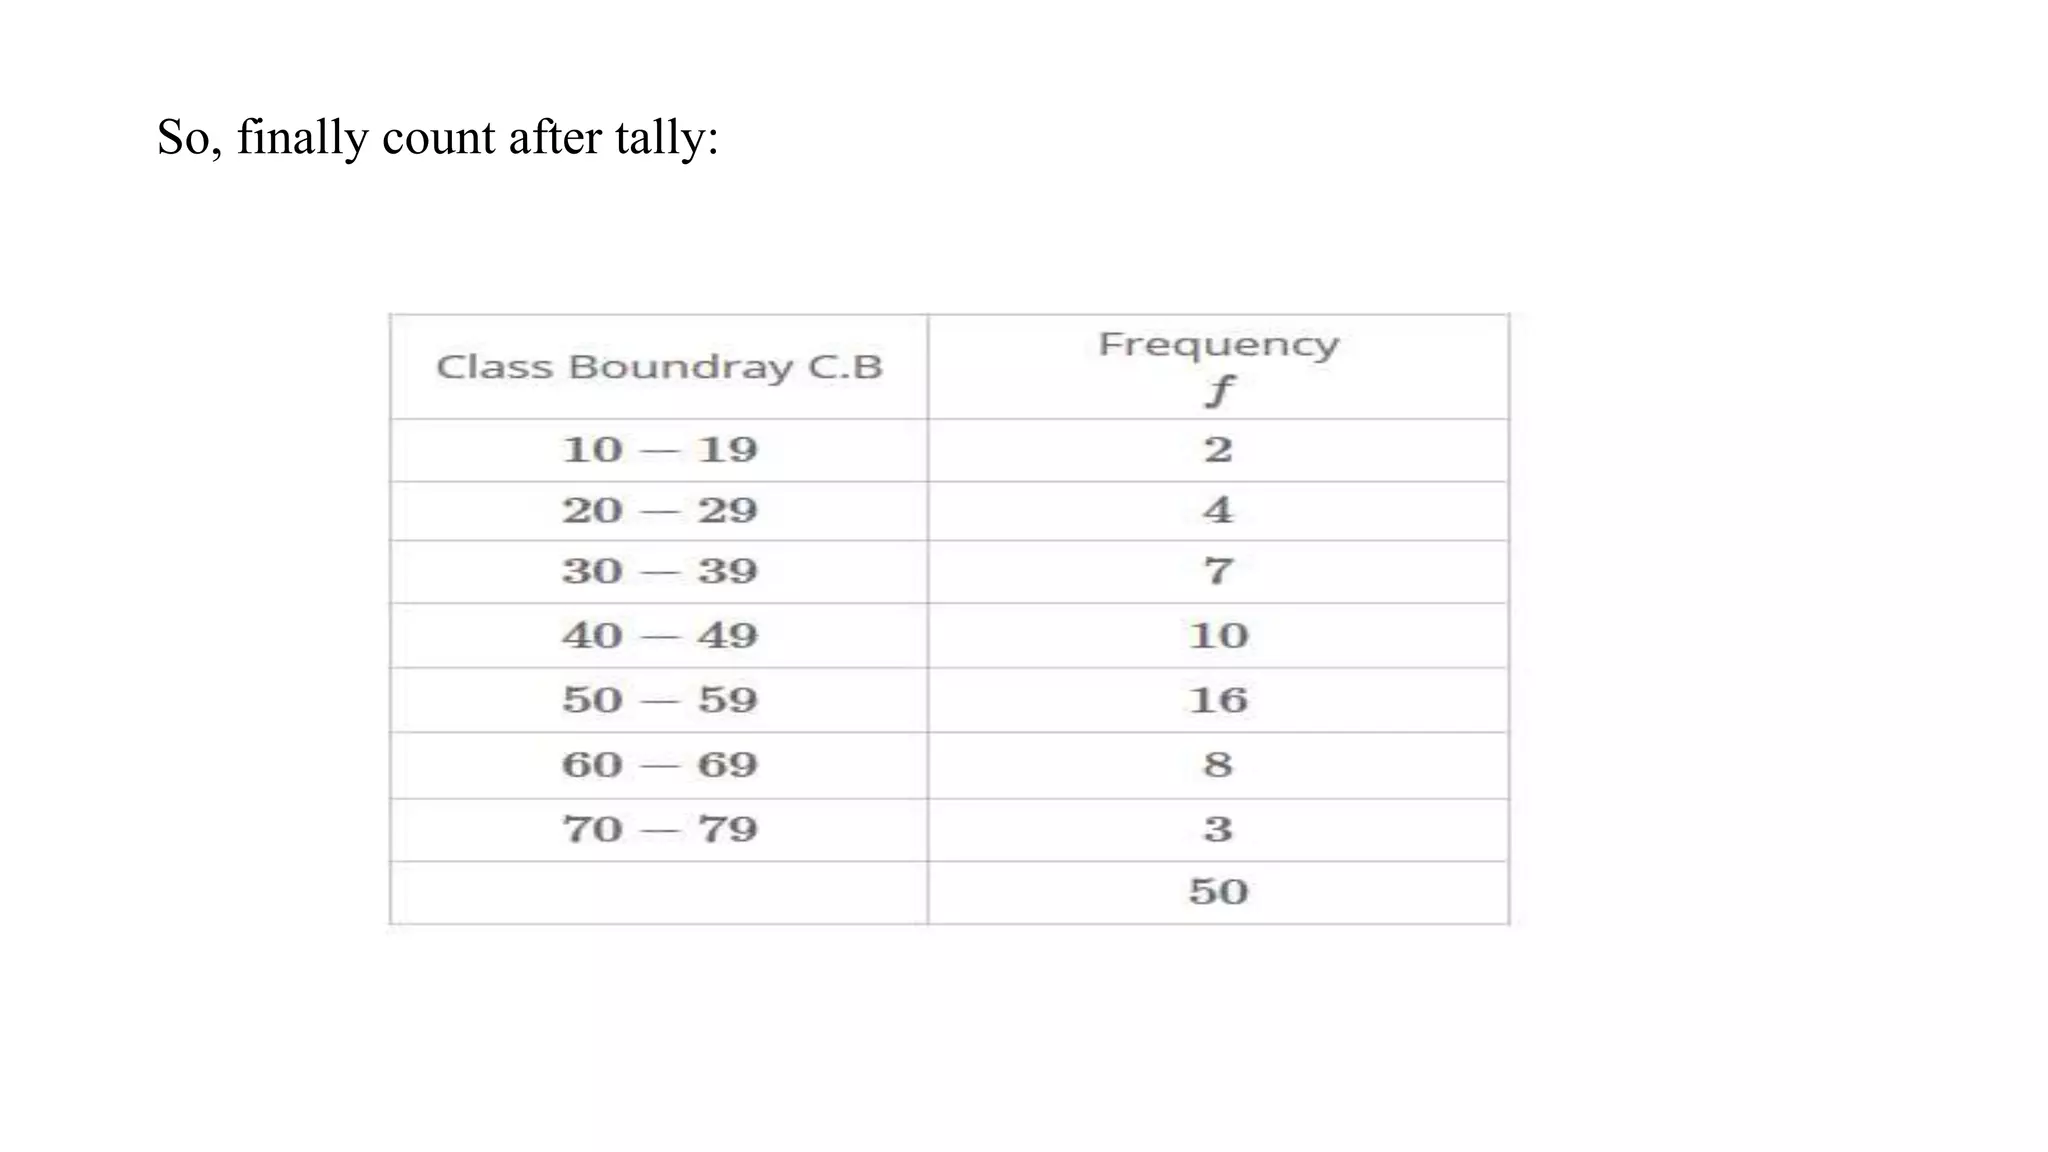
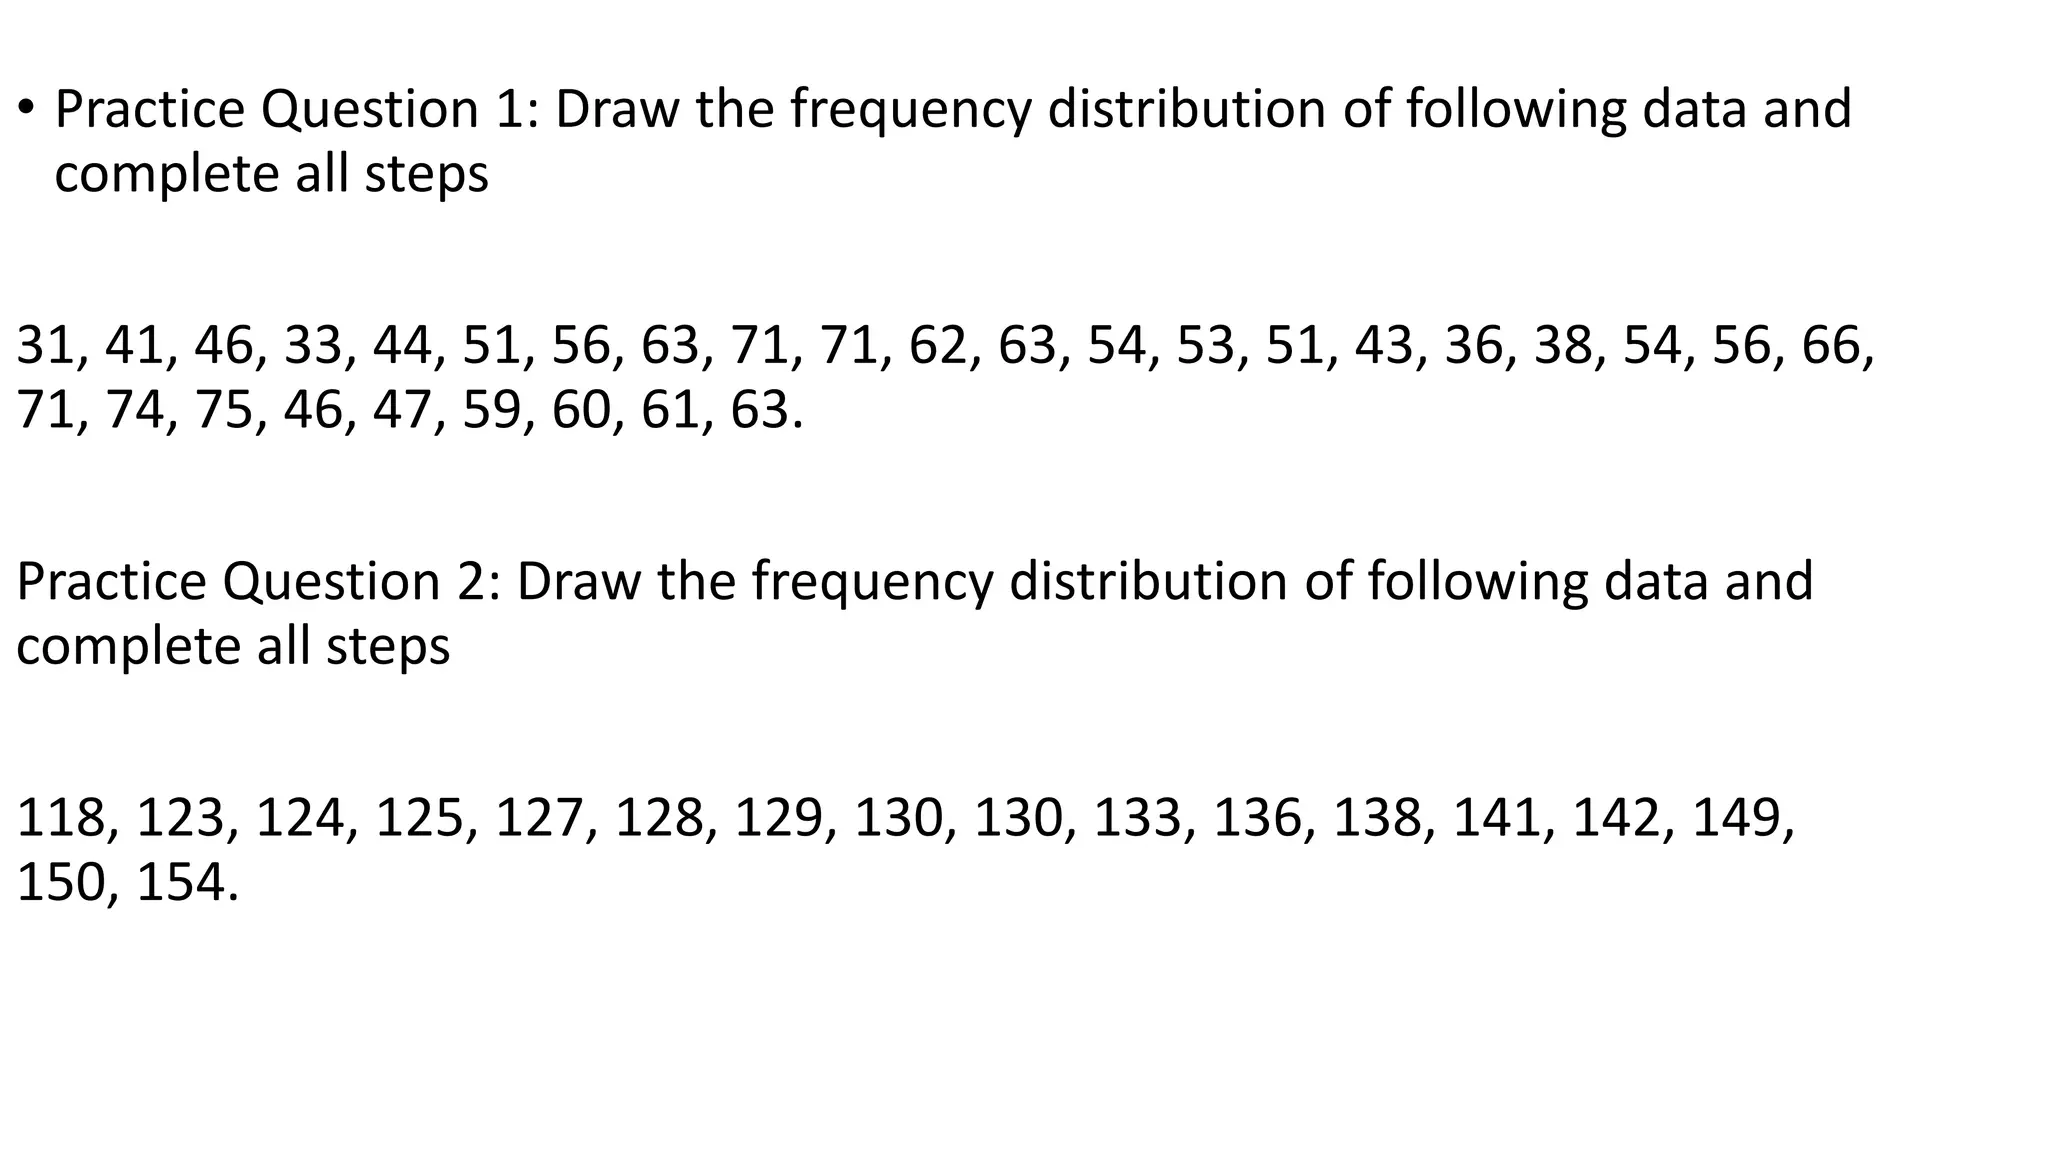
Construct Frequency Distribution
Construct a frequency distribution with the suitable class interval size of marks
obtained by 50 students of a class, which are given below:
23, 50, 38, 42, 63, 75, 12, 33, 26, 39, 35, 47, 43, 52, 56, 59, 64, 77, 15, 21, 51,
54, 72, 68, 36, 65, 52, 60, 27, 34, 47, 48, 55, 58, 59, 62, 51, 48, 50, 41, 57, 65,
54, 43, 56, 44, 30, 46, 67, 53
Solution:
Arrange the marks in ascending order as
12, 15, 21, 23, 26, 27, 30, 33, 34, 35, 36, 38, 39, 41, 42, 43, 43, 44, 46, 47, 47, 48, 48, 50, 50, 51,
51, 52, 52, 53, 54, 54, 55, 56, 56, 57, 58, 59, 59, 60, 62, 63, 64, 65, 65, 67, 68, 72, 75, 77
Minimum Value = 12
Maximum = 77
Range = Maximum Value – Minimum Value = 77−12
= 65
Number of Classes = 1+3.322logN
Number of Classes = 1+3.322log50
Number of Classes = 1+3.322(1.69897)
Number of Classes = 1+5.64
= 6.64 or 7
Approximately:
Class Interval Size (h) = RangeNo. of Classes = 657 = 9.3 or 10
To find the class boundaries, we take half of the difference between the
lower class limit of the 2nd class and the upper class limit of the 1st
class20−192=12=0.5. This value is subtracted from the lower class limit and
is added to the upper class limit to get the required class boundaries
So, finally count after tally:
• Practice Question 1: Draw the frequency distribution of following data and
complete all steps
31, 41, 46, 33, 44, 51, 56, 63, 71, 71, 62, 63, 54, 53, 51, 43, 36, 38, 54, 56, 66,
71, 74, 75, 46, 47, 59, 60, 61, 63.
Practice Question 2: Draw the frequency distribution of following data and
complete all steps
118, 123, 124, 125, 127, 128, 129, 130, 130, 133, 136, 138, 141, 142, 149,
150, 154.
• A survey was taken on Maple Avenue. In each of 20 homes, people were asked
how many cars were registered to their households. The results were recorded as
follows:
1, 2, 1, 0, 3, 4, 0, 1, 1, 1, 2, 2, 3, 2, 3, 2, 1, 4, 0, 0
So, frequency distribution will be:

Frequency distribution

  • 1.
  • 2.
    Construct a frequencydistribution with the suitable class interval size of marks obtained by 50 students of a class, which are given below: 23, 50, 38, 42, 63, 75, 12, 33, 26, 39, 35, 47, 43, 52, 56, 59, 64, 77, 15, 21, 51, 54, 72, 68, 36, 65, 52, 60, 27, 34, 47, 48, 55, 58, 59, 62, 51, 48, 50, 41, 57, 65, 54, 43, 56, 44, 30, 46, 67, 53
  • 3.
    Solution: Arrange the marksin ascending order as 12, 15, 21, 23, 26, 27, 30, 33, 34, 35, 36, 38, 39, 41, 42, 43, 43, 44, 46, 47, 47, 48, 48, 50, 50, 51, 51, 52, 52, 53, 54, 54, 55, 56, 56, 57, 58, 59, 59, 60, 62, 63, 64, 65, 65, 67, 68, 72, 75, 77 Minimum Value = 12 Maximum = 77 Range = Maximum Value – Minimum Value = 77−12 = 65 Number of Classes = 1+3.322logN Number of Classes = 1+3.322log50 Number of Classes = 1+3.322(1.69897) Number of Classes = 1+5.64 = 6.64 or 7 Approximately: Class Interval Size (h) = RangeNo. of Classes = 657 = 9.3 or 10
  • 5.
    To find theclass boundaries, we take half of the difference between the lower class limit of the 2nd class and the upper class limit of the 1st class20−192=12=0.5. This value is subtracted from the lower class limit and is added to the upper class limit to get the required class boundaries
  • 6.
    So, finally countafter tally:
  • 7.
    • Practice Question1: Draw the frequency distribution of following data and complete all steps 31, 41, 46, 33, 44, 51, 56, 63, 71, 71, 62, 63, 54, 53, 51, 43, 36, 38, 54, 56, 66, 71, 74, 75, 46, 47, 59, 60, 61, 63. Practice Question 2: Draw the frequency distribution of following data and complete all steps 118, 123, 124, 125, 127, 128, 129, 130, 130, 133, 136, 138, 141, 142, 149, 150, 154.
  • 8.
    • A surveywas taken on Maple Avenue. In each of 20 homes, people were asked how many cars were registered to their households. The results were recorded as follows: 1, 2, 1, 0, 3, 4, 0, 1, 1, 1, 2, 2, 3, 2, 3, 2, 1, 4, 0, 0 So, frequency distribution will be: