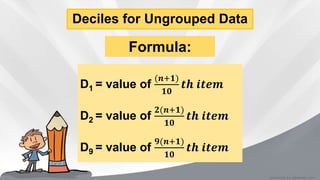
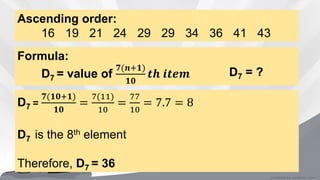
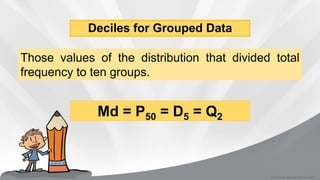
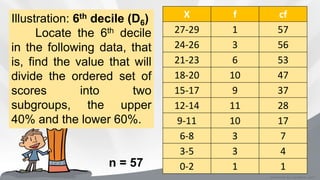
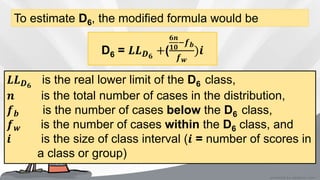
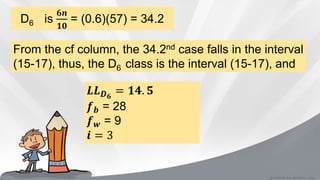
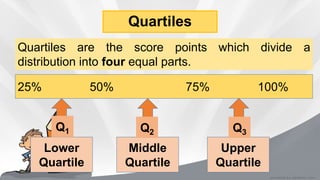
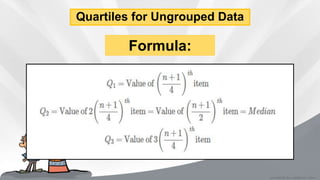
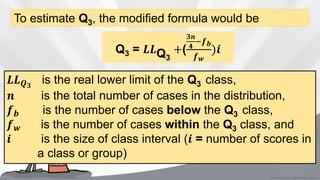
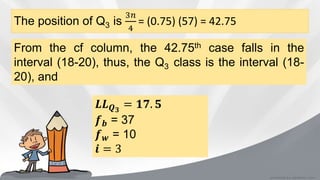
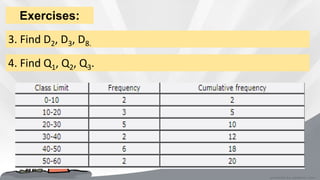
This document defines and provides formulas and examples for calculating quartiles and deciles from both ungrouped and grouped data. Quartiles and deciles are statistical measures used to divide a data set into four and ten equal parts, respectively. The document explains that quartiles are calculated as Q1, Q2, Q3 to divide the data into the lower 25%, middle 50%, and upper 25%. Deciles are calculated as D1-D9 to divide the data into ten equal parts. Modified formulas are provided to calculate quartiles and deciles from grouped frequency distribution data. Examples are included to demonstrate calculating these measures.
probability of a mutually and non mutually events. topic in mathematics 10 .statistics and probability . probability of a mutually and non mutually events. topic in mathematics 10 .statistics and probability . probability of a mutually and non mutually events. topic in mathematics 10 .statistics and probability . probability of a mutually and non mutually events. topic in mathematics 10 .statistics and probability . probability of a mutually and non mutually events. topic in mathematics 10 .statistics and probability . probability of a mutually and non mutually events. topic in mathematics 10 .statistics and probability . probability of a mutually and non mutually events. topic in mathematics 10 .statistics and probability . probability of a mutually and non mutually events. topic in mathematics 10 .statistics and probability . probability of a mutually and non mutually events. topic in mathematics 10 .statistics and probability . probability of a mutually and non mutually events. topic in mathematics 10 .statistics and probability . probability of a mutually and non mutually events. topic in mathematics 10 .statistics and probability . probability of a mutually and non mutually events. topic in mathematics 10 .statistics and probability . probability of a mutually and non mutually events. topic in mathematics 10 .statistics and probability . probability of a mutually and non mutually events. topic in mathematics 10 .statistics and probability . probability of a mutually and non mutually events. topic in mathematics 10 .statistics and probability . probability of a mutually and non mutually events. topic in mathematics 10 .statistics and probability . probability of a mutually and non mutually events. topic in mathematics 10 .statistics and probability . probability of a mutually and non mutually events. topic in mathematics 10 .statistics and probability . probability of a mutually and non mutually events. topic in mathematics 10 .statistics and probability . probability of a mutually and non mutually events. topic in mathematics 10 .statistics and probability . probability of a mutually and non mutually events. topic in mathematics 10 .statistics and probability . probability of a mutually and non mutually events. topic in mathematics 10 .statistics and probability . probability of a mutually and non mutually events. topic in mathematics 10 .statistics and probability . probability of a mutually and non mutually events. topic in mathematics 10 .statistics and probability . probability of a mutually and non mutually events. topic in mathematics 10 .statistics and probability . probability of a mutually and non mutually events. topic in mathematics 10 .statistics and probability . probability of a mutually and non mutually events. topic in mathematics 10 .statistics and probability . probability of a mutually and non mutually events. topic in mathematics 10 .statistics and probability . probability of a mutually and non mutually events. topic in
Probability Distribution (Discrete Random Variable)Cess011697
Β
Learning Competencies:
- to find the possible values of a random variable.
illustrates a probability distribution for a discrete random variable and its properties.
- to compute probabilities corresponding to a given random variable.
There are some exercises for you to answer.
The steps in computing the median are similar to that of Q1 and Q3
. In finding the median,
we need first to determine the median class. The Q1 class is the class interval where
the π
4
th score is contained, while the class interval that contains the 3π
4
π‘β
score is the Q3 class.
Formula :ππ = LB +
ππ
4
βπππ
πππ
π
LB = lower boundary of the of the ππ class
N = total frequency
πππ= cumulative frequency of the class before the ππ class
πππ
= frequency of the ππ class
i = size of the class interval
k = the value of quartile being asked
The interquartile range describes the middle 50% of values when
ordered from lowest to highest. To find the interquartile range (IQR),
first find the median (middle value) of the upper and the lower half of
the data. These values are Q1 and Q3
. The IQR is the difference
between Q3 and Q1
.
Interquartile Range (IQR) = Q3 β Q1
The quartile deviation or semi-interquartile range is one-half the
difference between the third and the first quartile.
Quartile Deviation (QD) =
π3βπ1
2
The formula in finding the kth decile of a distribution is
π·π = ππππ +
(
π
10)π β ππ
ππ·π
π
πΏπ΅ππ β πΏππ€ππ π΅ππ’πππππ¦ ππ π‘βπ ππ‘β ππππππ
π β π‘ππ‘ππ ππ’ππππ ππ πππππ’ππππππ
ππ β ππ’πππ’πππ‘ππ£π πππππ’ππππ¦ ππππππ π‘βπ ππ‘β ππππππ
πΉππ β πππππ’ππππ¦ ππ π‘βπ ππ‘β ππππππ
π β ππππ π π ππ§π
quantitative aptitude, maths
applicable to
Common Aptitude Test (CAT)
Bank Competitive Exam
UPSC Competitive Exams
SSC Competitive Exams
Defence Competitive Exams
L.I.C/ G. I.C Competitive Exams
Railway Competitive Exam
University Grants Commission (UGC)
Career Aptitude Test (IT Companies) and etc.
Pattern Recognition - Designing a minimum distance class mean classifierNayem Nayem
Β
βMinimum Distance to Class Mean Classifierβ is used to classify unclassified sample vectors where the vectors clustered in more than one classes are given. We can classify the unclassified sample vectors with Class Mean Classifier.
Operation βBlue Starβ is the only event in the history of Independent India where the state went into war with its own people. Even after about 40 years it is not clear if it was culmination of states anger over people of the region, a political game of power or start of dictatorial chapter in the democratic setup.
The people of Punjab felt alienated from main stream due to denial of their just demands during a long democratic struggle since independence. As it happen all over the word, it led to militant struggle with great loss of lives of military, police and civilian personnel. Killing of Indira Gandhi and massacre of innocent Sikhs in Delhi and other India cities was also associated with this movement.
Read| The latest issue of The Challenger is here! We are thrilled to announce that our school paper has qualified for the NATIONAL SCHOOLS PRESS CONFERENCE (NSPC) 2024. Thank you for your unwavering support and trust. Dive into the stories that made us stand out!
This is a presentation by Dada Robert in a Your Skill Boost masterclass organised by the Excellence Foundation for South Sudan (EFSS) on Saturday, the 25th and Sunday, the 26th of May 2024.
He discussed the concept of quality improvement, emphasizing its applicability to various aspects of life, including personal, project, and program improvements. He defined quality as doing the right thing at the right time in the right way to achieve the best possible results and discussed the concept of the "gap" between what we know and what we do, and how this gap represents the areas we need to improve. He explained the scientific approach to quality improvement, which involves systematic performance analysis, testing and learning, and implementing change ideas. He also highlighted the importance of client focus and a team approach to quality improvement.
Synthetic Fiber Construction in lab .pptxPavel ( NSTU)
Β
Synthetic fiber production is a fascinating and complex field that blends chemistry, engineering, and environmental science. By understanding these aspects, students can gain a comprehensive view of synthetic fiber production, its impact on society and the environment, and the potential for future innovations. Synthetic fibers play a crucial role in modern society, impacting various aspects of daily life, industry, and the environment. ynthetic fibers are integral to modern life, offering a range of benefits from cost-effectiveness and versatility to innovative applications and performance characteristics. While they pose environmental challenges, ongoing research and development aim to create more sustainable and eco-friendly alternatives. Understanding the importance of synthetic fibers helps in appreciating their role in the economy, industry, and daily life, while also emphasizing the need for sustainable practices and innovation.
Ethnobotany and Ethnopharmacology:
Ethnobotany in herbal drug evaluation,
Impact of Ethnobotany in traditional medicine,
New development in herbals,
Bio-prospecting tools for drug discovery,
Role of Ethnopharmacology in drug evaluation,
Reverse Pharmacology.
The French Revolution, which began in 1789, was a period of radical social and political upheaval in France. It marked the decline of absolute monarchies, the rise of secular and democratic republics, and the eventual rise of Napoleon Bonaparte. This revolutionary period is crucial in understanding the transition from feudalism to modernity in Europe.
For more information, visit-www.vavaclasses.com
Welcome to TechSoup New Member Orientation and Q&A (May 2024).pdfTechSoup
Β
In this webinar you will learn how your organization can access TechSoup's wide variety of product discount and donation programs. From hardware to software, we'll give you a tour of the tools available to help your nonprofit with productivity, collaboration, financial management, donor tracking, security, and more.
3. Deciles
Deciles are nine partitional values of the data or
the given set of observation into ten equal parts.
These 9 values are represented by Dβ, Dβ, Dβ, Dβ,
Dβ , Dβ, Dβ, Dβ and Dβ .
They shows the 10%, 20%, 30%, 40%, 50%, 60%, 70%,
80% and 90%
4. Deciles for Ungrouped Data
D1 = value of
(π+π)
ππ
ππ ππππ
D2 = value of
π(π+π)
ππ
ππ ππππ
D9 = value of
π(π+π)
ππ
ππ ππππ
Formula:
5. Deciles for Ungrouped Data
Solution:
First, arrange the scores in ascending
order.
Example:
Find the 7th Decile or D7 of the following test scores
of a random sample of 10 students.
36 43 41 29 16 24 34 21 19 29
6. Ascending order:
16 19 21 24 29 29 34 36 41 43
Formula:
D7 = value of
π(π+π)
ππ
ππ ππππ D7 = ?
D7 =
π(ππ+π)
ππ
=
7(11)
10
=
77
10
= 7.7 = 8
D7 is the 8th element
Therefore, D7 = 36
7. Deciles for Grouped Data
Those values of the distribution that divided total
frequency to ten groups.
Md = P50 = D5 = Q2
8. Md = P50 = D5 = Q2
Md = LL (
π
π
β π π
π π
)π
LL is the real lower limit of the median class,
π is the total number of cases in the distribution,
π π is the number of cases below the median class,
π π is the number of cases within the median class, and
π is the size of class interval (π = number of scores in a
class or group)
9. Illustration: 6th decile (D6)
Locate the 6th decile
in the following data, that
is, find the value that will
divide the ordered set of
scores into two
subgroups, the upper
40% and the lower 60%.
X f cf
27-29 1 57
24-26 3 56
21-23 6 53
18-20 10 47
15-17 9 37
12-14 11 28
9-11 10 17
6-8 3 7
3-5 3 4
0-2 1 1n = 57
10. To estimate D6, the modified formula would be
D6 = π³π³ π« π
+(
ππ
ππ
βπ π
π π
)π
π³π³ π« π
is the real lower limit of the D6 class,
π is the total number of cases in the distribution,
π π is the number of cases below the D6 class,
π π is the number of cases within the D6 class, and
π is the size of class interval (π = number of scores in
a class or group)
11. D6 is
ππ
ππ
= (0.6)(57) = 34.2
From the cf column, the 34.2nd case falls in the interval
(15-17), thus, the D6 class is the interval (15-17), and
π³π³ π« π
= ππ. π
π π = 28
π π = 9
π = 3
12. Using the modified formula:
D6 = π³π³ π« π
+(
ππ
ππ
βπ π
π π
)π
π·6 = 14.5 +
34.2 β 28
9
3
π·6 = 14.5 +
6.2
9
3
= 14.5+2.06667
π·6= 16.57
This means that students
with scores greater than
16.57 belong to the upper
40% of the class and
students with scores less
than 16.57 belong to the
lower 60% of the class.
13. Quartiles
Quartiles are the score points which divide a
distribution into four equal parts.
25% 50% 75% 100%
Lower
Quartile
Middle
Quartile
Upper
Quartile
Q1 Q2 Q3
15. Example:
Following is the data of marks obtained by 20 students
in a test of statistics. Find Quartiles Q1 Q2 Q3 :
53 74 82 42 39 20 81 68 58 28
67 54 93 70 30 55 36 37 29 61
20 28 29 30 36 37 39 42 53 54
55 58 61 67 68 70 74 81 82 93
Ascending ordern = 20
16. Quartiles for Grouped Data
Illustration: 3rd quartile
(Q3)
Locate the 3rd quartile
(Q3) in the following data,
that is, find the value that
will divide the ordered set
of scores into two
subgroups, the upper 25%
and the lower 75%.
X f cf
27-29 1 57
24-26 3 56
21-23 6 53
18-20 10 47
15-17 9 37
12-14 11 28
9-11 10 17
6-8 3 7
3-5 3 4
0-2 1 1
n = 57
17. To estimate Q3, the modified formula would be
Q3 = π³π³Q3
+(
ππ
π
βπ π
π π
)π
π³π³ πΈ π
is the real lower limit of the Q3 class,
π is the total number of cases in the distribution,
π π is the number of cases below the Q3 class,
π π is the number of cases within the Q3 class, and
π is the size of class interval (π = number of scores in
a class or group)
18. The position of Q3 is
3π
4
= (0.75) (57) = 42.75
From the cf column, the 42.75th case falls in the
interval (18-20), thus, the Q3 class is the interval (18-
20), and
π³π³ πΈ π
= ππ. π
π π = 37
π π = 10
π = 3
19. π3 = 17.5 +
42.75 β 37
10
3
π3 = 14.5 +
5.75
10
3
= 17.5+1.725
π3= 19.225
Using the modified formula:
Q3 = π³π³Q3
+(
ππ
π
βπ π
π π
)π
This means that students
with scores greater than
19.225 belong to the
upper 25% of the class
and students with scores
less than 19.225 belong to
the lower 75% of the
class.
20. Exercises:
1. Find the 1st quartile, 2nd quartile, and third quartile,
given the scores of 10 students in their Mathematics
quiz.
38 43 56 55 25 27 25 39 40 45
2. Find the 6th decile, 7th decile, and 9th decile, given
the scores of 10 students in their Mathematics quiz.
AΒ decileΒ is a specific type of quantile that arranges data into 10 equal parts. In order to create deciles we must actually derive 9 specific numbers, or cut points, that define where these deciles begin and end.
There are three quartiles called the first quartile, second quartile and third quartile. The quartiles divide the set of observations into four equal parts. The second quartile is equal to the median. The first quartile is also called the lower quartile and is denoted byΒ Q1Q1. The third quartile is also called the upper quartile and is denoted byΒ Q3Q3. The lower quartileΒ Q1Q1Β is a point which has 25% of the observations below it and 75% of the observations above it. The upper quartileΒ Q3Q3Β is a point with 75% of the observations below it and 25% of the observations above it.Read more:Β https://www.emathzone.com/tutorials/basic-statistics/quartiles.html#ixzz5lR0DddB2