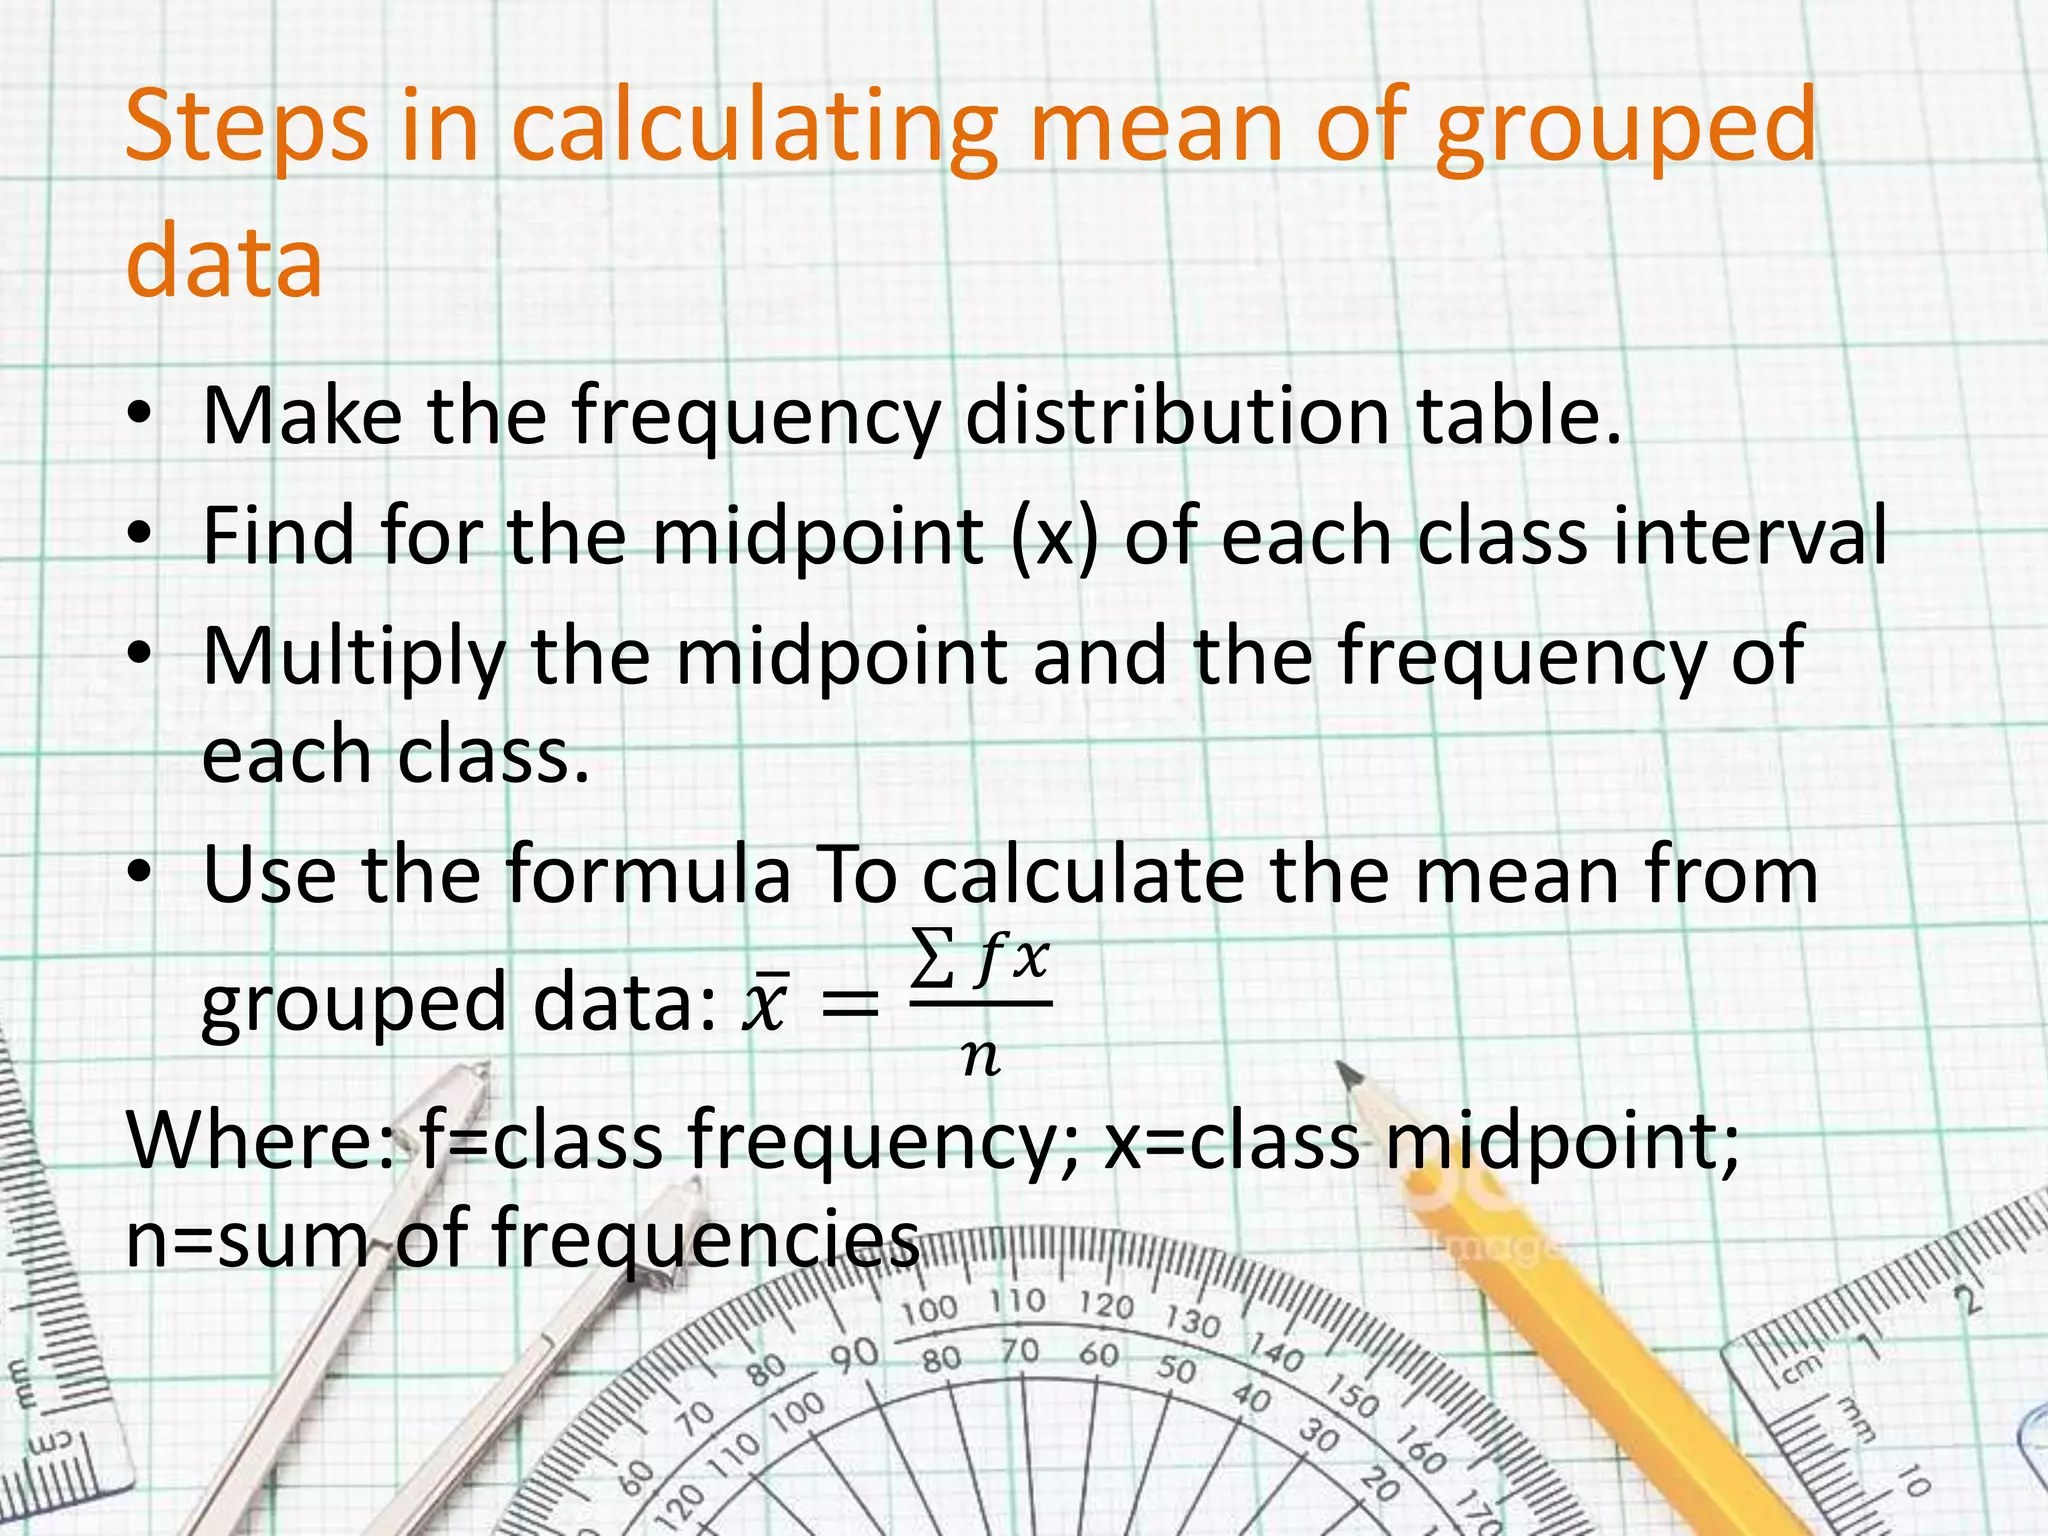
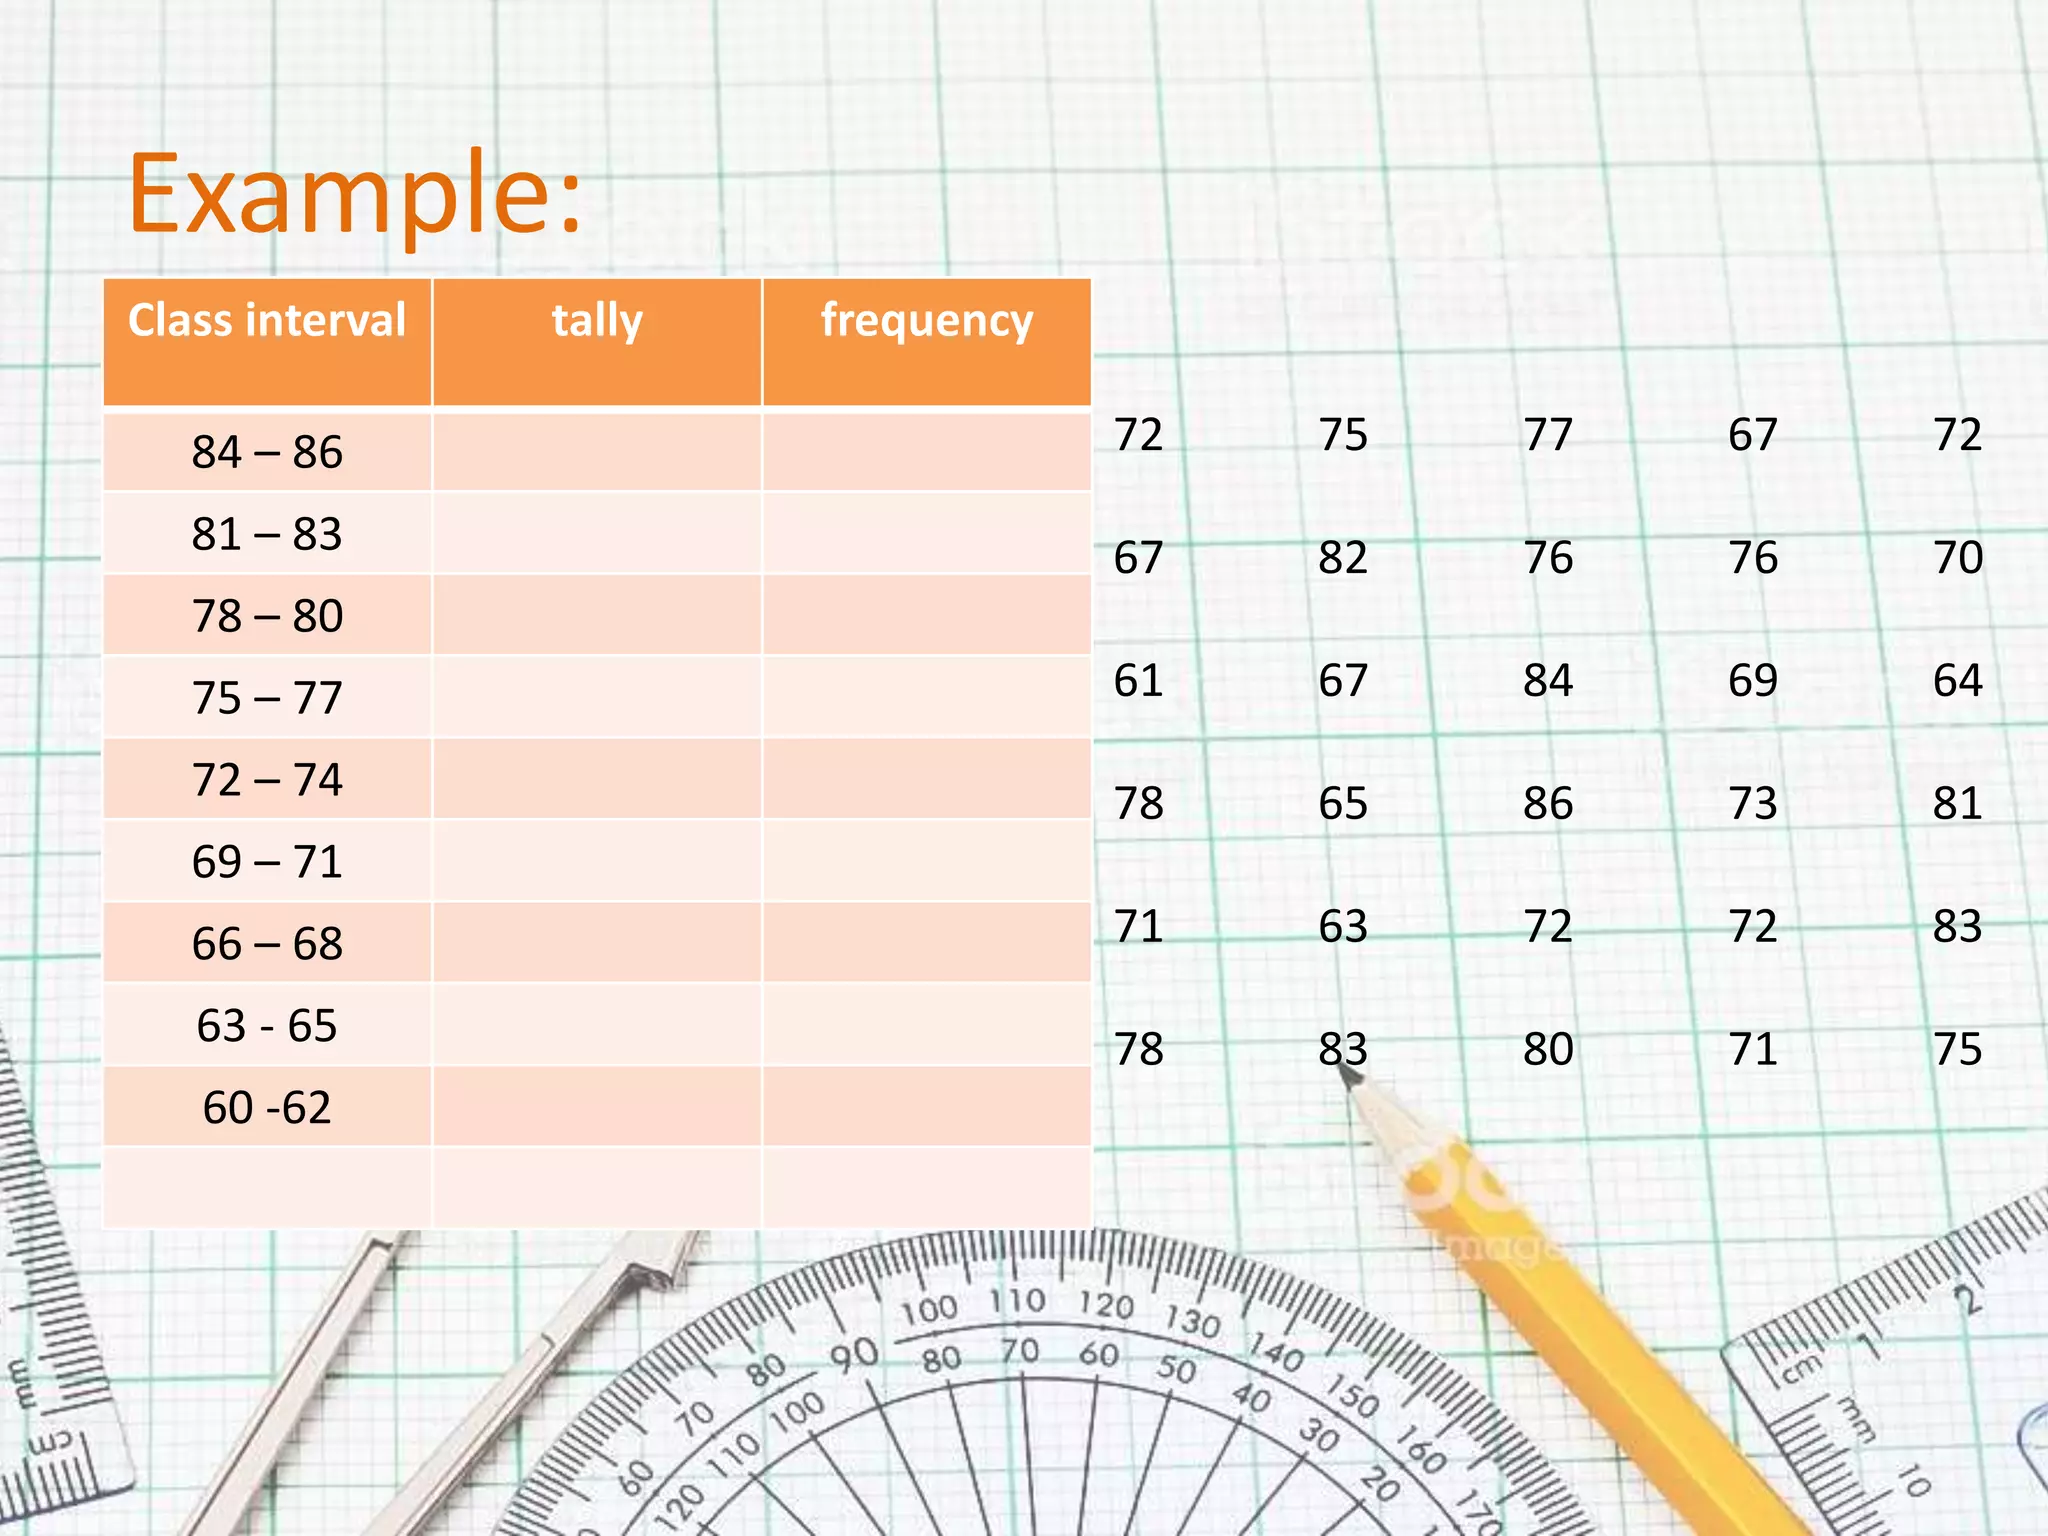
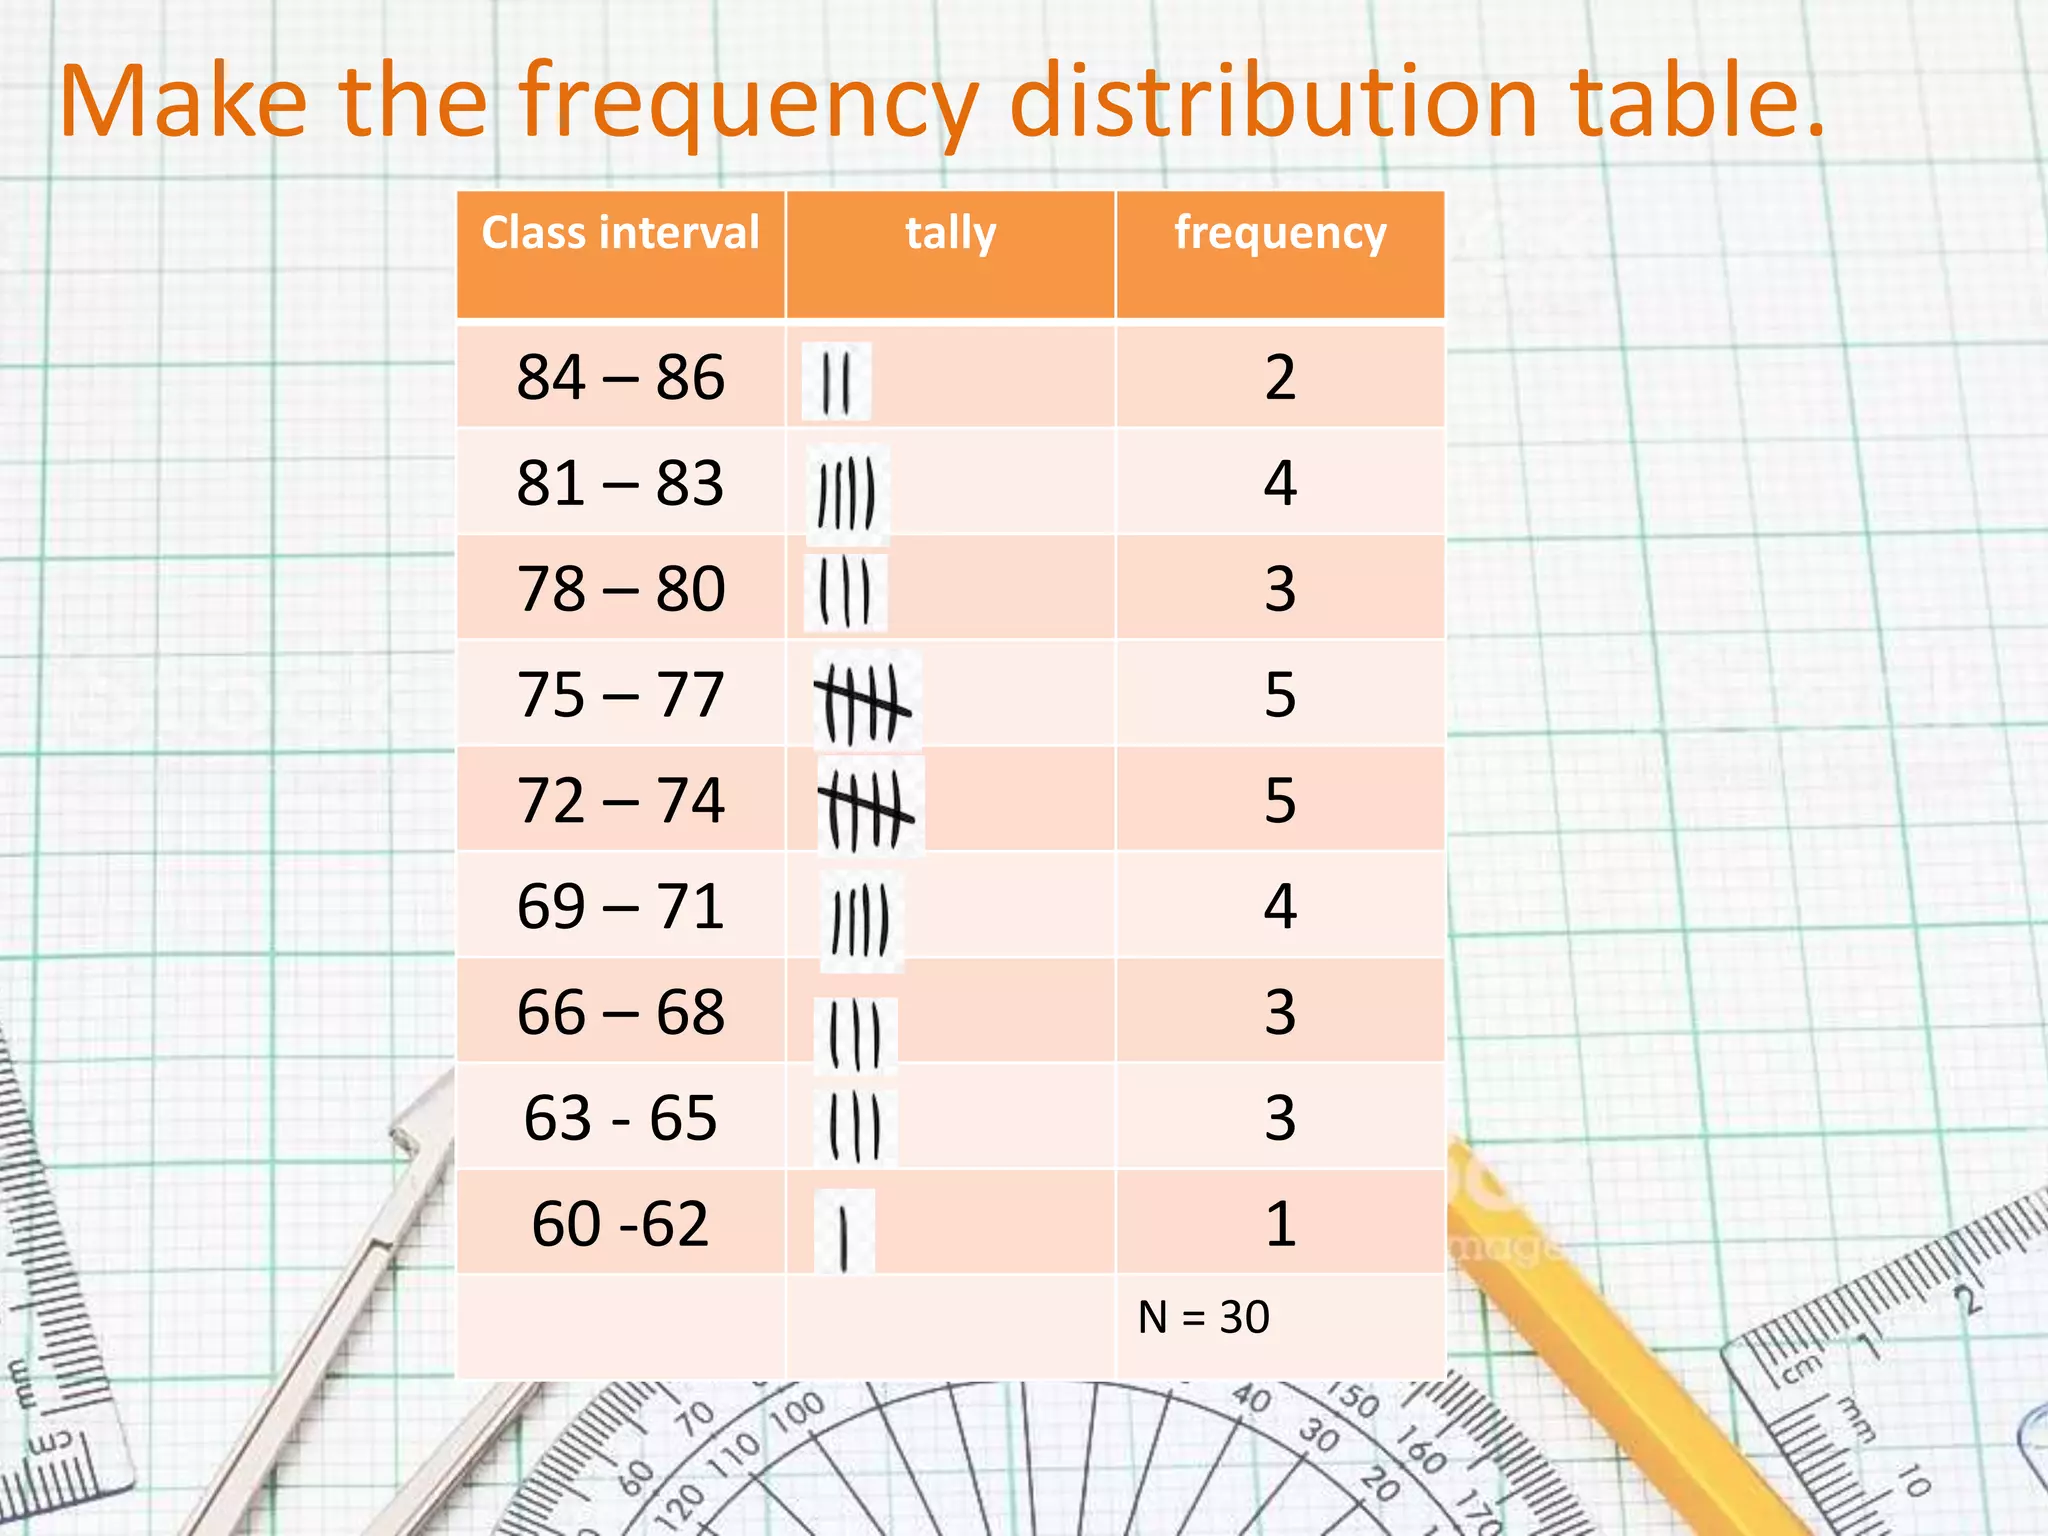
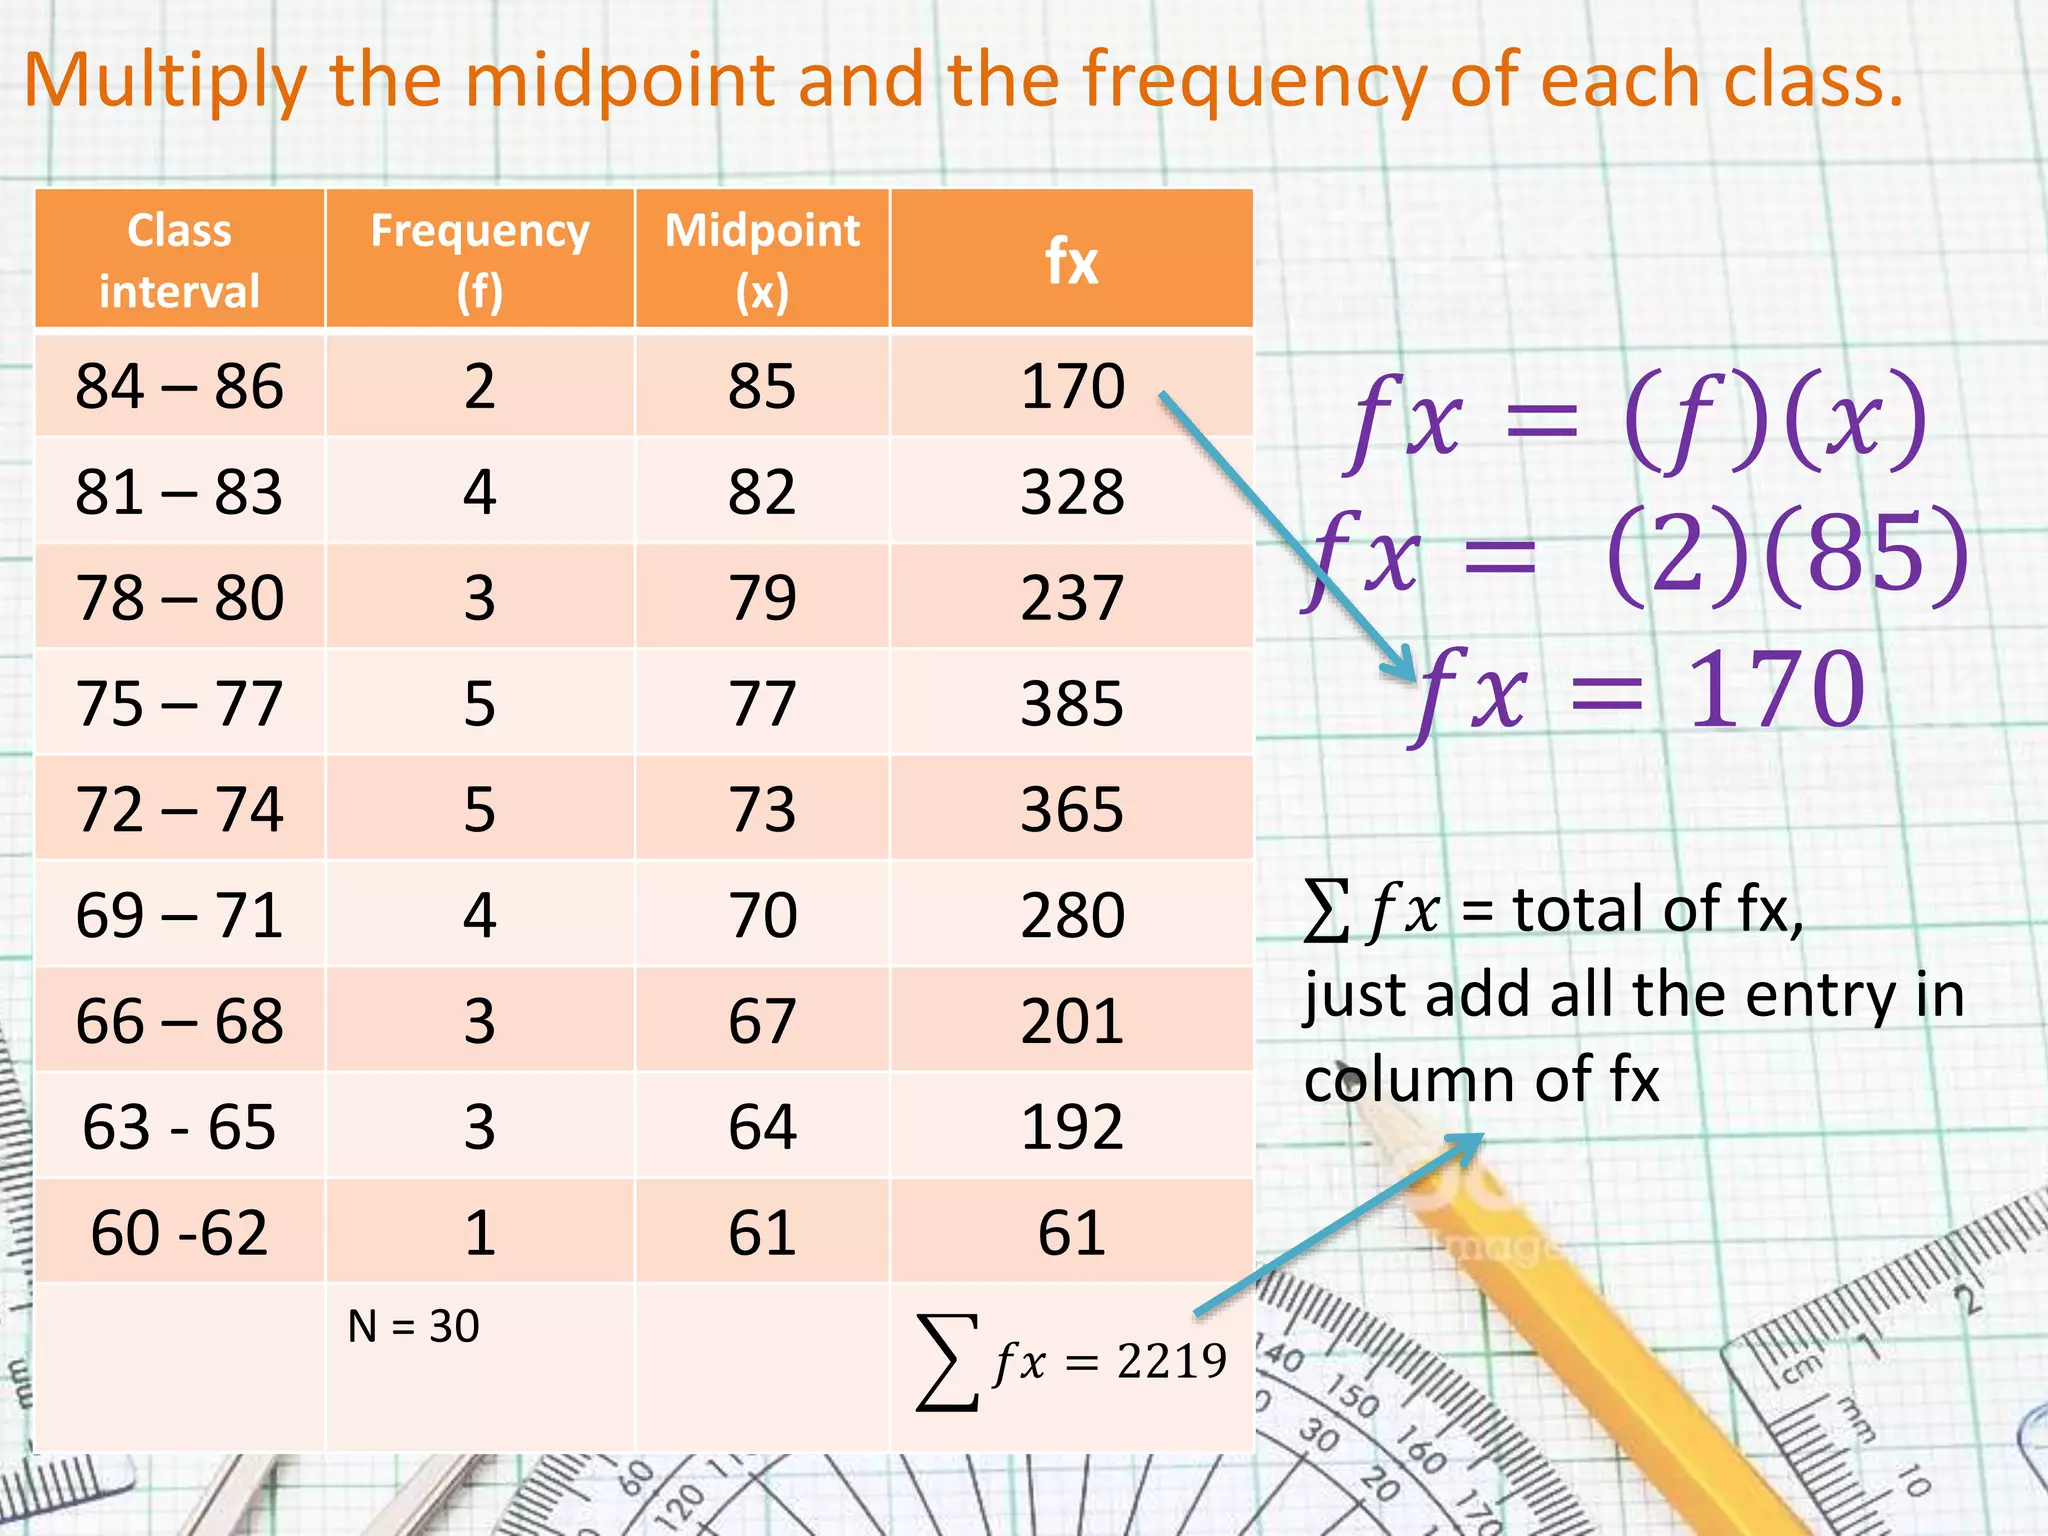
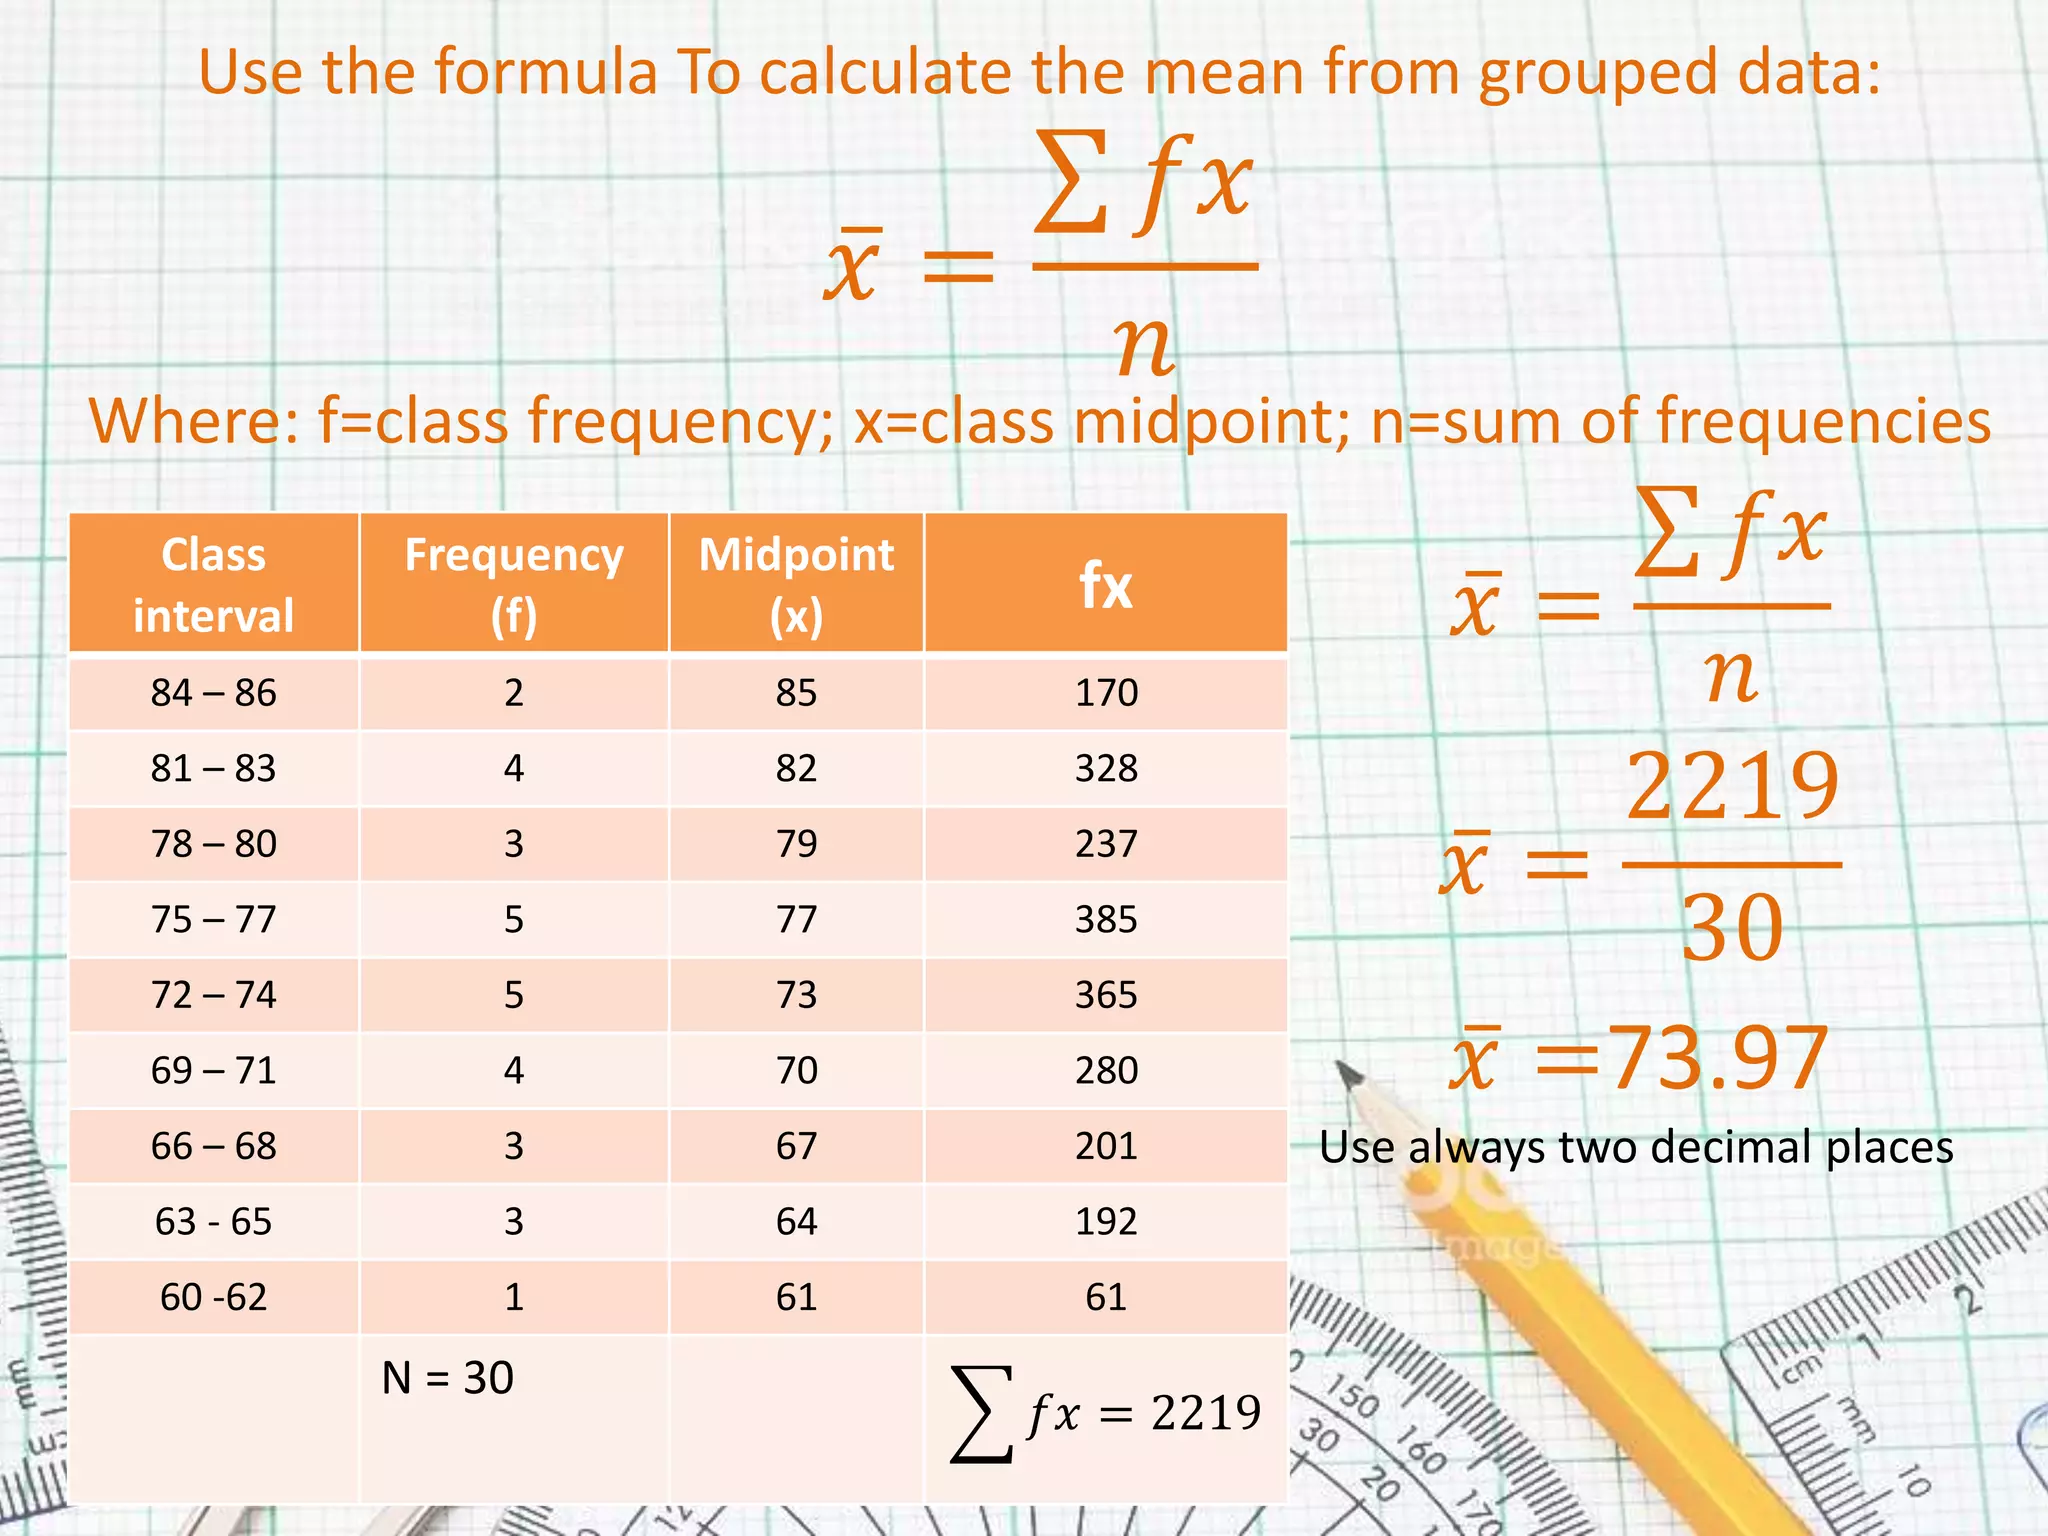
MEAN of
Grouped Data
By: Maryleigh P. Castillo
Objectives:
• Make frequency distribution
table
• Compute for the Mean
Steps in calculating mean of grouped
data
• Make the frequency distribution table.
• Find for the midpoint (x) of each class interval
• Multiply the midpoint and the frequency of
each class.
• Use the formula To calculate the mean from
grouped data: 𝑥 =
𝑓𝑥
𝑛
Where: f=class frequency; x=class midpoint;
n=sum of frequencies
Example:
Class interval tally frequency
84 – 86
81 – 83
78 – 80
75 – 77
72 – 74
69 – 71
66 – 68
63 - 65
60 -62
72 75 77 67 72
67 82 76 76 70
61 67 84 69 64
78 65 86 73 81
71 63 72 72 83
78 83 80 71 75
Make the frequency distribution table.
Class interval tally frequency
84 – 86 2
81 – 83 4
78 – 80 3
75 – 77 5
72 – 74 5
69 – 71 4
66 – 68 3
63 - 65 3
60 -62 1
N = 30
Find for the midpoint (x) of each class interval.
Class interval Frequency
(f)
Midpoint
(x)
84 – 86 2 85
81 – 83 4 82
78 – 80 3 79
75 – 77 5 77
72 – 74 5 73
69 – 71 4 70
66 – 68 3 67
63 - 65 3 64
60 -62 1 61
N = 30
To find midpoint simply add the lower
score and the highest score of each
class interval then divide by 2.
Do it in every class interval.
𝒙 =
𝑳𝑺 + 𝑯𝑺
𝟐
𝒙 =
𝟖𝟒 + 𝟖𝟔
𝟐
𝒙 =
𝟏𝟕𝟎
𝟐
𝒙 = 𝟖𝟓
Multiply the midpoint and the frequency of each class.
Class
interval
Frequency
(f)
Midpoint
(x) fx
84 – 86 2 85 170
81 – 83 4 82 328
78 – 80 3 79 237
75 – 77 5 77 385
72 – 74 5 73 365
69 – 71 4 70 280
66 – 68 3 67 201
63 - 65 3 64 192
60 -62 1 61 61
N = 30
𝑓𝑥 = 2219
𝑓𝑥 = 𝑓 𝑥
𝑓𝑥 = 2 85
𝑓𝑥 = 170
𝑓𝑥 = total of fx,
just add all the entry in
column of fx
Use the formula To calculate the mean from grouped data:
𝑥 =
𝑓𝑥
𝑛
Where: f=class frequency; x=class midpoint; n=sum of frequencies
Class
interval
Frequency
(f)
Midpoint
(x) fx
84 – 86 2 85 170
81 – 83 4 82 328
78 – 80 3 79 237
75 – 77 5 77 385
72 – 74 5 73 365
69 – 71 4 70 280
66 – 68 3 67 201
63 - 65 3 64 192
60 -62 1 61 61
N = 30
𝑓𝑥 = 2219
𝑥 =
𝑓𝑥
𝑛
𝑥 =
2219
30
𝑥 =73.97
Use always two decimal places

Mean of grouped data

  • 1.
    MEAN of Grouped Data By:Maryleigh P. Castillo
  • 2.
    Objectives: • Make frequencydistribution table • Compute for the Mean
  • 3.
    Steps in calculatingmean of grouped data • Make the frequency distribution table. • Find for the midpoint (x) of each class interval • Multiply the midpoint and the frequency of each class. • Use the formula To calculate the mean from grouped data: 𝑥 = 𝑓𝑥 𝑛 Where: f=class frequency; x=class midpoint; n=sum of frequencies
  • 4.
    Example: Class interval tallyfrequency 84 – 86 81 – 83 78 – 80 75 – 77 72 – 74 69 – 71 66 – 68 63 - 65 60 -62 72 75 77 67 72 67 82 76 76 70 61 67 84 69 64 78 65 86 73 81 71 63 72 72 83 78 83 80 71 75
  • 5.
    Make the frequencydistribution table. Class interval tally frequency 84 – 86 2 81 – 83 4 78 – 80 3 75 – 77 5 72 – 74 5 69 – 71 4 66 – 68 3 63 - 65 3 60 -62 1 N = 30
  • 6.
    Find for themidpoint (x) of each class interval. Class interval Frequency (f) Midpoint (x) 84 – 86 2 85 81 – 83 4 82 78 – 80 3 79 75 – 77 5 77 72 – 74 5 73 69 – 71 4 70 66 – 68 3 67 63 - 65 3 64 60 -62 1 61 N = 30 To find midpoint simply add the lower score and the highest score of each class interval then divide by 2. Do it in every class interval. 𝒙 = 𝑳𝑺 + 𝑯𝑺 𝟐 𝒙 = 𝟖𝟒 + 𝟖𝟔 𝟐 𝒙 = 𝟏𝟕𝟎 𝟐 𝒙 = 𝟖𝟓
  • 7.
    Multiply the midpointand the frequency of each class. Class interval Frequency (f) Midpoint (x) fx 84 – 86 2 85 170 81 – 83 4 82 328 78 – 80 3 79 237 75 – 77 5 77 385 72 – 74 5 73 365 69 – 71 4 70 280 66 – 68 3 67 201 63 - 65 3 64 192 60 -62 1 61 61 N = 30 𝑓𝑥 = 2219 𝑓𝑥 = 𝑓 𝑥 𝑓𝑥 = 2 85 𝑓𝑥 = 170 𝑓𝑥 = total of fx, just add all the entry in column of fx
  • 8.
    Use the formulaTo calculate the mean from grouped data: 𝑥 = 𝑓𝑥 𝑛 Where: f=class frequency; x=class midpoint; n=sum of frequencies Class interval Frequency (f) Midpoint (x) fx 84 – 86 2 85 170 81 – 83 4 82 328 78 – 80 3 79 237 75 – 77 5 77 385 72 – 74 5 73 365 69 – 71 4 70 280 66 – 68 3 67 201 63 - 65 3 64 192 60 -62 1 61 61 N = 30 𝑓𝑥 = 2219 𝑥 = 𝑓𝑥 𝑛 𝑥 = 2219 30 𝑥 =73.97 Use always two decimal places