Downloaded 422 times
![Fourier Series Example
MATLAB Code
% ***** MATLAB Code Starts Here *****
%
%FOURIER_SERIES_01_MAT
%
fig_size = [232 84 774 624];
x = [0.1 0.9 0.1]; % 1 period of x(t)
x = [x x x x]; % 4 periods of x(t)
tx = [-2 -1 0 0 1 2 2 3 4 4 5 6]; % time points for x(t)
figure(1),plot(tx,x),grid,xlabel('Time (s)'),ylabel('Amplitude'),...
title('Periodic Signal x(t)'),axis([-2 6 0 1]),...
set(gcf,'Position',fig_size)
%
a0 = 0.5; % DC component of Fourier Series
ph0 = 0;
n = [1 3 5 7 9]; % Values of n to be evaluated
an = -3.2 ./ (pi * n).^2; % Fourier Series coefficients
mag_an = abs(an);
ph_an = -180 * ones(1,length(n));
%
n = [0 n];
mag_an = [a0 mag_an]; % Including a0 with a_n
ph_an = [ph0 ph_an];
%
figure(2),clf,subplot(211),plot(n,mag_an,'o'),grid,xlabel('Harmonic
Number'),...](https://image.slidesharecdn.com/fourierseriesexample-111102130124-phpapp02/85/Fourier-series-example-1-320.jpg)
![Fourier Series Example
MATLAB Code
% ***** MATLAB Code Starts Here *****
%
%FOURIER_SERIES_01_MAT
%
fig_size = [232 84 774 624];
x = [0.1 0.9 0.1]; % 1 period of x(t)
x = [x x x x]; % 4 periods of x(t)
tx = [-2 -1 0 0 1 2 2 3 4 4 5 6]; % time points for x(t)
figure(1),plot(tx,x),grid,xlabel('Time (s)'),ylabel('Amplitude'),...
title('Periodic Signal x(t)'),axis([-2 6 0 1]),...
set(gcf,'Position',fig_size)
%
a0 = 0.5; % DC component of Fourier Series
ph0 = 0;
n = [1 3 5 7 9]; % Values of n to be evaluated
an = -3.2 ./ (pi * n).^2; % Fourier Series coefficients
mag_an = abs(an);
ph_an = -180 * ones(1,length(n));
%
n = [0 n];
mag_an = [a0 mag_an]; % Including a0 with a_n
ph_an = [ph0 ph_an];
%
figure(2),clf,subplot(211),plot(n,mag_an,'o'),grid,xlabel('Harmonic
Number'),...](https://image.slidesharecdn.com/fourierseriesexample-111102130124-phpapp02/75/Fourier-series-example-1-2048.jpg)
![ylabel('Magnitude'),title('Fourier Series Magnitude'),axis([0 10 0
0.6]),...
set(gcf,'Position',fig_size)
%
subplot(212),plot(n,ph_an,'o'),grid,xlabel('Harmonic Number'),...
ylabel('Phase (deg)'),title('Fourier Series Phase'),axis([0 10 -200 0]),...
set(gcf,'Position',fig_size)
%
w0 = pi; % Fundamental Frequency
t = [-2:0.002:6]; % time vector for approximations
%
x1 = 0; % approximation with DC + 1 term
for i = 1:2
x1 = x1 + mag_an(i)*cos(n(i)*w0*t + ph_an(i)*pi/180);
end
%
x2 = x1; % approximation with DC + 2 terms
i = 3;
x2 = x2 + mag_an(i)*cos(n(i)*w0*t + ph_an(i)*pi/180);
%
x3 = x2; % approximation with DC + 3 terms
i = 4;
x3 = x3 + mag_an(i)*cos(n(i)*w0*t + ph_an(i)*pi/180);
%
x4 = x3; % approximation with DC + 5 terms
for i = 5:6
x4 = x4 + mag_an(i)*cos(n(i)*w0*t + ph_an(i)*pi/180);
end](https://image.slidesharecdn.com/fourierseriesexample-111102130124-phpapp02/85/Fourier-series-example-2-320.jpg)
![%
figure(3),subplot(221),plot(t,x1),grid,xlabel('Time (s)'),...
ylabel('Amplitude'),title('DC + 1 Term'),axis([-2 6 0 1]),...
subplot(222),plot(t,x2),grid,xlabel('Time (s)'),...
ylabel('Amplitude'),title('DC + 2 Terms'),axis([-2 6 0 1]),...
subplot(223),plot(t,x3),grid,xlabel('Time (s)'),...
ylabel('Amplitude'),title('DC + 3 Terms'),axis([-2 6 0 1]),...
subplot(224),plot(t,x4),grid,xlabel('Time (s)'),...
ylabel('Amplitude'),title('DC + 5 Terms'),axis([-2 6 0 1]),...
set(gcf,'Position',fig_size)
%
%
% ***** MATLAB Code Stops Here *****
Fourier Series Example #2
MATLAB Code
% ***** MATLAB Code Starts Here *****
%
%FOURIER_SERIES_02_MAT
%
fig_size = [232 84 774 624];
T0 = 8;
w0 = 2*pi/8;
t = linspace(-8,16,1001);
a0 = 0.25;
n = 1:50;](https://image.slidesharecdn.com/fourierseriesexample-111102130124-phpapp02/85/Fourier-series-example-3-320.jpg)
![an = (1./(pi*n)) .* sin(n*pi/2);
bn = (1./(pi*n)) .* (1 - cos(n*pi/2));
x1 = a0;
for i = 1:10
x1 = x1 + an(i)*cos(i*w0*t) + bn(i)*sin(i*w0*t);
end
x2 = x1;
for i = 11:30
x2 = x2 + an(i)*cos(i*w0*t) + bn(i)*sin(i*w0*t);
end
x3 = x2;
for i = 31:50
x3 = x3 + an(i)*cos(i*w0*t) + bn(i)*sin(i*w0*t);
end
A0 = a0;
An = sqrt(an.^2 + bn.^2);
thn = atan2(-bn,an)*180/pi;
X0 = A0;
Xn = An/2;
figure(1),clf,plot([-8 -6],[1 1],'b-',[-6 -6],[1 0],'b--',[-6 0],[0 0],'b-
',[0 2],[1 1],'b-',[2 8],[0 0],'b-',...
[8 10],[1 1],'b-',[10 16],[0 0],'b-',[0 0],[0 1],'b--',[2 2],[1 0],'b--',[8
8],[0 1],'b--',...
[10 10],[1 0],'b--',[16 16],[0 1],'b--'),...
axis([-8 16 -.5 1.5]),plotax,xlabel('Time
(s)'),ylabel('Amplitude'),title('Periodic Pulse Train x(t)'),...
set(gcf,'Position',fig_size),text(5,-0.2,'T_0 = 8 s'),text(5,-0.3,'Pulse
width = T_0/4')
figure(2),clf,subplot(311),plot(t,x1),subplot(312),plot(t,x2),subplot(313),
plot(t,x3),...](https://image.slidesharecdn.com/fourierseriesexample-111102130124-phpapp02/85/Fourier-series-example-4-320.jpg)
![subplot(311),ylabel('Amplitude'),title('Fourier Series Representation of
x(t) with 10 Terms'),...
subplot(312),ylabel('Amplitude'),title('Fourier Series Representation of
x(t) with 30 Terms'),...
subplot(313),ylabel('Amplitude'),title('Fourier Series Representation of
x(t) with 50 Terms'),xlabel('Time (s)'),...
for i = 1:3,subplot(3,1,i),...
hold on,plot([0 2],[1 1],'r-',[2 8],[0 0],'r-',[8 10],[1 1],'r-',[10 16],[0
0],'r-',...
[0 0],[0 1],'r--',[2 2],[1 0],'r--',[8 8],[0 1],'r--',[10 10],[1 0],'r--
',[16 16],[0 1],'r--',...
[-8 -6],[1 1],'r-',[-6 -6],[1 0],'r--',[-6 0],[0 0],'r-'),hold off,...
axis([-8 16 -0.5 1.5]),plotax
end
set(gcf,'Position',fig_size)
figure(3),clf,subplot(211),plot(0,a0,'ro',n,an,'o'),axis([-5 50 -0.2
0.5]),plotax,...
hold on,plot([10.5 10.5],[-0.2 0.5],'r--',[30.5 30.5],[-0.2 0.5],'r--
'),hold off,...
xlabel('Harmonic Number'),ylabel('Amplitude'),title('Trig Fourier Series
Coefficients a_n for x(t)'),...
subplot(212),plot(n,bn,'o'),axis([-5 50 -0.05 0.35]),plotax,...
hold on,plot([10.5 10.5],[-0.05 0.35],'r--',[30.5 30.5],[-0.05 0.35],'r--
'),hold off,...
xlabel('Harmonic Number'),ylabel('Amplitude'),title('Trig Fourier Series
Coefficients b_n for x(t)'),...
set(gcf,'Position',fig_size)
figure(4),clf,subplot(211),plot(0,A0,'ro',n*w0,An,'o'),axis([-2*w0 16 -0.1
0.5]),plotax,...
xlabel('Frequency (r/s)'),ylabel('Magnitde'),title('Cosine Fourier Series
Magnitudes A_n for x(t)'),...
subplot(212),plot(n*w0,thn,'o'),v=axis;axis([-2*w0 16 -200 10]),plotax,...
xlabel('Frequency (r/s)'),ylabel('Phase (deg)'),title('Cosine Fourier
Series Phases Theta_n for x(t)'),...
set(gcf,'Position',fig_size)](https://image.slidesharecdn.com/fourierseriesexample-111102130124-phpapp02/85/Fourier-series-example-5-320.jpg)
![figure(5),clf,subplot(211),plot(0,X0,'ro',n*w0,Xn,'o',-n*w0,Xn,'o'),axis([-
16 16 -0.1 0.3]),plotax,...
xlabel('Frequency (r/s)'),ylabel('Magnitde'),title('Exponential Fourier
Series Magnitudes X_n for x(t)'),...
subplot(212),plot(n*w0,thn,'o',-n*w0,-thn,'o'),v=axis;axis([-16 16
v(3:4)]),plotax,...
xlabel('Frequency (r/s)'),ylabel('Phase (deg)'),title('Exponential Fourier
Series Phases Theta_n for x(t)'),...
set(gcf,'Position',fig_size)
clear i v
%
Technical discussion about Matlab and issues related to Digital Signal Processing.
Your Email Here Join this Group!
Post a new Thread
fourier series coefficients - Kurt - Dec 1 12:27:01 2009
hello all,
I have a one period square wave on the interval[0,2] defined as:
y(t)= 1, 0<=t<1
y(t)= 0, 1<=t<2
I need to find the fourier series coefficients,ck, with
k=-10,-9,...,9,10](https://image.slidesharecdn.com/fourierseriesexample-111102130124-phpapp02/85/Fourier-series-example-6-320.jpg)
![I heard using a for loop would work but I am completely stuck on how to
move
through this problem.
All help is greatly appreciated,
Kurt
______________________________
New Code Sharing Section now Live on DSPRelated.com. Learn about the Reward Program for
Contributors here.
(You need to be a member of matlab -- send a blank email to matlab-subscribe@yahoogroups.com )
Re: fourier series coefficients - vishwa - Dec 3 7:52:08 2009
you can try
for k=-10:1:10
c(k+11) = here you enter the Ck equation; % you cant have negative indexing
in
MATLAB
end
Now
c gives you the coefficients
rgds
vishwanath
________________________________
From: Kurt <k...@sbcglobal.net>
To: m...@yahoogroups.com
Sent: Tue, 1 December, 2009 12:50:19 PM
Subject: [matlab] fourier series coefficients
Â
hello all,
I have a one period square wave on the interval[0,2] defined as:
y(t)= 1, 0<=t<1
y(t)= 0, 1<=t<2
I need to find the fourier series coefficients, ck, with
k=-10,-9,... ,9,10
I heard using a for loop would work but I am completely stuck on how to
move
through this problem.
All help is greatly appreciated,
Kurt
______________________________
New Code Sharing Section now Live on DSPRelated.com. Learn about the Reward Program for
Contributors here.
(You need to be a member of matlab -- send a blank email to matlab-subscribe@yahoogroups.com )
Re: fourier series coefficients - Vaibhav Singh - Dec 4 7:44:25 2009](https://image.slidesharecdn.com/fourierseriesexample-111102130124-phpapp02/85/Fourier-series-example-7-320.jpg)
![Hey..
For fourier coeff u have to find the fft of the given sequence using
matlab.
Since u have to find the coeff for kranging from -10:1:10, i.e.21 points u
have to define ur function in time domain in 21 samples. Take the fft of
these 21 samples. The resultant is your desired fourier coeff .
Regards-vaibhav
On Thu, Dec 3, 2009 at 5:01 PM, vishwa <v...@yahoo.com> wrote:
> you can try
>
> for k=-10:1:10
> c(k+11) = here you enter the Ck equation; % you cant have negative
indexing
> in MATLAB
> end
>
> Now
>
> c gives you the coefficients
>
> rgds
> vishwanath
>
> ________________________________
> From: Kurt <k...@sbcglobal.net <keg1606%40sbcglobal.net>>
> To: m...@yahoogroups.com <matlab%40yahoogroups.com>
> Sent: Tue, 1 December, 2009 12:50:19 PM
> Subject: [matlab] fourier series coefficients
>
> hello all,
> I have a one period square wave on the interval[0,2] defined as:
> y(t)= 1, 0<=t<1
> y(t)= 0, 1<=t<2
> I need to find the fourier series coefficients, ck, with
> k=-10,-9,... ,9,10
> I heard using a for loop would work but I am completely stuck on how to
> move through this problem.
> All help is greatly appreciated,
> Kurt
>
>
>
--
Vaibhav Singh
BE(Hons.) Electronics And Instrumentation
BITS-Pilani](https://image.slidesharecdn.com/fourierseriesexample-111102130124-phpapp02/85/Fourier-series-example-8-320.jpg)
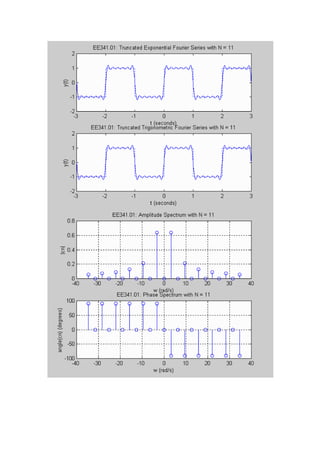
![EE341.01: MATLAB M-FILE FOR PLOTTING TRUNCATED FOURIER SERIES AND ITS SPECTRA
MATLAB M-File example6.m:
%
% Filename: example6.m
%
% Description: This M-file plots the truncated Fourier Series
% representation of a square wave as well as its
% amplitude and phase spectrum.
clear; % clear all variables
clf; % clear all figures
N = 11; % summation limit (use N odd)
wo = pi; % fundamental frequency (rad/s)
c0 = 0; % dc bias
t = -3:0.01:3; % declare time values
figure(1) % put first two plots on figure 1
% Compute yce, the Fourier Series in complex exponential form
yce = c0*ones(size(t)); % initialize yce to c0
for n = -N:2:N, % loop over series index n (odd)
cn = 2/(j*n*wo); % Fourier Series Coefficient
yce = yce + real(cn*exp(j*n*wo*t)); % Fourier Series computation
end
subplot(2,1,1)
plot([-3 -2 -2 -1 -1 0 0 1 1 2 2 3],... % plot original y(t)
[-1 -1 1 1 -1 -1 1 1 -1 -1 1 1], ':');
hold;
plot(t,yce); % plot truncated exponential FS
xlabel('t (seconds)'); ylabel('y(t)');
ttle = ['EE341.01: Truncated Exponential Fourier Series with N = ',...
num2str(N)];
title(ttle);
hold;
% Compute yt, the Fourier Series in trigonometric form
yt = c0*ones(size(t)); % initialize yt to c0
for n = 1:2:N, % loop over series index n (odd)
cn = 2/(j*n*wo); % Fourier Series Coefficient
yt = yt + 2*abs(cn)*cos(n*wo*t+angle(cn)); % Fourier Series computation
end
subplot(2,1,2)
plot([-3 -2 -2 -1 -1 0 0 1 1 2 2 3],... % plot original y(t)
[-1 -1 1 1 -1 -1 1 1 -1 -1 1 1], ':');
hold; % plot truncated trigonometric FS
plot(t,yt);
xlabel('t (seconds)'); ylabel('y(t)');
ttle = ['EE341.01: Truncated Trigonometric Fourier Series with N = ',...
num2str(N)];
title(ttle);
hold;
% Draw the amplitude spectrum from exponential Fourier Series](https://image.slidesharecdn.com/fourierseriesexample-111102130124-phpapp02/85/Fourier-series-example-9-320.jpg)
![figure(2) % put next plots on figure 2
subplot(2,1,1)
stem(0,c0); % plot c0 at nwo = 0
hold;
for n = -N:2:N, % loop over series index n
cn = 2/(j*n*wo); % Fourier Series Coefficient
stem(n*wo,abs(cn)) % plot |cn| vs nwo
end
for n = -N+1:2:N-1, % loop over even series index n
cn = 0; % Fourier Series Coefficient
stem(n*wo,abs(cn)); % plot |cn| vs nwo
end
xlabel('w (rad/s)')
ylabel('|cn|')
ttle = ['EE341.01: Amplitude Spectrum with N = ',num2str(N)];
title(ttle);
grid;
hold;
% Draw the phase spectrum from exponential Fourier Series
subplot(2,1,2)
stem(0,angle(c0)*180/pi); % plot angle of c0 at nwo = 0
hold;
for n = -N:2:N, % loop over odd series index n
cn = 2/(j*n*wo); % Fourier Series Coefficient
stem(n*wo,angle(cn)*180/pi); % plot |cn| vs nwo
end
for n = -N+1:2:N-1, % loop over even series index n
cn = 0; % Fourier Series Coefficient
stem(n*wo,angle(cn)*180/pi); % plot |cn| vs nwo
end
xlabel('w (rad/s)')
ylabel('angle(cn) (degrees)')
ttle = ['EE341.01: Phase Spectrum with N = ',num2str(N)];
title(ttle);
grid;
hold;
MATLAB Plots Generated:](https://image.slidesharecdn.com/fourierseriesexample-111102130124-phpapp02/85/Fourier-series-example-10-320.jpg)
![Hi,
I am trying to write a function to generate Fourier series Coefficients of a given discrete time signal. For instance:
x = [1 2 3 4]
n = [0 1 2 3]
where x holds the values of the signal, and n holds the corresponding time indices.
My code for the function is:
function a = dtfs(x,n)
period = length(x);
for k = 1:period
a = (1/period)*x(k)*exp(((-j*2*pi)/period)*n(k));
a
end
i am just not getting the correct values for the fourier series coefficients. Am I setting up the formula wrong?
As you can probably tell, i am very very new to MATLAB and I'd also appreciate if someone may guide me in setting up my "for-
loop" with a vector to "catch" and store values of "a", so each time the for-loop repeats, the previous value a does not get over-
written, instead they are all stored in a vector.
Thanks in advance :)
Regards
Subject: Fourier Series Coefficients
From: Andrew
Date: 24 Oct, 2008 04:43:01
Message: 2 of 4
Reply to this message
Add author to My Watch List
View original format
Flag as spam
I'm guessing the formula, but hopefully the structure of it will help...
function a = dtfs(x,n)
period = length(x);
a = zeros(1, length(x))
for k = 1:period
for z = 1:period
a(k) = a(k) + x(z) * exp((-j*2*pi)/period * (k-1) * n(z));
end
a(k) = a(k) / period;
num2str(a(k), '%1.18f');
end](https://image.slidesharecdn.com/fourierseriesexample-111102130124-phpapp02/85/Fourier-series-example-12-320.jpg)
![Cheers,
Andrew
> a = (1/period)*x(k)*exp(((-j*2*pi)/period)*n(k));
>a
> end
"Raz H" <dilster08@gmail.com> wrote in message <gdrclp$t9b$1@fred.mathworks.com>...
> Hi,
>
> I am trying to write a function to generate Fourier series Coefficients of a given discrete time signal. For instance:
>
> x = [1 2 3 4]
> n = [0 1 2 3]
>
> where x holds the values of the signal, and n holds the corresponding time indices.
>
> My code for the function is:
>
> function a = dtfs(x,n)
> period = length(x);
> for k = 1:period
> a = (1/period)*x(k)*exp(((-j*2*pi)/period)*n(k));
>a
> end
>
> i am just not getting the correct values for the fourier series coefficients. Am I setting up the formula wrong?
>
> As you can probably tell, i am very very new to MATLAB and I'd also appreciate if someone may guide me in setting up my
"for-loop" with a vector to "catch" and store values of "a", so each time the for-loop repeats, the previous value a does not get
over-written, instead they are all stored in a vector.
>
> Thanks in advance :)
>
> Regards
Subject: Fourier Series Coefficients
From: Paul
Date: 24 Oct, 2008 06:35:05
Message: 3 of 4
Reply to this message
Add author to My Watch List
View original format
Flag as spam](https://image.slidesharecdn.com/fourierseriesexample-111102130124-phpapp02/85/Fourier-series-example-13-320.jpg)
!["Andrew" <awbsmith@itee.uq.edu.au> wrote in message <gdrjol$so$1@fred.mathworks.com>...
> I'm guessing the formula, but hopefully the structure of it will help...
>
> function a = dtfs(x,n)
> period = length(x);
> a = zeros(1, length(x))
> for k = 1:period
> for z = 1:period
> a(k) = a(k) + x(z) * exp((-j*2*pi)/period * (k-1) * n(z));
> end
> a(k) = a(k) / period;
> num2str(a(k), '%1.18f');
> end
>
> Cheers,
> Andrew
>
>
> > a = (1/period)*x(k)*exp(((-j*2*pi)/period)*n(k));
>>a
> > end
>
>
>
>
> "Raz H" <dilster08@gmail.com> wrote in message <gdrclp$t9b$1@fred.mathworks.com>...
> > Hi,
>>
> > I am trying to write a function to generate Fourier series Coefficients of a given discrete time signal. For instance:
>>
> > x = [1 2 3 4]
> > n = [0 1 2 3]
>>
> > where x holds the values of the signal, and n holds the corresponding time indices.
>>
> > My code for the function is:
>>
> > function a = dtfs(x,n)
> > period = length(x);
> > for k = 1:period
> > a = (1/period)*x(k)*exp(((-j*2*pi)/period)*n(k));
>>a
> > end
>>
> > i am just not getting the correct values for the fourier series coefficients. Am I setting up the formula wrong?
>>
> > As you can probably tell, i am very very new to MATLAB and I'd also appreciate if someone may guide me in setting up my
"for-loop" with a vector to "catch" and store values of "a", so each time the for-loop repeats, the previous value a does not get
over-written, instead they are all stored in a vector.
>>
> > Thanks in advance :)
>>
> > Regards](https://image.slidesharecdn.com/fourierseriesexample-111102130124-phpapp02/85/Fourier-series-example-14-320.jpg)
![Was this a HW problem? It looks like one to me!
Subject: Fourier Series Coefficients
From: Raz H
Date: 24 Oct, 2008 06:54:02
Message: 4 of 4
Reply to this message
Add author to My Watch List
View original format
Flag as spam
"Paul" <par@ceri.memphis.edu> wrote in message <gdrqap$sl5$1@fred.mathworks.com>...
> "Andrew" <awbsmith@itee.uq.edu.au> wrote in message <gdrjol$so$1@fred.mathworks.com>...
> > I'm guessing the formula, but hopefully the structure of it will help...
>>
> > function a = dtfs(x,n)
> > period = length(x);
> > a = zeros(1, length(x))
> > for k = 1:period
> > for z = 1:period
> > a(k) = a(k) + x(z) * exp((-j*2*pi)/period * (k-1) * n(z));
> > end
> > a(k) = a(k) / period;
> > num2str(a(k), '%1.18f');
> > end
>>
> > Cheers,
> > Andrew
>>
>>
> > > a = (1/period)*x(k)*exp(((-j*2*pi)/period)*n(k));
>>>a
> > > end
>>
>>
>>
>>
> > "Raz H" <dilster08@gmail.com> wrote in message <gdrclp$t9b$1@fred.mathworks.com>...
> > > Hi,
>>>
> > > I am trying to write a function to generate Fourier series Coefficients of a given discrete time signal. For instance:
>>>
> > > x = [1 2 3 4]
> > > n = [0 1 2 3]
>>>
> > > where x holds the values of the signal, and n holds the corresponding time indices.
>>>
> > > My code for the function is:](https://image.slidesharecdn.com/fourierseriesexample-111102130124-phpapp02/85/Fourier-series-example-15-320.jpg)
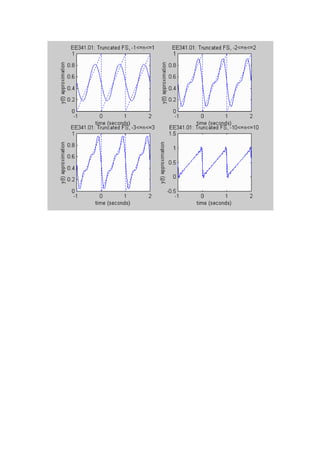
![% Define parameters to plot original sawtooth
tr = [-1 0 0 1 1 2 2];
yr = [0 1 0 1 0 1 0];
% Plot Truncated Fourier Series Approximation (N = 1)
N = 1; % define number of terms to use (n = -N..N)
c0 = 0.5; % define dc bias coefficient
t = -1:0.001:2; % define time values for y(t)
y = c0 * ones(size(t)); % let initial y = c0 (dc bias) for all times
for n = -N:-1, % compute y for negative n
cn = exp(j*pi/2)/(2*pi*n);
y = y + real(cn * exp(j*n*2*pi*t));
end;
% compute y for positive n and add to y
for n = 1:N, % found using negative n
cn = exp(j*pi/2)/(2*pi*n);
y = y + real(cn * exp(j*n*2*pi*t));
end;
subplot(2,2,1); % plot approximation
plot(t,y);
hold;
plot(tr,yr,':');
hold;
xlabel('time (seconds)');
ylabel('y(t) approximation');
title('EE341.01: Truncated FS, -1<=n<=1');
% Plot Truncated Fourier Series Approximation (N = 2)
clear; % clear all variables
N = 2; % define number of terms to use (n = -N..N)
c0 = 0.5; % define dc bias coefficient
t = -1:0.001:2; % define time values for y(t)
y = c0 * ones(size(t)); % let initial y = c0 (dc bias) for all times
for n = -N:-1, % compute y for negative n
cn = exp(j*pi/2)/(2*pi*n);
y = y + real(cn * exp(j*n*2*pi*t));
end;
% compute y for positive n and add to y
for n = 1:N, % found using negative n
cn = exp(j*pi/2)/(2*pi*n);
y = y + real(cn * exp(j*n*2*pi*t));
end;
subplot(2,2,2); % plot approximation
plot(t,y);
hold;
plot(tr,yr,':');
hold;
xlabel('time (seconds)');
ylabel('y(t) approximation');
title('EE341.01: Truncated FS, -2<=n<=2');
% Plot Truncated Fourier Series Approximation (N = 3)
clear; % clear all variables](https://image.slidesharecdn.com/fourierseriesexample-111102130124-phpapp02/85/Fourier-series-example-17-320.jpg)


This MATLAB code provides an example of plotting a truncated Fourier series representation of a square wave signal. It computes the Fourier series in both complex exponential form (yce) and trigonometric form (yt) up to the Nth term, where N is an odd integer. It plots the original square wave, the truncated Fourier series approximations yce and yt, and their amplitude and phase spectra. The code demonstrates how to calculate and visualize truncated Fourier series representations of a periodic signal.