SAMPLE QUESTIONExercise 1 Consider the functionf (x,C).docx
Mat lab
1. MATLAB
Sarvjeet Singh SohalRegd.No.: 1269922
Experiment No. 1
AIM: To plotting two dimensional plots using MATLAB.
SOFTWARE: MATLAB 7
THEORY: MATLAB can produce two-dimensional plots. The primary command for this is
plot.
The plot command creates linear x–y plots; if x and y are vectors of the same length, the
command plot(x,y) opens a graphics window and draws an x–y plot of the elements of y
versus the elements of x.
The graphs can be given titles, axes labeled, and text placed within the graph with the
following commands, which take a string as an argument.
title : graph title
xlabel : x-axis label
ylabel : y-axis label
gtext :place text on graph using the mouse
text :position text at specified coordinates
The command subplot(m,n,p) partitions a single figure into an m-by-n array of panes, and
makes pane p the current plot. The panes are numbered left to right. A subplot can span +
We can draw multiple plots using MATLAB and can assign Line types, marker types, colors
etc to graph.
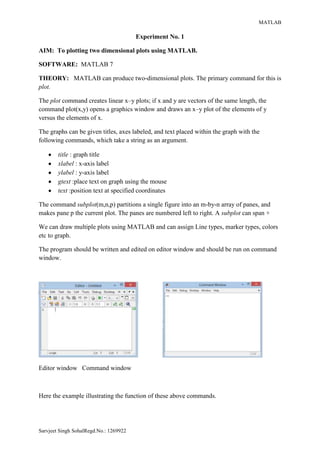
The program should be written and edited on editor window and should be run on command
window.
Editor window Command window
Here the example illustrating the function of these above commands.
2. MATLAB
Sarvjeet Singh SohalRegd.No.: 1269922
PROGRAM:
To plot y = sin (x):
x = (0:.01:2*pi)';
y = [sin(x)];
plot(x, y);
xlabel('X Label');
ylabel('Y Label')
title(' Plot of y = Sin(x)')
This program will display output on graphics window as:
To draw multiple plots on same graph we use commands as:
x = 0:.01:2*pi;
y1 = sin(x) ;
y2 = sin(2*x) ;
y3 = sin(4*x) ;
plot(x, y1, x, y2, x, y3)
And then the output will be:
0 1 2 3 4 5 6 7
-1
-0.8
-0.6
-0.4
-0.2
0
0.2
0.4
0.6
0.8
1
X Label
YLabel
Plot of y = Sin(x)
0 1 2 3 4 5 6 7
-1
-0.8
-0.6
-0.4
-0.2
0
0.2
0.4
0.6
0.8
1
X Label
YLabel
Plot of y = Sin(x)
3. MATLAB
Sarvjeet Singh SohalRegd.No.: 1269922
We can override the default line types, marker types, and colors as:
x = 0:.01:2*pi ;
y1 = sin(x) ;
y2 = sin(2*x) ;
y3 = sin(4*x) ;
plot(x,y1, '--', x,y2, ':', x,y3, 'o')
xlabel('X Label');
ylabel('Y Label')
title(' Plot of y = Sin(x)')
This renders a dashed line and dotted line for the first two graphs, whereas for the third the
symbol o is placed at each node. Similarly Colors can be specified for the line and marker
types.
The output will be:
Now we can put text in graph using gtextcommand as:
x = 0:.01:2*pi ;
y1 = sin(x) ;
y2 = sin(2*x) ;
y3 = sin(4*x) ;
plot(x,y1, '--', x,y2, ':', x,y3, 'o')
xlabel('X Label');
ylabel('Y Label');
title(' Plot of y = Sin(x)');
gtext ('y1=sin(x)');
gtext ('y2=sin(2*x)');
gtext ('y3=sin(4*x)');
This displays output as:
0 1 2 3 4 5 6 7
-1
-0.8
-0.6
-0.4
-0.2
0
0.2
0.4
0.6
0.8
1
X Label
YLabel
Plot of y = Sin(x)
0 1 2 3 4 5 6 7
-1
-0.8
-0.6
-0.4
-0.2
0
0.2
0.4
0.6
0.8
1
X Label
YLabel
Plot of y = Sin(x)
y1=sin(x)
y2=sin(2*x)
y3=sin(4*x)
4. MATLAB
Sarvjeet Singh SohalRegd.No.: 1269922
To draw same graph separately using subplots we have use commands as:
x = 0:.01:2*pi ;
y1 = sin(x) ;
y2 = sin(2*x) ;
y3 = sin(4*x) ;
subplot(2,2,1)
plot(x,y1, '--')
xlabel('X Label');
ylabel('Y Label');
title(' Plot of y1 = Sin(x)');
gtext ('y1=sin(x)');
subplot(2,2,2)
plot(x,y2, ':')
xlabel('X Label');
ylabel('Y Label');
title(' Plot of y2 = Sin(x)');
gtext ('y2=sin(2*x)');
subplot(2,2,[3 4])
plot(x,y3, 'o')
xlabel('X Label');
ylabel('Y Label');
title(' Plot of y3 = Sin(x)');
gtext ('y3=sin(4*x)');
Then the output is:
0 2 4 6 8
-1
-0.5
0
0.5
1
X Label
YLabel
Plot of y1 = Sin(x)
y1=sin(x)
0 2 4 6 8
-1
-0.5
0
0.5
1
X Label
YLabel
Plot of y2 = Sin(x)
y2=sin(2*x)
0 1 2 3 4 5 6 7
-1
-0.5
0
0.5
1
X Label
YLabel
Plot of y3 = Sin(x)
y3=sin(4*x)
5. MATLAB
Sarvjeet Singh SohalRegd.No.: 1269922
Experiment No. 2
AIM: To plotting three dimensional plots using MATLAB.
SOFTWARE: MATLAB 7
THEORY: MATLAB can also produce three-dimensional plots. The primary command for
this is plot3.
The command plot3 produces curves in three-dimensional space. If x, y, and z are three
vectors of the same size, then the command plot3(x,y,z) produces a perspective plot of the
piecewise linear curve in three space passing through the points whose coordinates are the
respective elements of x, y, and z.
PROGRAM:
To Plot 3D plot between XYZ:
t = .01:.01:20*pi ;
x = cos(t) ;
y = sin(t) ;
z = t.^3 ;
plot3(x, y, z);
xlabel('X Label');
ylabel('Y Label');
zlabel('Z Label');
title(' 3D plot for xyz');
This gives output as:
-1
-0.5
0
0.5
1
-1
-0.5
0
0.5
1
0
0.5
1
1.5
2
2.5
x 10
5
X Label
3D plot for xyz
Y Label
ZLabel
6. MATLAB
Sarvjeet Singh SohalRegd.No.: 1269922
And for following program:
t = .01:.01:20*pi ;
x = cos(t) ;
y = sin(t) ;
z = t.^3 ;
plot3(x, y, z, 'g+');
xlabel('X Label');
ylabel('Y Label');
zlabel('Z Label');
title(' 3D plot for xyz');
The output will be:
-1
-0.5
0
0.5
1
-1
-0.5
0
0.5
1
0
0.5
1
1.5
2
2.5
x 10
5
X Label
3D plot for xyz
Y Label
ZLabel
7. MATLAB
Sarvjeet Singh SohalRegd.No.: 1269922
Experiment No. 3
AIM: To generatedifferent types of signals used in signal processing using MATLAB.
SOFTWARE: MATLAB 7
THEORY:In signal processing following signal sequences are used:
unit impulse,
unit step,
ramp,
exponential,
sinusoidal
and cosine sequences
The generations of these above sequences using MATLAB are as follows. In MATLAB to
plot any discrete sequence the basic command is stem.
PROGRAM:
1. Program for the generation of unit impulse signal:
t=-2:1:2;
y=[zeros(1,2),ones(1,1),zeros(1,2)];
subplot(2,2,1);
stem(t,y);
ylabel('Amplitude --->');
xlabel('(a)n --->');
title('Unit Impulse Signal');
2. Program for the generation of unit step sequences:
n=7;
t=0:1:n-1;
y1=ones(1,n);
subplot(2,2,2);
stem(t,y1);
ylabel('Amplitude --->');
xlabel('(b) n --->');
title('Unit Step Sequence');
8. MATLAB
Sarvjeet Singh SohalRegd.No.: 1269922
3. Program for the generation of ramp sequences:
n1=7;
t=0:1:n1;
subplot(2,2,3);
stem(t,t);
ylabel('Amplitude --->');
xlabel('(c) n --->');
title('Ramp Sequence');
4. Program for the generation exponential sequences:
n2=5;
t=0:1:n2;
y2=exp(t);
subplot(2,2,4);
stem(t,y2);
ylabel('Amplitude --->');
xlabel('(d) n --->');
title('Exponential Sequence');
5. Program for the generation sine sequences:
t=0:.01:pi;
y=sin(2*pi*t);
figure (2);
subplot(2,1,1);
plot(t,y);
ylabel('Amplitude --->');
xlabel('(a) n --->');
title('Sine Sequence');
6. Program for the generation cosine sequences:
t=0:.01:pi;
y=cos(2*pi*t);
figure (2);
subplot(2,1,2);
plot(t,y);
ylabel('Amplitude --->');
xlabel('(b) n --->');
title('Cosine Sequence');
9. MATLAB
Sarvjeet Singh SohalRegd.No.: 1269922
Output for all these sequences are as shown by graphics window:
-2 -1 0 1 2
0
0.5
1
Amplitude--->
(a) n --->
Unit Impulse Signal
0 2 4 6
0
0.5
1
Amplitude--->
(b) n --->
Unit Step Sequence
0 2 4 6 8
0
2
4
6
8
Amplitude--->
(c) n --->
Ramp Sequence
0 2 4 6
0
50
100
150
Amplitude--->
(d) n --->
Exponential Sequence
0 0.5 1 1.5 2 2.5 3 3.5
-1
-0.5
0
0.5
1
Amplitude--->
(b) n --->
Cosine Sequence
0 0.5 1 1.5 2 2.5 3 3.5
-1
-0.5
0
0.5
1
Amplitude--->
(a) n --->
Sine Sequence
10. MATLAB
Sarvjeet Singh SohalRegd.No.: 1269922
Experiment No. 4
AIM: To study the comparison between discrete and continuous ramp signal using
MATLAB.
SOFTWARE: MATLAB 7.
THEORY:
A unit ramp signal can be defined as a continuous time or discrete time signal.
A continuous time ramp signal is denoted by R (t) and it increases linearly with time.
Mathematically it is expressed as,
R (t) = {1 for t≥0
0 for t<0};
A discrete time ramp is denoted by Ur (n). Its value increases linearly with sample number n
and is given as,
Ur (n) = {1 for n≤0
0 for n>0};
1
PROGRAM:
n=8;
x = [0:n];
y = [2*x];
subplot (2,1,1);
stem (x,y);
xlabel('(a) n samples--->')
ylabel('Amplitude --->')
title ('Discrete Ramp Signal')
subplot (2,1,2)
x=[0:n];
y=[2*x];
plot (x,y)
xlabel('(b) time --->')
ylabel('Amplitude --->')
title ('Continuous Ramp Signal')
11. MATLAB
Sarvjeet Singh SohalRegd.No.: 1269922
The output of above program is:
0 1 2 3 4 5 6 7 8
0
5
10
15
20
(a) n samples--->
Amplitude--->
Discrete Ramp Signal
0 1 2 3 4 5 6 7 8
0
5
10
15
20
(b) time --->
Amplitude--->
Continuous Ramp Signal
12. MATLAB
Sarvjeet Singh SohalRegd.No.: 1269922
Experiment No. 5
AIM: Write a program for computing the linear convolution of two discrete sequences
using MATLAB.
SOFTWARE: MATLAB 7.
THEORY:
Convolution is defined as the mathematical operation to correlate two sequences and it gives
the response of LT system as a function of input sequence x(n) and unit impulse sequence
h(n).
Let two signals be x(n)and h(n)
Then their convolution is given by
The convolution of two sequences can be computed using MATLAB which is illustrated as
below.
PROGRAM:
Program for linear convolution of the sequence x= [1, 2] and h= [1, 2, 4].
x=[1 2];
h=[1 2 4];
y=conv(x,h);
subplot(3,1,1);
stem(x);
ylabel('Amplitude --->');
xlabel('(a) n --->');
title(' x Input');
subplot(3,1,2);
stem(h);
ylabel('Amplitude --->');
xlabel('(b) n --->');
title(' h Input');
subplot(3,1,3);
stem(y);
ylabel('Amplitude --->');
xlabel('(c) n --->');
title(' Y Output(convolution of x and h');
13. MATLAB
Sarvjeet Singh SohalRegd.No.: 1269922
The output of this program is:
1 1.1 1.2 1.3 1.4 1.5 1.6 1.7 1.8 1.9 2
0
1
2
Amplitude--->
(a) n --->
x Input
1 1.2 1.4 1.6 1.8 2 2.2 2.4 2.6 2.8 3
0
2
4
Amplitude--->
(b) n --->
h Input
1 1.5 2 2.5 3 3.5 4
0
5
10
Amplitude--->
(c) n --->
Y Output(convolution of x and h)
14. MATLAB
Sarvjeet Singh SohalRegd.No.: 1269922
Experiment No. 6
AIM: Write a program that illustrates folding of sequence using MATLAB.
SOFTWARE: MATLAB 7.
THEORY:
In the folding operation each sample of x(n) sequence is flipped around n = 0 to obtain
folded sequence y(n)
This is expressed as:
Folding of signal is also called time reversal.
PROGRAM:
Program for folding the input sequence X= [1 2 3 4 5]
t=-2:1:2;
x=[1 2 3 4 5];
subplot(2,1,1);
stem(t,x);
title('input signal');
ylabel('ampli---->');
xlabel('n--->');
t1=t.*-1;
subplot(2,1,2);
stem(t1,x);
title('folded signal');
ylabel('ampli--->');
xlabel('n---->');
Output of this program is:
-2 -1.5 -1 -0.5 0 0.5 1 1.5 2
0
2
4
6
input signal
ampli---->
n--->
-2 -1.5 -1 -0.5 0 0.5 1 1.5 2
0
2
4
6
folded signal
ampli--->
n---->
15. MATLAB
Sarvjeet Singh SohalRegd.No.: 1269922
Experiment No. 7
AIM: Write a program that illustrates time shifting of sequence using MATLAB.
SOFTWARE: MATLAB 7.
THEORY:
In the shifting operation each sample of x(n) is shifted by an amount of k to obtain a shifted
sequence y(n)
Here the y(n) is expressed as:
The time shifting operation is carried out in MATLAB is as following.
PROGRAM:
Program for shifting the input sequence:
t=-2:1:2;
x=[1 2 3 4 5];
subplot(2,1,1);
stem(t,x);
title('input sgnal');
ylabel('ampli--->');
xlabel('n---->');
n=2;
t1=t+n;
subplot(2,1,2);
stem(t1,x);
title('shifting');
ylabel('ampli---->');
xlabel('n----->');
Output Window Shows:
-2 -1.5 -1 -0.5 0 0.5 1 1.5 2
0
1
2
3
4
5
input sgnal
ampli--->
n---->
0 0.5 1 1.5 2 2.5 3 3.5 4
0
2
4
6
shifting
ampli---->
n----->
16. MATLAB
Sarvjeet Singh SohalRegd.No.: 1269922
Experiment No. 8
AIM: To study basic commands for image processing in MATLAB.
SOFTWARE: MATLAB 7.
THEORY:The purpose of this experiment is for us to understand some fundamental
concepts of image processing using MATLAB. In this, we will learn some basic MATLAB
commands for image processing.
When working with images in Matlab, there are many things to keep in mind such as loading
an image, using the right format, saving the data as different data types, how to display an
image, conversion between different image formats, etc.
Reading and Writing an image in MATLAB:
Operation command
Reading the image imread( ‘’ )
Writing the image Inwrite( , )
Saving and loading an image:
Operation command
saving the image Save X variable
loading the image Load X variable
Displaying an image:
Operation command
Displaying an image imshow(X)
Displaying an image as matrix X imagesc(X)
Zoom in (using the left and right
mouse button).
Zoom in
Turn off the zoom function. Zoom off
Various commands provide information about a variable image.
size(p)
whos(p)
The figure command can be used to create a new current figure for the display:
figure, imshow(p);
The command iminfocan be used to retrieve information about image files:
iminfo('filename')
17. MATLAB
Sarvjeet Singh SohalRegd.No.: 1269922
The example illustrating all these above commands is explained in next part of this
experiment.
PRAGRAM:
Here the program for all basic commands mentioned in this section over the image named
cell.png at location c:cell.png
P=imread('c:cell.png');
save P;
clc;
after this command everything is clears from command window
load P;
imshow(P);
Output after these commands is:
whos;
Name Size Bytes Class Attributes
P 512x512x3 786432 uint8
Now for reducing the image
i=1:256;
j=1:256;
Pred(i,j)=P(i,j);
whos;
Name Size Bytes Class Attributes
P 512x512x3 786432 uint8
Pred 256x256 65536 uint8
i 1x256 2048 double
j 1x256 2048 double
18. MATLAB
Sarvjeet Singh SohalRegd.No.: 1269922
imshow(Pred);
The reduced image is:
Convert between double and uint8
Q=im2double(P);
whos;
Name Size Bytes Class Attributes
P 512x512x3 786432 uint8
Pred 256x256 65536 uint8
Q 512x512x3 6291456 double
i 1x256 2048 double
j 1x256 2048 double
19. MATLAB
Sarvjeet Singh SohalRegd.No.: 1269922
Experiment No. 9
AIM: Write a MATLAB program to corrupt the image with impulse noise and also study
the image format conversion and image histogram.
SOFTWARE: MATLAB 7.
THEORY:
Image processing involves changing the nature of an image in order to either
Improve its pictorial information for human interpretation.
Render it more suitable for machine perception.
Image histogram:
An image histogram is a chart that shows the distribution of intensities in an image.Each
color level is represented as a point on x-axis and on y-axis is the number instance a color
level repeats in the image.
Histogram may be view with imhist command.
To balance the brightness level, we carry out an image processing operation termed
histogram equalization. Command for image equalization is histeq().
The image can corrupted using the command imnoise. The noise is added to the image using
this command.
Image format conversion:
The following table shows how to convert between the different formats:
22. MATLAB
Sarvjeet Singh SohalRegd.No.: 1269922
Experiment No. 9
AIM: To develop program for designing IIR filter.
APPARATUS: PC having MATLAB software.
PROGRAM:
%prog for designing of FIR low pass
% filters using rectangular window
clc;clearall;closeall;
rp =input('Enter the pass band ripple ');
rs =input('Enter the stop band ripple ');
fp =input('Enter the pass band freq ');
fs =input('Enter the stop band freq ');
f =input('Enter the sampling freq ');
wp = 2*fp/f;
ws = 2*fs/f;
num = -20*log10(sqrt(rp*rs))-13;
dem = 14.6*(fs-fp)/f;
n = ceil(num/dem);
n1 = n+1;
if (rem(n,2)~=0)
n1 =n;
n = n-1;
end
y = boxcar(n1);
% low pass filter
b = fir1(n,wp,y);
[h,o] = freqz(b,1,256);
m = 20*log(abs(h));
subplot(2,2,1);plot(o/pi,m);
ylabel('Gain in dB ------>');
xlabel('(a) Normalised freq ---->');

![MATLAB
Sarvjeet Singh SohalRegd.No.: 1269922
PROGRAM:
To plot y = sin (x):
x = (0:.01:2*pi)';
y = [sin(x)];
plot(x, y);
xlabel('X Label');
ylabel('Y Label')
title(' Plot of y = Sin(x)')
This program will display output on graphics window as:
To draw multiple plots on same graph we use commands as:
x = 0:.01:2*pi;
y1 = sin(x) ;
y2 = sin(2*x) ;
y3 = sin(4*x) ;
plot(x, y1, x, y2, x, y3)
And then the output will be:
0 1 2 3 4 5 6 7
-1
-0.8
-0.6
-0.4
-0.2
0
0.2
0.4
0.6
0.8
1
X Label
YLabel
Plot of y = Sin(x)
0 1 2 3 4 5 6 7
-1
-0.8
-0.6
-0.4
-0.2
0
0.2
0.4
0.6
0.8
1
X Label
YLabel
Plot of y = Sin(x)](data:image/gif;base64,R0lGODlhAQABAIAAAAAAAP///yH5BAEAAAAALAAAAAABAAEAAAIBRAA7)