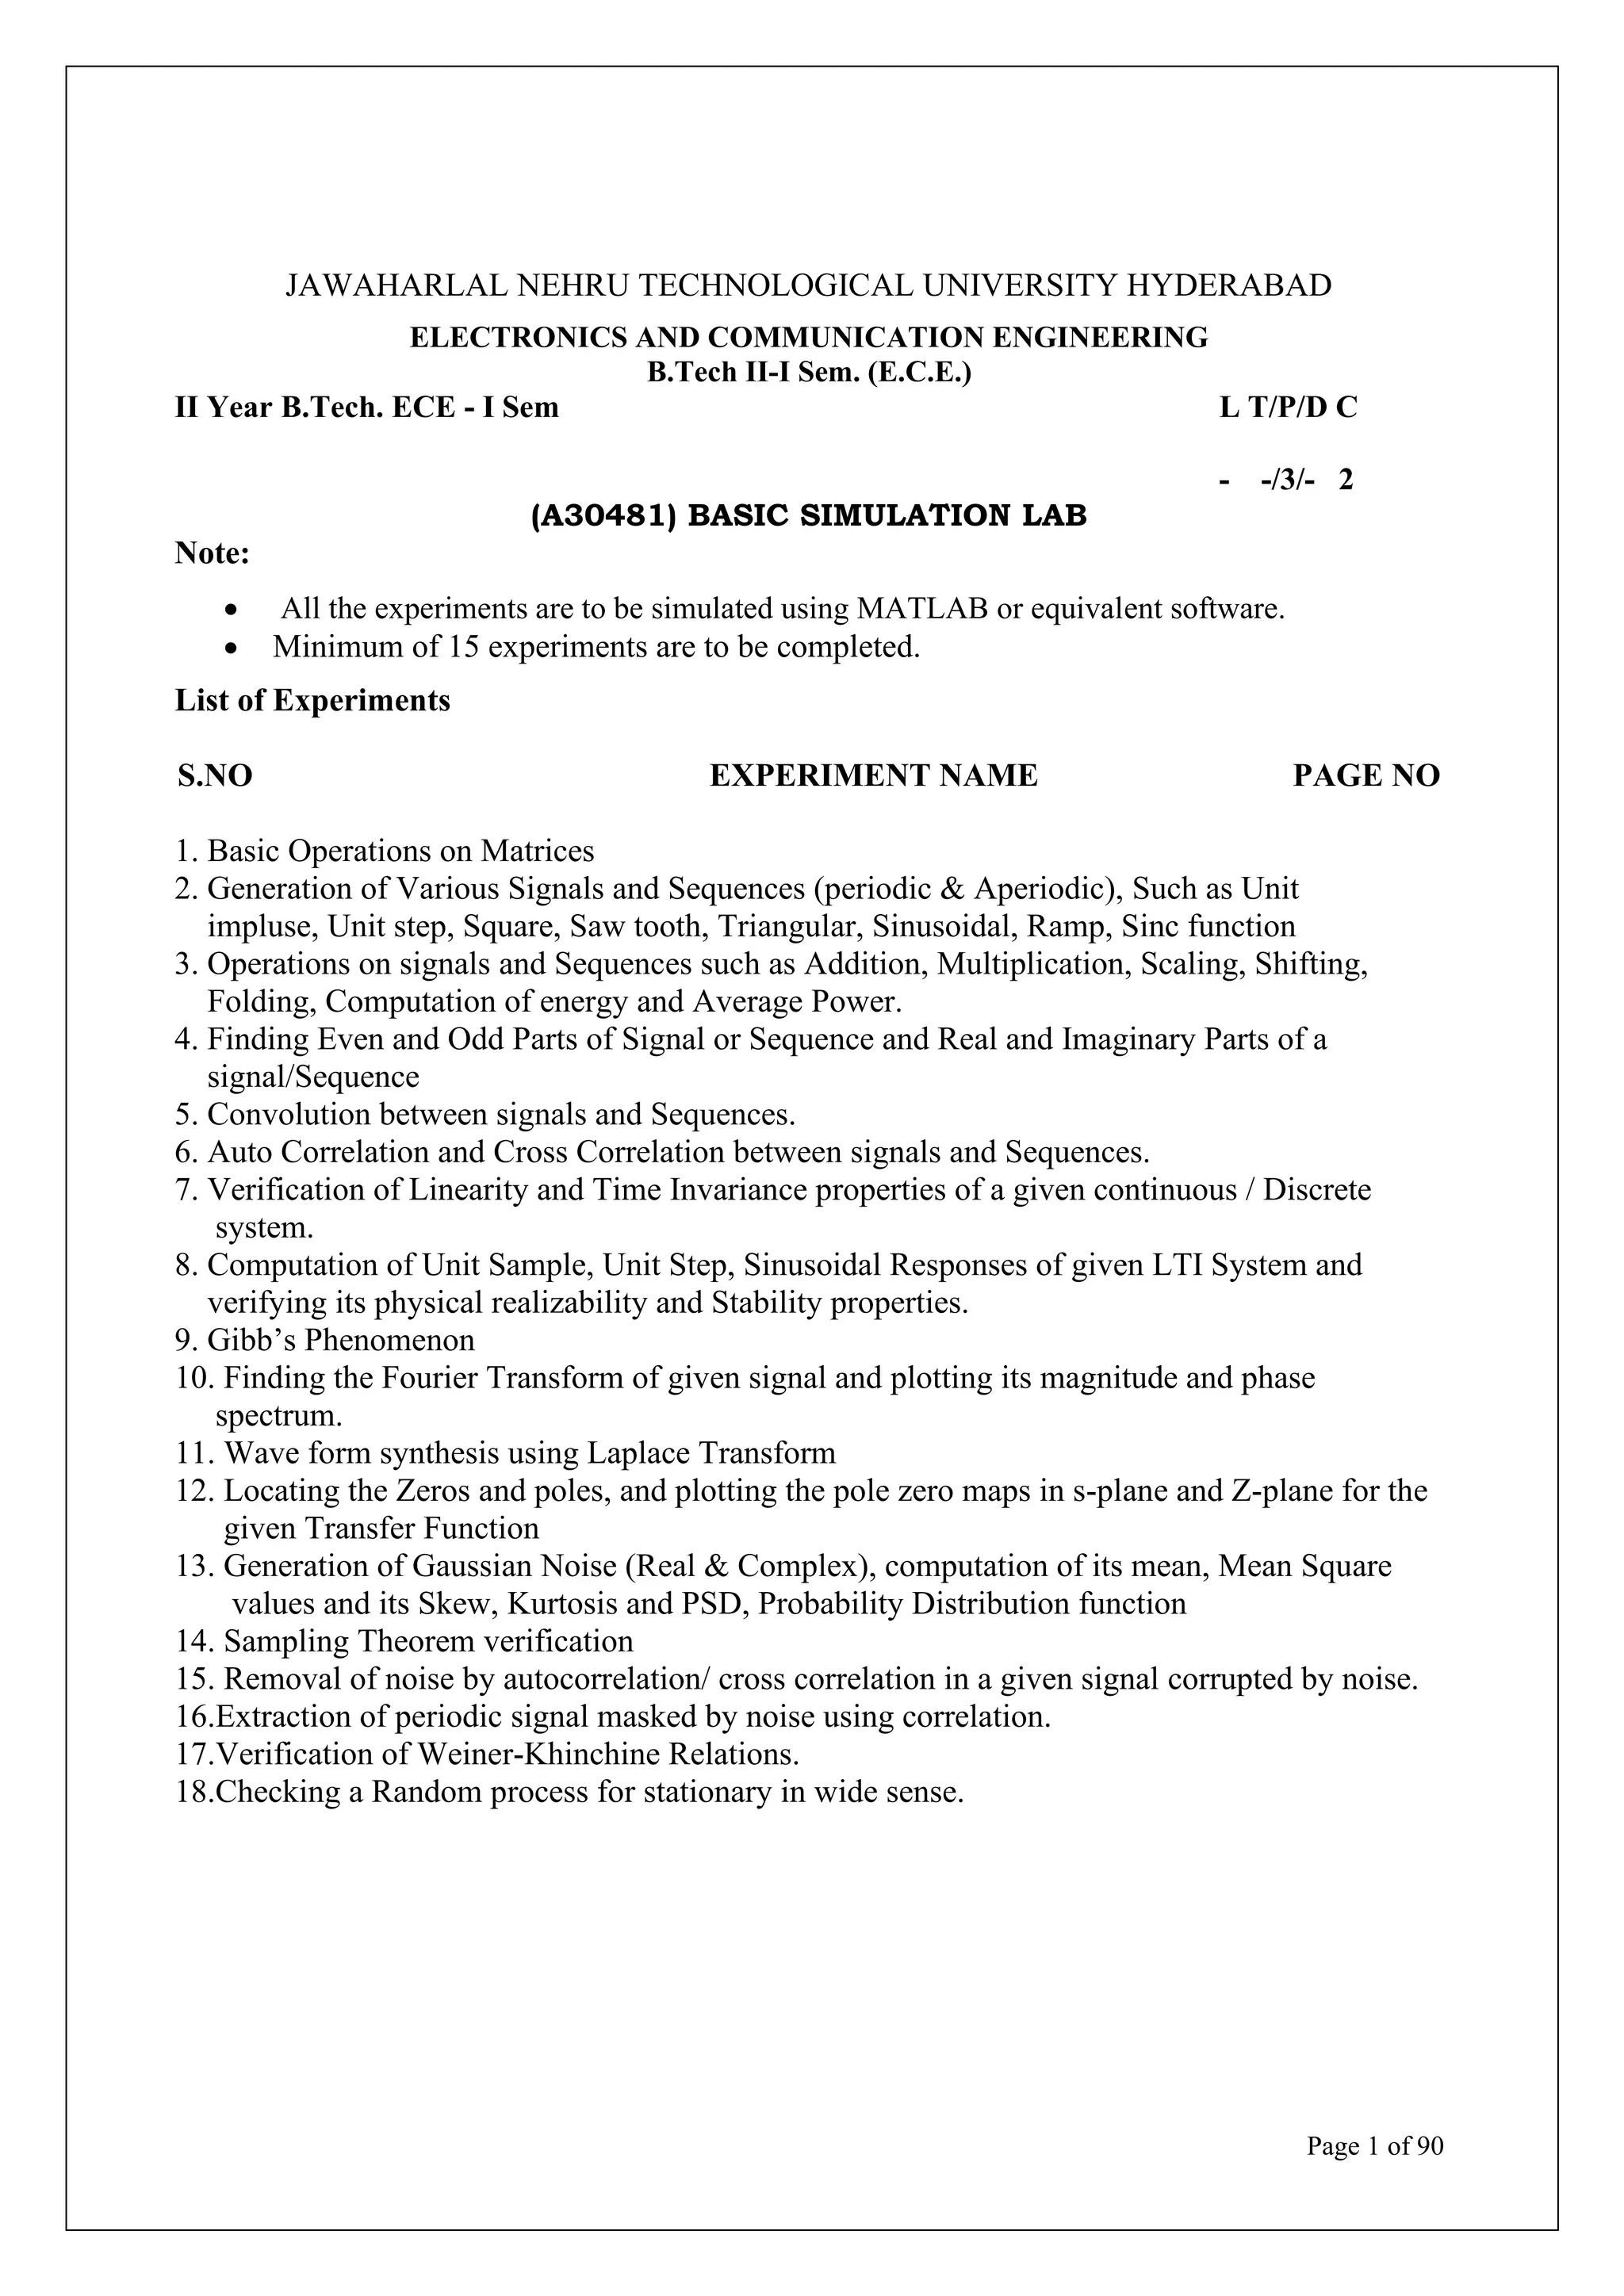
1. Various common signals were generated using MATLAB, including unit impulse, unit step, ramp, sinc, sine, sawtooth, square, and triangular signals. Both continuous and discrete forms were produced.
2. Operations on the generated signals included plotting their amplitude over time or index, adding titles and labels to figures, and displaying the results in different subplot configurations for comparison.
3. Common periodic signals like sine and square waves were generated along with aperiodic signals such as ramp, impulse and step functions to demonstrate the creation of basic continuous and discrete time signals in MATLAB for analysis and simulation.
![Page 2 of 90
1. Operations on matrices
Aim: To perform different operations on matrices using MATLAB software.
Equipment: PC loaded with MATLAB software 7.0 and above.
Procedure:
• Open MATLAB
• Open new M-file
• Type the program
• Save in current directory
• Compile and run the program
•
For the output see command window Figure window
Program:
r=[1 2 3]
Output:
r =
1 2 3
c=[1;2;3;4]
Output:
c =
1
2
3
4
I=eye (3,3)
Output:
I =
1 0 0
0 1 0
0 0 1
o=zeros(3,3)
Output:
o =](https://image.slidesharecdn.com/bslabmanual1-220808145117-8eab4583/75/BS-LAB-Manual-1-pdf-2-2048.jpg)
![Page 3 of 90
0 0 0
0 0 0
0 0 0
i=ones(3,3)
Output:
i =
1 1 1
1 1 1
1 1 1
m=[3 4;7 8]
Output:
m =
3 4
7 8
z=[1 2 4;1 7 3;1 9 8]
Output:
z =
1 2 4
1 7 3
1 9 8
e=z(1,2)
Output:
e = 2
x=[4 5;7 4]
Output:
x =
4 5
7 4
y=[9 4;9 7]](https://image.slidesharecdn.com/bslabmanual1-220808145117-8eab4583/75/BS-LAB-Manual-1-pdf-3-2048.jpg)

![Page 5 of 90
em=x.*y
Output:
em =
36 20
63 28
z=[1 2 4;1 7 3;1 9 8]
Output:
z =
1 2 4
1 7 3
1 9 8
n=[7;16;21]
Output:
n =
7
16
21
z(:,1)=n
Output:
z =
7 2 4
16 7 3
21 9 8
z(2,:)=r
Output:
z =
7 2 4
1 2 3
21 9 8](https://image.slidesharecdn.com/bslabmanual1-220808145117-8eab4583/75/BS-LAB-Manual-1-pdf-5-2048.jpg)
![Page 6 of 90
m=[1 5;9 4]
Output:
m =
1 5
9 4
p=m'
Output:
p =
1 9
5 4
q=inv(m)
Output:
q =
-0.0976 0.1220
0.2195 -0.0244
a=adjoint(m)
Output:
a =
4.0000 -5.0000
-9.0000 1.0000
d=det(m)
Output:
d =
-41
s=[1 1 1;1 2 3;1 3 4]
Output:
s =
1 1 1
1 2 3
1 3 4](https://image.slidesharecdn.com/bslabmanual1-220808145117-8eab4583/75/BS-LAB-Manual-1-pdf-6-2048.jpg)
![Page 7 of 90
n=[7 16 22]
Output:
n =
7 16 22
b=[1 2 3;4 6 8;4 5 7]
Output:
b =
1 2 3
4 6 8
4 5 7
v = [16 5 9 4 2 11 7 14];
v(3) % Extract the third element
Output:
ans =
9
v([1 5 6]) % Extract the first, fifth, and sixth elements
Output:
ans =
16 2 11
v(3:7) % Extract the third through the seventh elements
Output:
ans =
9 4 2 11 7
v(1:2:end) % Extract all the odd elements
Output:
ans =
16 9 2 7
v([2 3 4]) = [10 15 20] % Replace some elements of v
Output:
v =
16 10 15 20 2 11 7 14](https://image.slidesharecdn.com/bslabmanual1-220808145117-8eab4583/75/BS-LAB-Manual-1-pdf-7-2048.jpg)
![Page 8 of 90
A = magic(4)
Output:
A =
16 2 3 13
5 11 10 8
9 7 6 12
4 14 15 1
A(2:4,1:2)
Output:
ans =
5 11
9 7
4 14
A(3,:) % Extract third row
Output:
ans =
9 7 6 12
A(:,end) % Extract last column
Output:
ans =
13
8
12
1
idx = sub2ind(size(A), [2 3 4], [1 2 4]) %returns the linear indices ind
corresponding to the row and column subscripts in row and col for a matrix of size
sz.
Output:
idx =
2 7 16](https://image.slidesharecdn.com/bslabmanual1-220808145117-8eab4583/75/BS-LAB-Manual-1-pdf-8-2048.jpg)


![Page 14 of 90
%Program to generate unit step signal
clc;
clear all; %removes all variables from the work
close all; %closes the current figure window
t=-1:0.03:1; %the range on x-axis and 0.01 represents distance of points to
be x
y=(t>=0) %assigning the values of y
subplot(1,2,1); %gives the number of rows and columns position
plot(t,y); % plots signal y versus t
xlabel('time axis'); %adds text besides the x axis on the current axis
ylabel('amplitude'); %adds text besides the y axis on the current axis
title('unit step signal'); %adds text on top of current axis
n=-10:10
y=(n>=0)
subplot(1,2,2); %gives the number of rows and columns position
stem(n,y); %plots the discrete sequence y versus t
xlabel('n') %adds text besides x axis
ylabel('y[n]'); % adds text besides y axis
title('unit step sequence') %adds text on top of current axis
Output:
Figure 2. 2
%Program to generate ramp signal
clc;
clear all;
close all;
t=0:5;
y=t;
subplot(1,2,1);
plot(t,y);
xlabel('time');
ylabel('amplitude');
title('Continuous ramp signal');
subplot(1,2,2);
stem(t,y);
xlabel('n')
ylabel('amplitude');
title(' Discrete ramp function ');](https://image.slidesharecdn.com/bslabmanual1-220808145117-8eab4583/75/BS-LAB-Manual-1-pdf-14-2048.jpg)
![Page 15 of 90
Output:
0 2 4 6
0
0.5
1
1.5
2
2.5
3
3.5
4
4.5
5
time
amplitude Continuous ramp signal
0 2 4 6
0
0.5
1
1.5
2
2.5
3
3.5
4
4.5
5
n
amplitude
Discrete ramp function
Figure 2.3
% Program to generate triangular signal
clc;
clear all;
close all;
t=-5:1:5;
x=sawtooth(t,0.5);
subplot(1,2,1)
plot(t,x);
axis([-5 5 -3 3])
grid
xlabel('time');
ylabel(' amplitude');
title('triangular signal');
n=-5:1:5;
x=sawtooth(n,0.5);
subplot(1,2,2)
stem(n,x);
axis([-5 5 -3 3])
grid
xlabel('time index n');
ylabel(' amplitude');
title('triangular Sequence');](https://image.slidesharecdn.com/bslabmanual1-220808145117-8eab4583/75/BS-LAB-Manual-1-pdf-15-2048.jpg)

![Page 17 of 90
% Program to generate sine signal and sequence
clc;
clear all;
close all;
t=0:63;
x=sin(2*pi*0.0625*t);
subplot(1,2,1);
plot(t,x);
xlabel('time axis');
ylabel('amplitude');
title('sinusoidal signal');
subplot(1,2,2)
stem(t,x);
xlabel('time index n');
ylabel('amplitude');
title('sinusoidal sequence');
Output:
0 20 40 60 80
-1
-0.8
-0.6
-0.4
-0.2
0
0.2
0.4
0.6
0.8
1
time axis
amplitude
sinusoidal signal
0 20 40 60 80
-1
-0.8
-0.6
-0.4
-0.2
0
0.2
0.4
0.6
0.8
1
time index n
amplitude
sinusoidal sequence
Figure 2.6
% Program to generate sawtooth signal
clc;
clear all;
close all;
t=-15:1:15;
x=sawtooth(0.5*t);
subplot(1,2,1)
plot(t,x);
axis([-15 15 -3 3])
grid
xlabel('time');
ylabel(' amplitude');
title('sawtooth signal');
n=-15:1:15;
x=sawtooth(0.5*n);
subplot(1,2,2)
stem(n,x);
axis([-15 15 -3 3])
grid
xlabel('time index n');
ylabel(' amplitude');
title('sawtooth Sequence');](https://image.slidesharecdn.com/bslabmanual1-220808145117-8eab4583/75/BS-LAB-Manual-1-pdf-17-2048.jpg)
![Page 18 of 90
Output:-
Figure 2.7
% Program to generate square signal
clc;
clear all;
close all;
t=-10:0.01:10;
x=square(t,50);
subplot(1,2,1)
plot(t,x);
axis([-10 10 -3 3])
grid
xlabel('time');
ylabel(' amplitude');
title('square signal');
n=-10:1:10;
x=square(n,50);
subplot(1,2,2)
stem(n,x);
axis([-10 10 -3 3])
grid
xlabel('time index n');
ylabel(' amplitude');
title('square Sequence');
Output:-
Figure 2.8](https://image.slidesharecdn.com/bslabmanual1-220808145117-8eab4583/75/BS-LAB-Manual-1-pdf-18-2048.jpg)


![Page 22 of 90
xlabel('time');
ylabel('amplitude');
title('signal2:sine wave of frequency 8Hz');
% addition of signals
y1=x1+x2;
subplot(2,2,3);
plot(t,y1);
xlabel('time');
ylabel('amplitude');
title('resultant signal:signal1+signal2');
% multiplication of signals
y2=x1.*x2;
subplot(2,2,4);
plot(t,y2);
xlabel('time');
ylabel('amplitude');
title('resultant signal: dot product of signal1 and signal2');
0 0.5 1
-1
-0.5
0
0.5
1
time
amplitude
signal1:sine wave of frequency 4Hz
0 0.5 1
-1
-0.5
0
0.5
1
time
amplitude signal2:sine wave of frequency 8Hz
0 0.5 1
-2
-1
0
1
2
time
amplitude
resultant signal:signal1+signal2
0 0.5 1
-1
-0.5
0
0.5
1
time
amplitude
resultant signal:dot product of signal1 and signal2
Figure 3.1
% Program to perform amplitude scaling for sinusoidal signal
clc;
clear all;
close all;
t=[0:0.01:1];
A=8;
f1=2;
s1=sin(2*pi*f1*t);
subplot(4,1,1)
plot(s1);
xlabel('t');
ylabel('amplitude');
title('input signal');
s2=A*s1;](https://image.slidesharecdn.com/bslabmanual1-220808145117-8eab4583/75/BS-LAB-Manual-1-pdf-22-2048.jpg)
![Page 23 of 90
subplot(4,1,2);
plot(s2);
xlabel('t');
ylabel('amplitude');
title('amplified input signal');
%Amplitude scaling of discrete sequence
n=0:1:6;
s3=[1 2 3 3 1 1 1 ];
subplot(4,1,3);
stem(n,s3);
xlabel('n');
ylabel('amplitude');
title(' input sequence');
s4=4*s3;
subplot(4,1,4);
stem(n,s4);
xlabel('n');
ylabel('amplitude');
title ('amplified input sequence')
Output:
0 20 40 60 80 100 120
-1
0
1
t
amplitude
input signal
0 20 40 60 80 100 120
-10
0
10
t
amplitude
amplified input signal
0 1 2 3 4 5 6
0
2
4
n
amplitude
input sequence
0 1 2 3 4 5 6
0
10
20
n
amplitude
amplified input sequence
Figure 3.2
% Program to generate time scaling
clc;
clear all;
close all;
t=0:0.001:2
y=sin(2*pi*1*t);
subplot(3,1,1)
plot(t,y)
xlabel('t');](https://image.slidesharecdn.com/bslabmanual1-220808145117-8eab4583/75/BS-LAB-Manual-1-pdf-23-2048.jpg)
![Page 24 of 90
ylabel('x(t)');
title('sinusoidal signal');
y1=sin(2*pi*1*t*2)
subplot(3,1,2)
plot(t,y1)
xlabel('t')
ylabel('x(t)')
title('compressed signal');
y2=sin(2*pi*1*t*0.5);
subplot(3,1,3)
plot(t,y2)
xlabel('t');
ylabel('x(t)');
title('expanded signal');
Output:
0 0.2 0.4 0.6 0.8 1 1.2 1.4 1.6 1.8 2
-1
0
1
t
x(t)
sinusoidal signal
0 0.2 0.4 0.6 0.8 1 1.2 1.4 1.6 1.8 2
-1
0
1
t
x(t)
compressed signal
0 0.2 0.4 0.6 0.8 1 1.2 1.4 1.6 1.8 2
-1
0
1
t
x(t)
expanded signal
Figure 3.3
% Program to generate amplitude shifting
clc;
clear all;
close all;
t=0:0.001:2;
a=3;
y=sin(2*pi*1*t);
subplot(3,1,1)
plot(t,y)
axis([0 2 -5 5]);
xlabel('t');
ylabel('x(t)');
title('sinusoidal signal');
y1=a+sin(2*pi*1*t);
subplot(3,1,2)
plot(t,y1)
axis([0 2 -5 5]);
xlabel('t')
ylabel('x(t)')](https://image.slidesharecdn.com/bslabmanual1-220808145117-8eab4583/75/BS-LAB-Manual-1-pdf-24-2048.jpg)
![Page 25 of 90
title('Up shifted signal');
y2=-a+sin(2*pi*1*t);
subplot(3,1,3)
plot(t,y2)
axis([0 2 -5 5]);
xlabel('t');
ylabel('x(t)');
title('Down shifted signal');
Output:
Figure 3.4
% Program to perform time Shifting
clc;
clear all;
close all;
syms t;
shift=2;
x=heaviside(t)
subplot(3,1,1)
fplot(x, [-10,10])
xlabel('t');
ylabel('x(t)');
title('unit step signal');
xleft=heaviside(t+2);
subplot(3,1,2)
fplot(xleft,[-10,10])
xlabel('tleft')
ylabel('amplitude')
title('left shifted signal');
xright=heaviside(t-2);](https://image.slidesharecdn.com/bslabmanual1-220808145117-8eab4583/75/BS-LAB-Manual-1-pdf-25-2048.jpg)
![Page 26 of 90
subplot(3,1,3)
fplot(xright,[-10,10])
xlabel('tright');
ylabel('amplitude');
title('right shifted signal');
Output:
Figure 3.4
% Program to generate time reversal of a signal
clc;
clear all;
close all;
y=-2.5:0.05:2.5;
ly=length(y)
ny=0:ly-1
subplot(2,1,1)
stem(ny,y)
xlabel('n')
ylabel('amplitude')
title('original signal')
yf=fliplr(y)
nf=-fliplr(ny)
subplot(2,1,2)
stem(nf,yf)
xlabel('n')
ylabel('amplitude')
title('folded signal')](https://image.slidesharecdn.com/bslabmanual1-220808145117-8eab4583/75/BS-LAB-Manual-1-pdf-26-2048.jpg)
![Page 27 of 90
Output:
0 10 20 30 40 50 60 70 80 90 100
-3
-2
-1
0
1
2
3
n
amplitude
original signal
-100 -90 -80 -70 -60 -50 -40 -30 -20 -10 0
-3
-2
-1
0
1
2
3
n
amplitude
folded signal
Figure 3.5
% Program to generate compute energy and power of a signal
clc;
clear all;
close all;
t=-10:0.01:10;
T=10;
x=10*sin(2*pi*5*t);
xsq=x.^2;
E=trapz(t,xsq);
P=E/(2*T);
disp(['Energy,E=',num2str(E),'Joules'])
disp(['Power,P=',num2str(P),'Watts'])
Output:-
Energy,E=1000Joules
Power,P=50Watts
Conclusion: Various operations on signals and sequences are performed.
Viva Questions:
1. What is a system.
2. Define a Linear System.
3. What is Time scaling Property?
4. Define Amplitude scaling .
5. What is Time Shifting Property?
6. Define Duality and folding of a signal.](https://image.slidesharecdn.com/bslabmanual1-220808145117-8eab4583/75/BS-LAB-Manual-1-pdf-27-2048.jpg)

![Page 29 of 90
ylabel('xe')
title('Even part of the signal')
subplot(4,1,4)
fplot(xo)
xlabel('t')
ylabel('xo')
title('Odd part of the signal')
Figure 4.1
%Program to find the real and imaginary parts of the complex sequence
clc;
clear all;
close all;
n=0:1:5;
x=input('enter the complex no sequence');
y=real(x)
z=imag(x)
subplot(2,1,1);
stem(y);
xlabel('n');
ylabel('x(n)');
title('real part');
subplot(2,1,2);
stem(z);
xlabel('n');
ylabel('x(n)');
title('imaginary part');
Output:
enter the complex no sequence[2+3i 1+2i 5+3i 8+7i]](https://image.slidesharecdn.com/bslabmanual1-220808145117-8eab4583/75/BS-LAB-Manual-1-pdf-29-2048.jpg)


![Page 32 of 90
5. Convolution of sequences and signals
Aim: To perform the convolution operation between two sequences and two signals using
MATLAB software.
Equipment: MATLAB software7.0 and above.
Theory:
Linear Convolution:
Convolution is an integral concatenation of two signals. It is used for the determination of the output
signal of a linear time-invariant system by convolving the input signal with the impulse response of the
system.
Note that convolving two signals is equivalent to multiplying the Fourier transform of the two signals.
Y(t)=x(t)*h(t)= )
(
)
(
−
−
t
h
x d
For discrete time signals the integration is replaced by a summation
Linear Convolution involves the following operations.
1. Folding
2. Multiplication
3. Addition
4. Shifting
If x(n)=δ(n) (impulse ) then, output y(n) is known as impulse response of the system.
The linear convolution of two continuous time signals and is defined by :
y(n)=T[x(n)]=h(n) similarlyδ (n-k)= h(n-k)
x(n) cab represented as weighted sum of impulses such as](https://image.slidesharecdn.com/bslabmanual1-220808145117-8eab4583/75/BS-LAB-Manual-1-pdf-32-2048.jpg)
![Page 33 of 90
Program:
% convolution of two sequences
clc;
clear all;
close all;
x=input('enter first sequence')
k1=0:length(x)-1;
subplot(3,1,1)
stem(k1,x)
xlabel('n');
ylabel('x(n)');
title('x1(n)')
h=input('enter second sequence');
k2= 0:length(h)-1
subplot(3,1,2)
stem(k2,h)
xlabel('n');
ylabel('x(n)');
title('x2(n)');
k=k1(1)+k2(1);
p=length(x)+length(h)-1;
n=k:p-1+k;
y=conv(x,h)
subplot(3,1,3)
stem(n,y)
xlabel('n');
ylabel('y(n)');
title('linear convolution');
disp('the resultant signal is:')
disp(y)
Output:
enter first sequence [1 2 3 ]
x = 1 2 3
enter second sequence[-1 2 3 ]
h = -1 2 3
y = -1 0 4 12 9
the resultant signal is:
-1 0 4 12 9](https://image.slidesharecdn.com/bslabmanual1-220808145117-8eab4583/75/BS-LAB-Manual-1-pdf-33-2048.jpg)


![Page 37 of 90
%Program to compute cross correlation of two sequences
clc
clear all
close all
x=input('enter first sequence')
k1=0:length(x)-1;
subplot(2,2,1)
stem(k1,x)
xlabel('k1')
ylabel('x1(k1)')
title('First sequence')
y=input('second sequence')
k2=0:length(y)-1;
subplot(2,2,2)
stem(k2,y)
xlabel('k2')
ylabel('y(k2)')
title('Second sequence')
[rxy,lag]=xcorr(x,y)
subplot(2,2,3)
stem(lag,rxy)
xlabel('lag')
ylabel('rxy(l)')
title('cross correlation rxy(lag)')
[ryx,lag]=xcorr(y,x)
subplot(2,2,4)
stem(lag,ryx)
xlabel('lag')
ylabel('ryx(l)')
title('cross correlation ryx(lag)')
if rxy==fliplr(ryx)
display('rxy(l) is equal to ryx(-l)')
else
display('rxy(l) is not equal to ryx(-l)')
end
Output:
enter first sequence[1 2 3 ]
x = 1 2 3
second sequence[3 2 1 ]
y = 3 2 1
r = 1.0000 4.0000 10.0000 12.0000 9.0000
lag = -2 -1 0 1 2
r = 9.0000 12.0000 10.0000 4.0000 1.0000
lag = -2 -1 0 1 2
rxy(l) is equal to ryx(-l)](https://image.slidesharecdn.com/bslabmanual1-220808145117-8eab4583/75/BS-LAB-Manual-1-pdf-37-2048.jpg)
![Page 38 of 90
Figure 6.1
%Program to compute Autocorrelation a signal and sequence
clc
clear all
close all
x= input ('enter the sequence')
k=0:length(x)-1;
subplot(2,1,1)
stem (k,x)
xlabel('k');
ylabel('x(k)')
title('input signal')
[r,lag]=xcorr(x)
subplot(2,1,2)
stem(lag,r)
xlabel('lag')
ylabel('rxx(lag)')
title('auto correlation')
Output:
enter the sequence[1 2 3 ]
x = 1 2 3
r = 3.0000 8.0000 14.0000 8.0000 3.0000
lag = -2 -1 0 1 2](https://image.slidesharecdn.com/bslabmanual1-220808145117-8eab4583/75/BS-LAB-Manual-1-pdf-38-2048.jpg)
![Page 39 of 90
Figure 6.2
%Program to compute Autocorrelation and Cross correlation of two signals
clc
clear all
close all
t=0:0.01:1;
x1=sin(2*pi*5*t)
x2=sin(2*pi*2*t)
[y lag]=xcorr(x1,x2)
[z lags]=xcorr(x1)
subplot(4,1,1)
plot(t,x1)
xlabel('t')
ylabel('amplitude')
title('first signal')
subplot(4,1,2)
plot(t,x2)
xlabel('t')
ylabel('amplitude')
title('second signal')
subplot(4,1,3)
plot(lag,y)
xlabel('lag')](https://image.slidesharecdn.com/bslabmanual1-220808145117-8eab4583/75/BS-LAB-Manual-1-pdf-39-2048.jpg)

![Page 41 of 90
7. Verification of linearity and shift invariance property of discrete system
Aim: To verify linearity and shift invariance properties of a given discrete system using
MATLAB software.
Equipment: MATLAB software7.0 and above.
Theory:-
Linearity property:
Any system is said to be linear if it satisfies the superposition principle.
Superposition principle state that response to a weighted sum of input signal equal to the
corresponding weighted sum of the outputs of the system to each of the individual input signals.
x(n) -----------input signal
Y(n) --------- output signal
Y(n)=T[x(n)]
Y1(n)=T[X1(n)] : Y2(n)=T[X2(n)]
x3=[a X1(n)] +b [X2(n) ]
Y3(n)= T [x3(n)]
If T [a X1(n)] +b [X2(n) ] = a Y1(n)+ b Y2(n) then the system is said to be linear.
Let a [Y1(n)]+ b [X2(n) ] =Z 3(n)
%Program to verify the Linearity Property
clc
clear all
close all
x1=input('enter first sequence')
x2=input('enter second sequence')
h=[1 -3 4 -2 7 2 -1 3];
a1=input('enter coefficient of x1');
a2=input('enter coefficient of x2');
y1=a1*conv(x1,h)
y2=a2*conv(x2,h)
z=y1+y2;
x3=a1*x1+a2*x2;
y3=conv(x3,h);
disp('y3 is')
disp(y3)
disp('z is')](https://image.slidesharecdn.com/bslabmanual1-220808145117-8eab4583/75/BS-LAB-Manual-1-pdf-41-2048.jpg)
![II B.Tech. ECE- I Semester R18 Basic Simulation Laboratory Manual
BRECW, Saidabad, Hyderabad-59 Page 42 of 90
disp(z)
if(y3==z)
disp('the given system is linear')
else
disp('the given system is not linear')
end
subplot(3,1,1)
stem(y3)
xlabel('n')
ylabel('y3')
title('Output to weighted sum of inputs')
subplot(3,1,2)
stem(z)
xlabel('n')
ylabel('z')
title('weighted sum of outputs')
d=y3-z;
subplot(3,1,3)
stem(d)
title('Difference between output to weighted sum of inputs and weighted sum of
outputs')
Output:
enter first sequence [1 2 3 4 5 ]
x1 = 1 2 3 4 5
enter second sequence [ 6 7 8 9 1 ]
x2 = 6 7 8 9 1
enter coefficient of x11
enter coefficient of x21
y1 = 1 -1 1 1 8 11 36 25 46 15 7 15
y2 = 6 -11 11 1 34 78 50 88 38 17 26 3
y01 is 7 -12 12 2 42 89 86 113 84 32 33 18
y02 is 7 -12 12 2 42 89 86 113 84 32 33 18
the given system is linear](https://image.slidesharecdn.com/bslabmanual1-220808145117-8eab4583/75/BS-LAB-Manual-1-pdf-42-2048.jpg)
![II B.Tech. ECE- I Semester R18 Basic Simulation Laboratory Manual
BRECW, Saidabad, Hyderabad-59 Page 43 of 90
Figure 7.1
%Program for verification of Time Invariance Property
clc
clear all
close all
n=0:40;
d=10
x=3*cos(2*pi*0.1*n)-2*cos(2*pi*0.4*n)
xd=[zeros(1,d),x]
num=[2.2403 2.4908 2.2403];
den=[1 -0.4 0.75];
y= filter(num,den,x);
yd=filter(num,den,xd);
dy=[zeros(1,d) y];
subplot(3,1,1)
stem(y)
xlabel('n')
ylabel('y(n)')
title('original output')
subplot(3,1,2);
stem(yd);
xlabel('n')](https://image.slidesharecdn.com/bslabmanual1-220808145117-8eab4583/75/BS-LAB-Manual-1-pdf-43-2048.jpg)


![II B.Tech. ECE- I Semester R18 Basic Simulation Laboratory Manual
BRECW, Saidabad, Hyderabad-59 Page 46 of 90
8. Computation of unit impulse, unit step, sinusoidal responses of given LTI
system and verifying its physical realizability and stability properties.
Aim: To get the response of analog system.
Equipment: Matlab software 7.0 and above.
Theory:-
Linear systems satisfy the properties of superposition and homogeneity. Any
system that does not satisfy these properties is nonlinear. Linear systems have one
equilibrium point at the origin.
The principle of superposition states that for two different inputs, x and y, in the domain
of the function f,
f(x+y)= f(x)+f(y)
The property of homogeneity states that for a given input, x, in the domain of the function
f, and for any real number k,
f(kx)=kf(x)
clc;
close all;
clear all;
num=[1]
den=[1 -0.7 0.12]
% num=[1]
% den=[1 -0.9 0.81]
t=-1:0.01:1;
x1=(t==0);
y1=filter(num,den,x1);
subplot(3,1,1);
plot(t,y1,'r');
hold
title('impulse response');
xlabel('time');
ylabel('amplitude')](https://image.slidesharecdn.com/bslabmanual1-220808145117-8eab4583/75/BS-LAB-Manual-1-pdf-46-2048.jpg)


![II B.Tech. ECE- I Semester R18 Basic Simulation Laboratory Manual
BRECW, Saidabad, Hyderabad-59 Page 50 of 90
Program:
clc;
clear all;
close all;
N=input('type the number of harmonics')
t=0:0.0001:1;
y=square(2*pi*1*t);
plot(t,y,'r','linewidth',2);
axis([0 1 -1.5 1.5]);
hold;
a=zeros(size(t));
for n=1:2:N
a=a+(4/(pi*n)*sin(2*pi*n*t));
end
plot(t,a);
grid;
xlabel('t');
ylabel('sq(t)')
title('reconstructed signal')
Output:
type the number of harmonics9
N =
9
Current plot held
0 0.1 0.2 0.3 0.4 0.5 0.6 0.7 0.8 0.9 1
-1.5
-1
-0.5
0
0.5
1
1.5
t
sq(t)
reconstructed signal
Figure 9. 1](https://image.slidesharecdn.com/bslabmanual1-220808145117-8eab4583/75/BS-LAB-Manual-1-pdf-50-2048.jpg)
![II B.Tech. ECE- I Semester R18 Basic Simulation Laboratory Manual
BRECW, Saidabad, Hyderabad-59 Page 51 of 90
function[a0,a,b]=Fourierseries2(f,T,N)
syms t;
w0=2*pi/T;
a0_sym=1/T*int(f,t,0,T);
a0=double(a0_sym);
for n=1:N
a_sym=2/T*int(f*cos(n*w0*t),t,0,T);
b_sym=2/T*int(f*sin(n*w0*t),t,0,T);
a(n)=double(a_sym);
b(n)=double(b_sym);
end
end
clear all;
close all;
clc;
syms t;
T=2;
w0=2*pi/T;
f=heaviside(t)-2*heaviside(t-1)+2*heaviside(t-2)-2*heaviside(t-3);
% fplot(f)
% axis([0 6 -2 2])
% hold on;
N=input('Enter the number of harmonics');
[a0,a,b]=Fourierseries(f,T,N);
display(a0);
display(a);
display(b);
tnum=[0:0.01:4];
fnum=a0;
for n=1:N
harmonic=a(n)*cos(n*w0*tnum)+b(n)*sin(n*w0*tnum);
fnum=fnum+harmonic;
pause(0.75)
plot(tnum,fnum)
end
hold on;
fplot(f)
axis([0 4 -2 2])
legend('Reconstructed signal','Original periodic signal');
xlabel('time');
ylabel('amplitude')
Enter the number of harmonics
10](https://image.slidesharecdn.com/bslabmanual1-220808145117-8eab4583/75/BS-LAB-Manual-1-pdf-51-2048.jpg)


![II B.Tech. ECE- I Semester R18 Basic Simulation Laboratory Manual
BRECW, Saidabad, Hyderabad-59 Page 55 of 90
Program:
clc
clear all
close all
x=[1 1 1 1 0 0 0 0]
N=8
y1=fft(x,N);
mag=abs(y1)
phase=angle(y1)*180/pi
figure(1)
plot(mag)
xlabel('k')
ylabel('Magnitude of y(k)')
title('magnitude spectrum')
grid
figure(2)
plot(phase)
xlabel('k')
ylabel('Angle of y(k)')
title(‘phase spectrum')
grid
Output:
x =
1 1 1 1 0 0 0 0
N =
8
mag =
4.0000 2.6131 0 1.0824 0 1.0824 0 2.6131
phase =
0 -67.5000 0 -22.5000 0 22.5000 0 67.5000](https://image.slidesharecdn.com/bslabmanual1-220808145117-8eab4583/75/BS-LAB-Manual-1-pdf-55-2048.jpg)


![II B.Tech. ECE- I Semester R18 Basic Simulation Laboratory Manual
BRECW, Saidabad, Hyderabad-59 Page 63 of 90
11. Waveform synthesis using Laplace transform.
Aim: To perform waveform synthesis using Laplace transform of a signal using MATLAB
software.
Equipment: MATLAB software7.0 and above.
Theory: The Laplace transform for a signal f(t) is defined as
∞
L{f(t)}= F(s)=∫ f(t) e
st
−
dt where s=6+jw
- ∞
Consider the square wave of period ‘T’ which can be represented with unit
step functions as f(t)=u(t)-2u(t-T/2)+2u(t-T)-2u(t-3T/2)+………..
Program:
clc
close all
clear all
syms s complex;
L=(1/s)+(1/s)*exp(-s)-(2/s)*exp(-2*s);
l=ilaplace(L);
pretty(simplify(l));
ezplot(l,[0,3]);
grid;
Output:
1 + heaviside(t - 1) - 2 heaviside(t - 2)
0 0.5 1 1.5 2 2.5 3
0
0.5
1
1.5
2
t
1+heaviside(t-1)-2 heaviside(t-2)
Figure 11. 1](https://image.slidesharecdn.com/bslabmanual1-220808145117-8eab4583/75/BS-LAB-Manual-1-pdf-63-2048.jpg)


![II B.Tech. ECE- I Semester R18 Basic Simulation Laboratory Manual
BRECW, Saidabad, Hyderabad-59 Page 66 of 90
12. Locating the zeros and poles and plotting the pole zero maps in s-plane
and z-plane for the given transfer function.
Aim: To locate the zeros and poles and plotting the pole-zero maps in s-plane and z-plane for the
given transfer function using MATLAB software.
Equipment: MATLAB software7.0 and above.
Theory:
Z-transforms
The Z-transform, like many other integral transforms, can be defined as
either a one-sided or two-sided transform.
Bilateral Z-transform
The bilateral or two-sided Z-transform of a discrete-time signal x[n] is the
function X(z) defined as
Z{x(n)}=X(z)=
−
=
8
8
n
x(n) z
n
−
Unilateral Z-transform
Alternatively, in cases where x[n] is defined only for n ≥ 0, the single-sided
or unilateral Z-transform is defined as
Z{x(n)}=X(z)=
=
8
0
n
x(n) z
n
−
where z=re
jw
In signal processing, this definition is used when the signal is causal. If H(z) is a transfer
function in z-domain then
H(z)= )
(
)
(
z
Q
z
P
The roots of the equation P(z) = 0 correspond to the 'zeros' of X(z) The roots of the equation Q(z)
= 0 correspond to the 'poles' of X(z). We denote poles in a z-plane plot by " X” we denote zeros
by “O”. The ROC is the set of points in the complex plane for which the Z-transform summation
converges. The Transfer function H(s) of a system in s-plane is defined as
H(s)= )
(
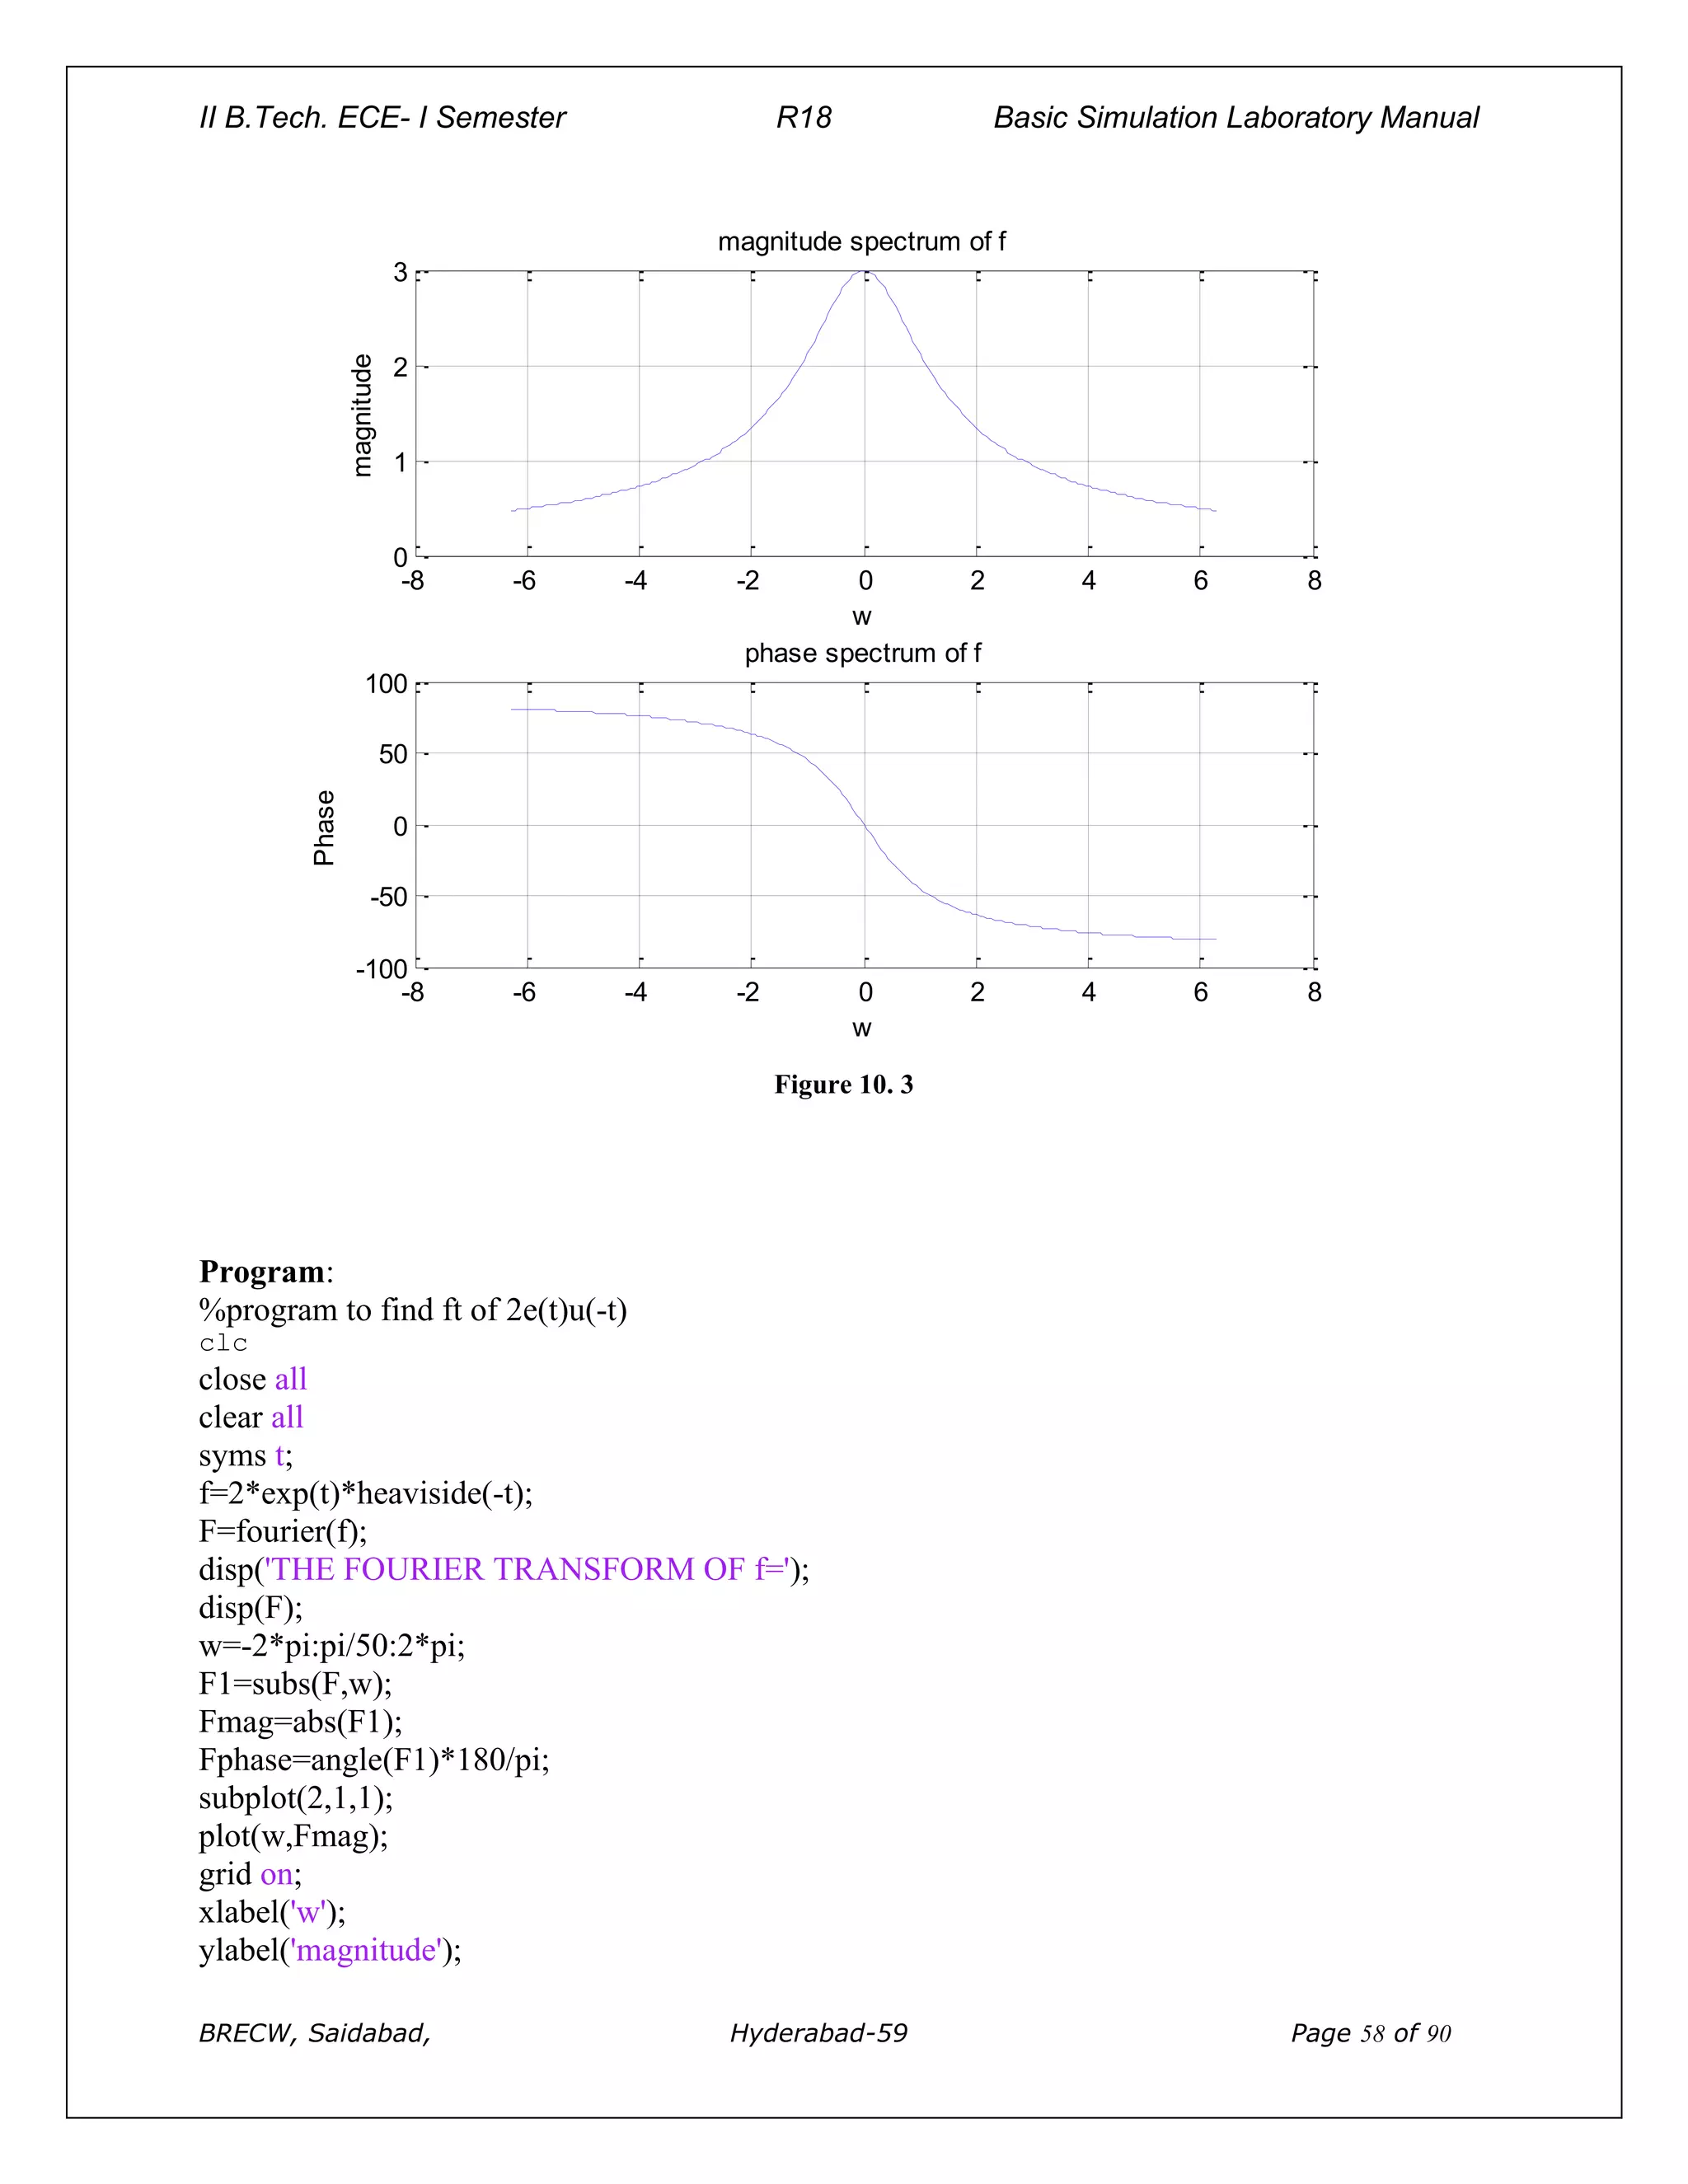
)
(
s
X
s
Y
Where Y(s) = laplace transform of output signal y(t)
X(s) =Laplace transform of input signal x(t)](https://image.slidesharecdn.com/bslabmanual1-220808145117-8eab4583/75/BS-LAB-Manual-1-pdf-66-2048.jpg)
![II B.Tech. ECE- I Semester R18 Basic Simulation Laboratory Manual
BRECW, Saidabad, Hyderabad-59 Page 67 of 90
Program:
%plot poles and zeros in s-plane for a given transfer function
clc
clear all
close all
num=input('ENTER THE COEFFICIENTS OF NUMERATOR POLYNOMIAL');
den=input('ENTER THE COEFFICIENTS OF DENOMINATOR POLYNOMIAL');
H=tf(num,den)
[P Z]=pzmap(H);
disp('ZEROS ARE AT');disp(Z)
disp('POLES ARE AT');disp(P)
pzmap(H);
if max(real(P))>=0
disp('THE SYSYTEM IS UNSTABLE');
else
disp('THE SYSYTEM IS STABLE');
end;
Output:
ENTER THE COEFFICIENTS OF NUMERATOR POLYNOMIAL [1 2 1]
ENTER THE COEFFICIENTS OF DENOMINATOR POLYNOMIAL [1 -9 26 -24]
Transfer function:
s^2 + 2 s + 1
-----------------------
s^3 - 9 s^2 + 26 s - 24
ZEROS ARE AT
-1
-1
POLES ARE AT
4.0000
3.0000
2.0000
THE SYSYTEM IS UNSTABLE](https://image.slidesharecdn.com/bslabmanual1-220808145117-8eab4583/75/BS-LAB-Manual-1-pdf-67-2048.jpg)
![II B.Tech. ECE- I Semester R18 Basic Simulation Laboratory Manual
BRECW, Saidabad, Hyderabad-59 Page 68 of 90
-1 -0.5 0 0.5 1 1.5 2 2.5 3 3.5 4
-1
-0.8
-0.6
-0.4
-0.2
0
0.2
0.4
0.6
0.8
1
Pole-Zero Map
Real Axis
Imaginary
Axis
Figure 12. 1
Program:
%plot poles and zeros in z-plane for a given transfer function
clc
clear all
close all
num=input('ENTER THE COEFFICIENTS OF NUMERATOR POLYNOMIAL')
den=input('ENTER THE COEFFICIENTS OF DENOMINATOR POLYNOMIAL')
H=tf(num,den,0.1)
[Z,P]=tf2zp(num,den)
zplane(num,den)
disp('ZEROS ARE AT');disp(Z)
disp('POLES ARE AT');disp(P)
Output:
ENTER THE COEFFICIENTS OF NUMERATOR POLYNOMIAL[1 -1]](https://image.slidesharecdn.com/bslabmanual1-220808145117-8eab4583/75/BS-LAB-Manual-1-pdf-68-2048.jpg)
![II B.Tech. ECE- I Semester R18 Basic Simulation Laboratory Manual
BRECW, Saidabad, Hyderabad-59 Page 69 of 90
num =
1 -1
ENTER THE COEFFICIENTS OF DENOMINATOR POLYNOMIAL[1 1 0.16]
den =
1.0000 1.0000 0.1600
H =
z - 1
z^2 + z + 0.16
Sample time: 0.1 seconds
Discrete-time transfer function.
Z =
1
P =
-0.8000
-0.2000
ZEROS ARE AT 1
POLES ARE AT
-0.8000 -0.2000](https://image.slidesharecdn.com/bslabmanual1-220808145117-8eab4583/75/BS-LAB-Manual-1-pdf-69-2048.jpg)
![II B.Tech. ECE- I Semester R18 Basic Simulation Laboratory Manual
BRECW, Saidabad, Hyderabad-59 Page 70 of 90
-1 -0.5 0 0.5 1
-1
-0.8
-0.6
-0.4
-0.2
0
0.2
0.4
0.6
0.8
1
Real Part
Imaginary
Part
Figure 12. 2
Output:
ENTER THE COEFFICIENTS OF NUMERATOR POLYNOMIAL[1 1]
num =
1 1
ENTER THE COEFFICIENTS OF DENOMINATOR POLYNOMIAL[1 -1 0.5]
den =
1.0000 -1.0000 0.5000
H =
z + 1
z^2 - z + 0.5](https://image.slidesharecdn.com/bslabmanual1-220808145117-8eab4583/75/BS-LAB-Manual-1-pdf-70-2048.jpg)

![II B.Tech. ECE- I Semester R18 Basic Simulation Laboratory Manual
BRECW, Saidabad, Hyderabad-59 Page 72 of 90
Output:
ENTER THE COEFFICIENTS OF NUMERATOR POLYNOMIAL[1]
num =1
ENTER THE COEFFICIENTS OF DENOMINATOR POLYNOMIAL[1 0.5 -1.25 0.375]
den =
1.0000 0.5000 -1.2500 0.3750
H =
1
z^3 + 0.5z^2 – 1.25z+ 0.375
Sample time: 0.1 seconds
Discrete-time transfer function.
Z =
Empty matrix: 0-by-1
P =
-1.5000
0.5000 + 0.0000i
0.5000 - 0.0000i
ZEROS ARE AT
POLES ARE AT
-1.5000
0.5000 + 0.0000i
0.5000 - 0.0000i](https://image.slidesharecdn.com/bslabmanual1-220808145117-8eab4583/75/BS-LAB-Manual-1-pdf-72-2048.jpg)


![II B.Tech. ECE- I Semester R18 Basic Simulation Laboratory Manual
BRECW, Saidabad, Hyderabad-59 Page 83 of 90
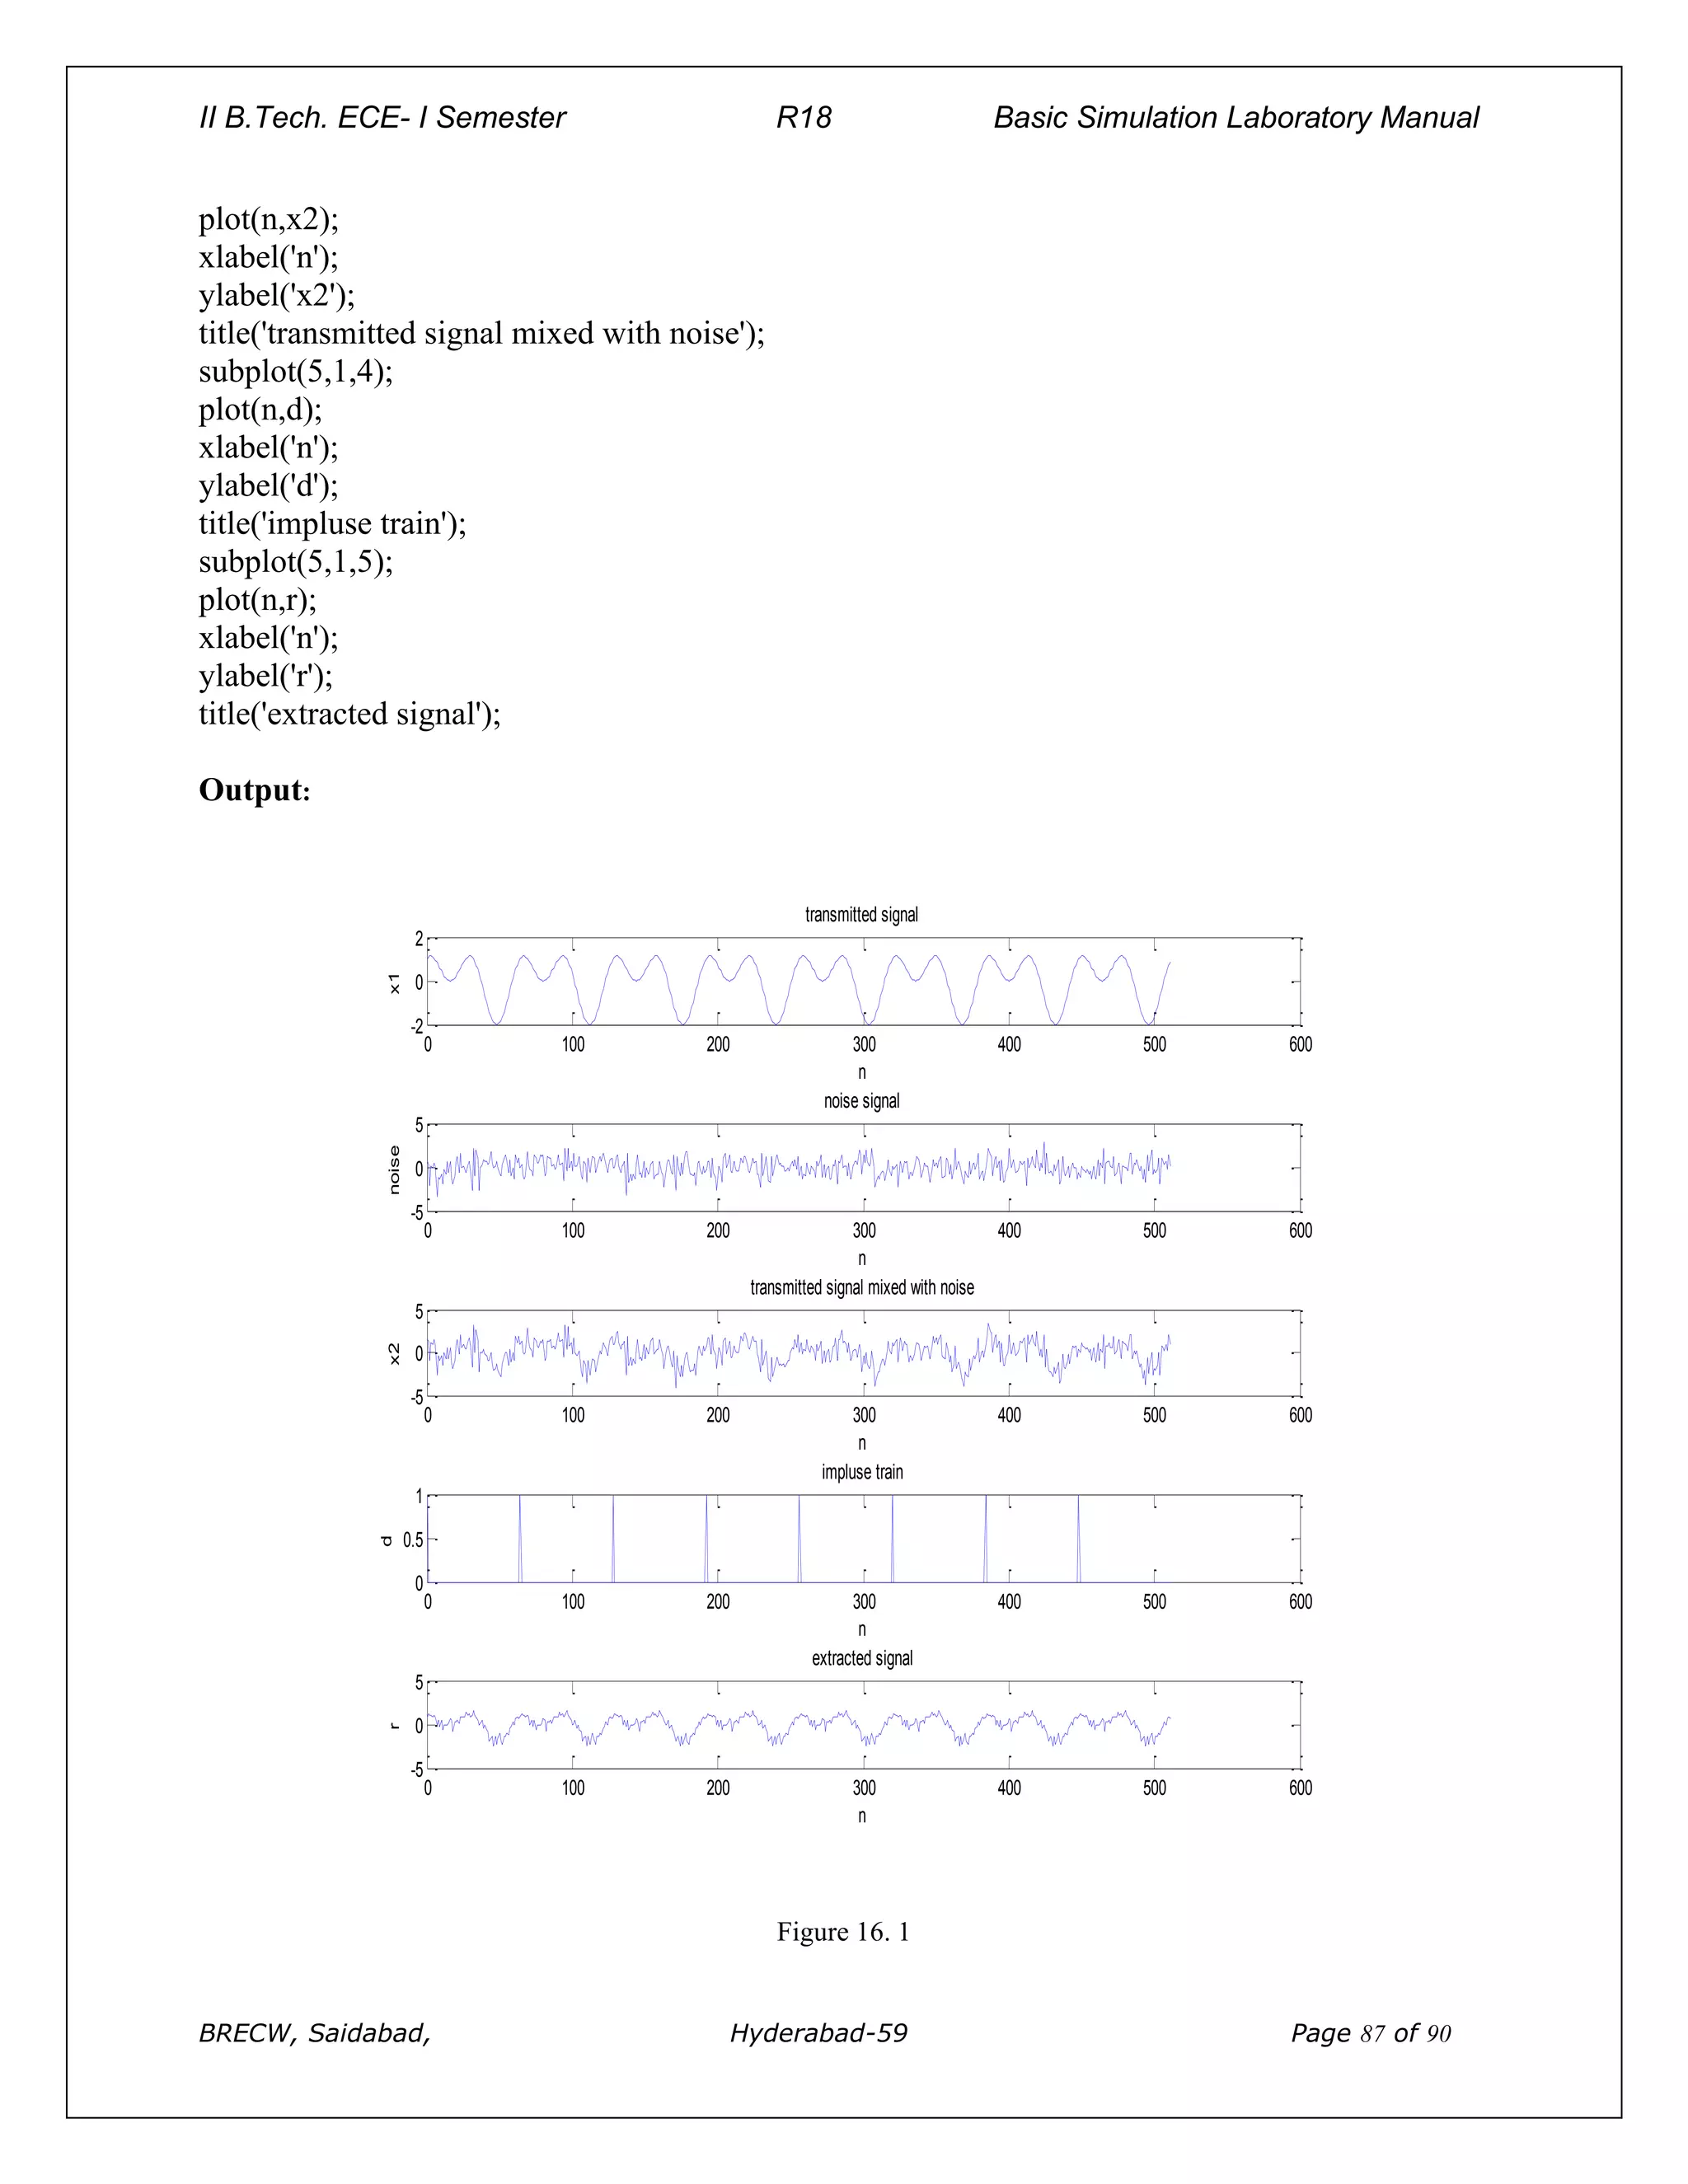
15. Removal of noise by auto/cross correlation
Aim: To verify the sampling theorem using MATLAB software.
Equipment: MATLAB software 7.0 and above.
Theory:
Detection of a periodic signal masked by random noise is of great importance. The noise signal
encountered in practice is a signal with random amplitude variations. A signal is uncorrelated
with any periodic signal. If s(t) is a periodic signal and n(t) is a noise signal, then
T/2
Lim 1/T ∫ S(t)n(t-T) dt=0 for all T
T--∞ -T/2
Qsn(T)= cross correlation function of s(t) and n(t) Then Qsn(T)=0
Detection of noise by Auto-Correlation:
S(t)=Periodic Signal (Transmitted) , mixed with a noise signal n(t). Then f(t) is received signal is
[s(t ) + n(t) ].Let Qff(T) =Auto Correlation Function of f(t),Qss(t) = Auto Correlation Function of
S(t),Qnn(T) = Auto Correlation Function of n(t)
T/2
Qff(T)= Lim 1/T ∫ f(t)f(t-T) dt
T→∞ -T/2
T/2
= Lim 1/T ∫ [s(t)+n(t)] [s(t-T)+n(t-T)] dt
T→∞ -T/2
=Qss(T)+Qnn(T)+Qsn(T)+Qns(T)
The periodic signal s(t) and noise signal n(t) are uncorrelated. Hence Qsn(t)=Qns(t)=0 ;
Then Qff(t)=Qss(t)+Qnn(t)
The Auto correlation function of a periodic signal is periodic of the same frequency and the Auto
correlation function of a non-periodic signal is tendsto zero for large value of T since s(t) is a
periodic signal and n(t) is nonperiodic signal so Qss(T) is a periodic whereas Qnn(T) becomes
small forlarge values of T Therefore for sufficiently large values of T Qff(T) is equal to Qss(T).
Program:
clc;
clear all;
close all;
t=0:0.2:pi*8;
%input signal
s=sin(t);
subplot(6,1,1);
plot(s);
title('signal s');
xlabel('t');](https://image.slidesharecdn.com/bslabmanual1-220808145117-8eab4583/75/BS-LAB-Manual-1-pdf-83-2048.jpg)
![II B.Tech. ECE- I Semester R18 Basic Simulation Laboratory Manual
BRECW, Saidabad, Hyderabad-59 Page 84 of 90
ylabel('amplitude');
%generating noise
n = randn([1 126]);
%noisy signal
f=s+n;
subplot(6,1,2)
plot(f);
title('signal f=s+n');
xlabel('t');
ylabel('amplitude');
%aucorrelation of input signal
as=xcorr(s,s);
subplot(6,1,3);
plot(as);
title('auto correlation of s');
xlabel('t');
ylabel('amplitude');
%aucorrelation of noise signal
an=xcorr(n,n);
subplot(6,1,4)
plot(an);
title('auto correlation of n');
xlabel('t');
ylabel('amplitude');
%aucorrelation of transmitted signal
cff=xcorr(f,f);
subplot(6,1,5)
plot(cff);
title('auto correlation of f');
xlabel('t');
ylabel('amplitude');
%aucorrelation of received signal
hh=as+an;
subplot(6,1,6)
plot(hh);
title('addition of as+an');
xlabel('t');
ylabel('amplitude');](https://image.slidesharecdn.com/bslabmanual1-220808145117-8eab4583/75/BS-LAB-Manual-1-pdf-84-2048.jpg)


![II B.Tech. ECE- I Semester R18 Basic Simulation Laboratory Manual
BRECW, Saidabad, Hyderabad-59 Page 89 of 90
17. Verification of wiener khintchine relation
Aim: To verify wiener khintchine relation.
Apparatus: MATLAB software7.0 and above.
Theory:
The wiener-khinchine theorem states that the power spectral density of a wide sense stationary
random process is the fourier transform of the corresponding autocorrelation function.
Continuous case:
Sxx(f)=∫rxx(T)e-j2πft dT
Where
rxx(T)=E[x(t)x*(t-T)]
Discrete case:
Sxx(f)=Σrxx[k]e-j2πkf
Where
rxx[k]=E[x(n)x*(n-k)]
Program:
clc clear
allclose
allfs=100;
t=0:1/fs:3;
N=512;
x=sin(2*pi*3*t);
x1=fft(x,N);
f=(0:N-1)*fs/N;
x2=(abs(x1)).^2;
subplot(2,1,1);
plot(f,x2);
xlabel('freq');
ylabel('Energy')
title('ENERGY SPECTRAL DENSITY')
x3=xcorr(x);
x4=fft(x3,N);
x5=abs(x4);
subplot(2,1,2);
plot(f,x5);
xlabel('freq');
ylabel('Energy')
title('FOURIER TRANSFORM OF AUTOCORRELATION');](https://image.slidesharecdn.com/bslabmanual1-220808145117-8eab4583/75/BS-LAB-Manual-1-pdf-89-2048.jpg)