Downloaded 256 times


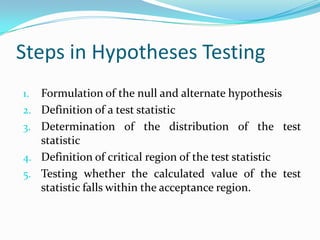

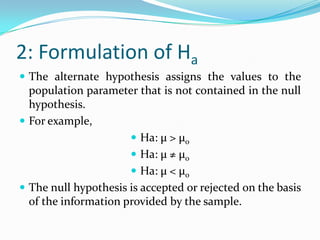


This document discusses key concepts in hypothesis testing, including: - The null hypothesis states the assumption to be tested, while the alternative hypothesis is the opposite. - Type I errors occur when a true null hypothesis is rejected, while type II errors occur when a false null hypothesis is accepted. - One-tailed tests check for deviations in one direction, while two-tailed tests check both directions. - The five steps of hypothesis testing are: formulating hypotheses, defining a test statistic, determining the statistic's distribution, defining a critical region, and making a decision using a p-value or test statistic.


![5G Explained! A High Level Overview [Introduction]](https://cdn.slidesharecdn.com/ss_thumbnails/5gexplainedahighleveloverview-260119165306-cc137a3e-thumbnail.jpg?width=640&height=640&fit=bounds)


