
Download to read offline

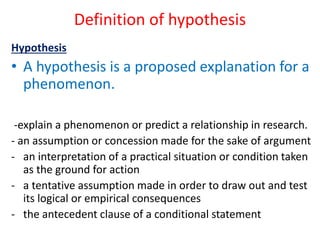
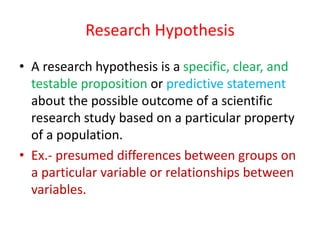
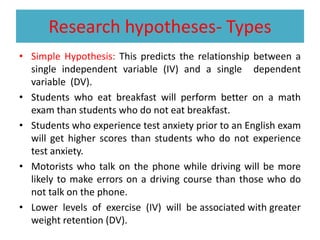
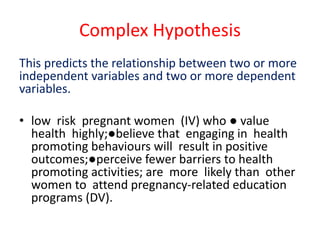
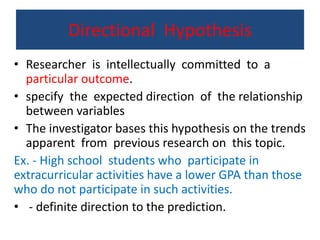
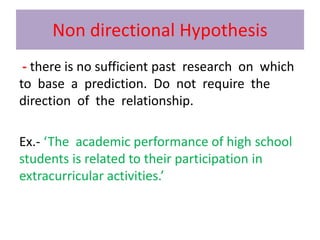
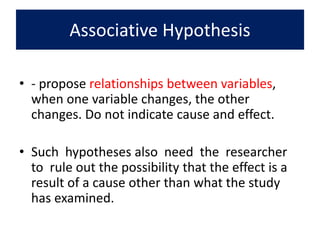
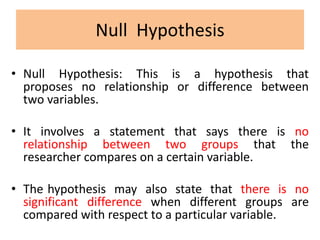
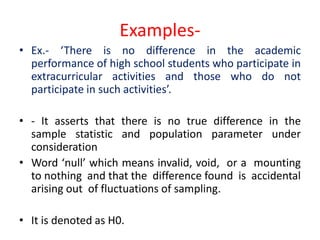
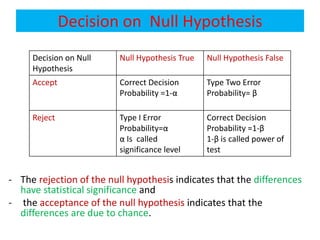
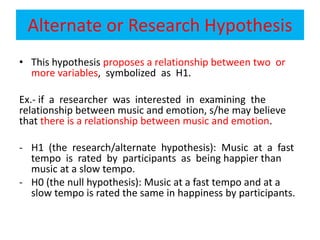


- A hypothesis is a proposed explanation for a phenomenon that can be tested. A research hypothesis makes a specific, testable prediction about the relationship between variables in a scientific study. - Hypotheses can be simple, predicting the relationship between one independent and one dependent variable, or complex, predicting relationships between multiple variables. They can also be directional, predicting a direction of relationship, or non-directional. - The null hypothesis proposes no relationship or difference between variables and is tested against the alternative or research hypothesis, which proposes an expected relationship. Statistical analysis determines whether to reject or fail to reject the null hypothesis.


