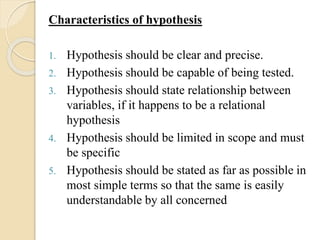
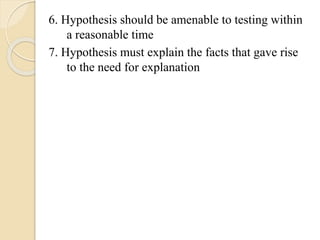
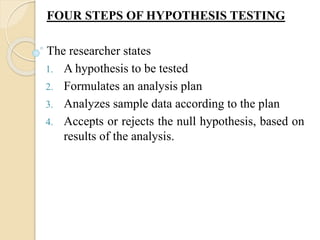
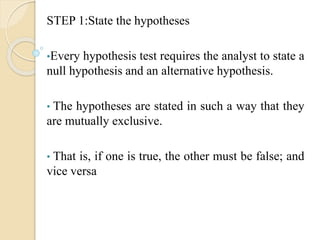
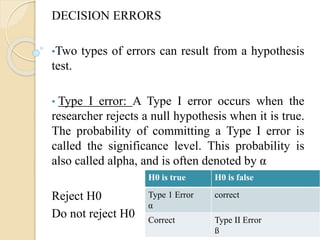
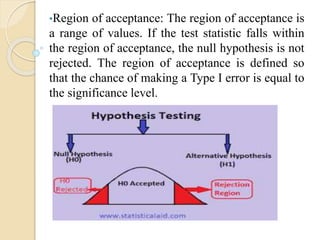
HYPOTHESIS TESTING
By: Dr Ilona
Asst Prof
•A statistical hypothesis is an assumption about a
population parameter.
•This assumption may or may not be true.
•The best way to determine whether a statistical
hypothesis is true would be to examine the entire
population.
•Since that is often impractical, researchers
typically examine a random sample from the
population
• If sample data are not consistent with the
statistical hypothesis, the hypothesis is rejected
•There are two types of statistical hypotheses.
Null hypothesis: The null hypothesis, denoted by
H0 , is usually the hypothesis that sample
observations result purely from chance.
Alternative hypothesis: The alternative hypothesis,
denoted by H1 or Ha , is the hypothesis that sample
observations are influenced by some non-random
cause. It is not due to chance.
•Statisticians follow a formal process to determine
whether to reject a null hypothesis, based on
sample data. This process, called hypothesis
testing, consists of four steps
Characteristics of hypothesis
1. Hypothesis should be clear and precise.
2. Hypothesis should be capable of being tested.
3. Hypothesis should state relationship between
variables, if it happens to be a relational
hypothesis
4. Hypothesis should be limited in scope and must
be specific
5. Hypothesis should be stated as far as possible in
most simple terms so that the same is easily
understandable by all concerned
6. Hypothesis should be amenable to testing within
a reasonable time
7. Hypothesis must explain the facts that gave rise
to the need for explanation
FOUR STEPS OF HYPOTHESIS TESTING
The researcher states
1. A hypothesis to be tested
2. Formulates an analysis plan
3. Analyzes sample data according to the plan
4. Accepts or rejects the null hypothesis, based on
results of the analysis.
STEP 1:State the hypotheses
•Every hypothesis test requires the analyst to state a
null hypothesis and an alternative hypothesis.
• The hypotheses are stated in such a way that they
are mutually exclusive.
• That is, if one is true, the other must be false; and
vice versa
STEP 2: Formulate an analysis plan
•The analysis plan describes how to use sample
data to accept or reject the null hypothesis.
•It should specify the following elements.
•The Level Of Significance : Often, researchers
choose significance levels equal to 0.01, 0.05, or
0.10; but any value between 0 and 1 can be used.
- Thus the significance level is the maximum value
of the probability of rejecting H0 when it is true
and is usually determined in advance before testing
the hypothesis
•Test method: t-score, chi-square, etc.
•If the test statistic probability is less than the
significance level, the null hypothesis is rejected
(or) if the calculated test statistic is more than the
critical value, the null hypothesis is rejected.
STEP 3: Analyse the sample data
•Test statistic is selected based on the type of data,
normality assumption, and homogeneity of
variance
STEP 4: Interpret Results
•Apply the decision rule described in the analysis
plan.
• If the value of the test statistic is unlikely, based
on the null hypothesis, reject the null hypothesis.
DECISION ERRORS
•Two types of errors can result from a hypothesis
test.
• Type I error: A Type I error occurs when the
researcher rejects a null hypothesis when it is true.
The probability of committing a Type I error is
called the significance level. This probability is
also called alpha, and is often denoted by α
Reject H0
Do not reject H0
H0 is true H0 is false
Type 1 Error
α
correct
Correct Type II Error
ß
•Type II error: A Type II error occurs when the
researcher fails to reject a null hypothesis that is
false. The probability of committing a Type II
error is called Beta, and is often denoted by β. The
probability of not committing a Type II error is
called the Power of the test.
•The analysis plan includes decision rules for
rejecting the null hypothesis.
•In practice, statisticians describe these decision
rules in two ways - with reference to a P-value or
with reference to a region of acceptance.
•P-value: The strength of evidence in support of a
null hypothesis is measured by the P-value.
Suppose the test statistic is equal to S. The P-value
is the probability of observing a test statistic as
extreme as S, assuming the null hypothesis is true.
If the P-value is less than the significance level, we
reject the null hypothesis.
•Region of acceptance: The region of acceptance is
a range of values. If the test statistic falls within
the region of acceptance, the null hypothesis is not
rejected. The region of acceptance is defined so
that the chance of making a Type I error is equal to
the significance level.
•The set of values outside the region of acceptance
is called the region of rejection. If the test statistic
falls within the region of rejection, the null
hypothesis is rejected. In such cases, we say that
the hypothesis has been rejected at the α level of
significance
One-Tailed and Two-Tailed Tests:
One-Tailed Tests
• A test of a statistical hypothesis, where the region
of rejection is on only one side of the sampling
distribution, is called a one-tailed test.
• For example, suppose the null hypothesis states
that the mean is less than or equal to 10.
• The alternative hypothesis would be that the mean
is greater than 10.
• The region of rejection would consist of a range
of numbers located on the right side of sampling
distribution; that is, a set of numbers greater than
10.
Two-Tailed Tests
 A test of a statistical hypothesis, where the
region of rejection is on both sides of the
sampling distribution, is called a two-tailed test.
 For example, suppose the null hypothesis states
that the mean is equal to 10.
 The alternative hypothesis would be that the
mean is less than 10 or greater than 10.
 The region of rejection would consist of a
range of numbers located on both sides of
sampling distribution; that is, the region of
rejection would consist partly of numbers that
were less than 10 and partly of numbers that
were greater than 10
Note:
 When null hypothesis is rejected– researcher
concludes that unlikely chance alone produce
observed difference– thus called significant
effect(not produced by chance)
 When Null hypothesis is not rejected—
researcher concludes its due to chance– not
significant
TESTS OF HYPOTHESES
(a) Parametric tests or standard tests of
hypotheses; and
(b) Non-parametric tests or distribution-free test
of hypotheses
Parametric tests are:
- Test include (1) z-test; (2) t-test 3) χ2 -test (4)
F-test
- The sample should be normally distributed
 LIMITATIONS OF THE TESTS OF
HYPOTHESES
1. The tests should not be used in a mechanical
fashion. Testing is not decision-making itself; the
tests are only useful aids for decision-making.
2. Test do not explain the reasons as to why does
the difference exist, say between the means of
the two samples
3. When a test shows that a difference is
statistically significant, then it simply suggests
that the difference is probably not due to chance
4. Statistical inferences based on the significance
tests cannot be said to be entirely correct
evidences concerning the truth of the hypotheses
 Thus, the inference techniques (or the tests)
must be combined with adequate knowledge of
the subject-matter along with the ability of good
judgement
 References:
1) C.R. Kothari. Research methodology
2) Portney. Research methodology
For detail online explanation contact
Dr.Ilona
watsapp numb-8722369286

hypothesis testing

  • 1.
  • 2.
    •A statistical hypothesisis an assumption about a population parameter. •This assumption may or may not be true. •The best way to determine whether a statistical hypothesis is true would be to examine the entire population. •Since that is often impractical, researchers typically examine a random sample from the population
  • 3.
    • If sampledata are not consistent with the statistical hypothesis, the hypothesis is rejected •There are two types of statistical hypotheses. Null hypothesis: The null hypothesis, denoted by H0 , is usually the hypothesis that sample observations result purely from chance. Alternative hypothesis: The alternative hypothesis, denoted by H1 or Ha , is the hypothesis that sample observations are influenced by some non-random cause. It is not due to chance.
  • 4.
    •Statisticians follow aformal process to determine whether to reject a null hypothesis, based on sample data. This process, called hypothesis testing, consists of four steps
  • 5.
    Characteristics of hypothesis 1.Hypothesis should be clear and precise. 2. Hypothesis should be capable of being tested. 3. Hypothesis should state relationship between variables, if it happens to be a relational hypothesis 4. Hypothesis should be limited in scope and must be specific 5. Hypothesis should be stated as far as possible in most simple terms so that the same is easily understandable by all concerned
  • 6.
    6. Hypothesis shouldbe amenable to testing within a reasonable time 7. Hypothesis must explain the facts that gave rise to the need for explanation
  • 7.
    FOUR STEPS OFHYPOTHESIS TESTING The researcher states 1. A hypothesis to be tested 2. Formulates an analysis plan 3. Analyzes sample data according to the plan 4. Accepts or rejects the null hypothesis, based on results of the analysis.
  • 8.
    STEP 1:State thehypotheses •Every hypothesis test requires the analyst to state a null hypothesis and an alternative hypothesis. • The hypotheses are stated in such a way that they are mutually exclusive. • That is, if one is true, the other must be false; and vice versa
  • 9.
    STEP 2: Formulatean analysis plan •The analysis plan describes how to use sample data to accept or reject the null hypothesis. •It should specify the following elements. •The Level Of Significance : Often, researchers choose significance levels equal to 0.01, 0.05, or 0.10; but any value between 0 and 1 can be used. - Thus the significance level is the maximum value of the probability of rejecting H0 when it is true and is usually determined in advance before testing the hypothesis
  • 10.
    •Test method: t-score,chi-square, etc. •If the test statistic probability is less than the significance level, the null hypothesis is rejected (or) if the calculated test statistic is more than the critical value, the null hypothesis is rejected.
  • 11.
    STEP 3: Analysethe sample data •Test statistic is selected based on the type of data, normality assumption, and homogeneity of variance
  • 12.
    STEP 4: InterpretResults •Apply the decision rule described in the analysis plan. • If the value of the test statistic is unlikely, based on the null hypothesis, reject the null hypothesis.
  • 13.
    DECISION ERRORS •Two typesof errors can result from a hypothesis test. • Type I error: A Type I error occurs when the researcher rejects a null hypothesis when it is true. The probability of committing a Type I error is called the significance level. This probability is also called alpha, and is often denoted by α Reject H0 Do not reject H0 H0 is true H0 is false Type 1 Error α correct Correct Type II Error ß
  • 14.
    •Type II error:A Type II error occurs when the researcher fails to reject a null hypothesis that is false. The probability of committing a Type II error is called Beta, and is often denoted by β. The probability of not committing a Type II error is called the Power of the test.
  • 15.
    •The analysis planincludes decision rules for rejecting the null hypothesis. •In practice, statisticians describe these decision rules in two ways - with reference to a P-value or with reference to a region of acceptance.
  • 16.
    •P-value: The strengthof evidence in support of a null hypothesis is measured by the P-value. Suppose the test statistic is equal to S. The P-value is the probability of observing a test statistic as extreme as S, assuming the null hypothesis is true. If the P-value is less than the significance level, we reject the null hypothesis.
  • 17.
    •Region of acceptance:The region of acceptance is a range of values. If the test statistic falls within the region of acceptance, the null hypothesis is not rejected. The region of acceptance is defined so that the chance of making a Type I error is equal to the significance level.
  • 18.
    •The set ofvalues outside the region of acceptance is called the region of rejection. If the test statistic falls within the region of rejection, the null hypothesis is rejected. In such cases, we say that the hypothesis has been rejected at the α level of significance
  • 19.
    One-Tailed and Two-TailedTests: One-Tailed Tests • A test of a statistical hypothesis, where the region of rejection is on only one side of the sampling distribution, is called a one-tailed test. • For example, suppose the null hypothesis states that the mean is less than or equal to 10. • The alternative hypothesis would be that the mean is greater than 10. • The region of rejection would consist of a range of numbers located on the right side of sampling distribution; that is, a set of numbers greater than 10.
  • 20.
    Two-Tailed Tests  Atest of a statistical hypothesis, where the region of rejection is on both sides of the sampling distribution, is called a two-tailed test.  For example, suppose the null hypothesis states that the mean is equal to 10.  The alternative hypothesis would be that the mean is less than 10 or greater than 10.  The region of rejection would consist of a range of numbers located on both sides of sampling distribution; that is, the region of rejection would consist partly of numbers that were less than 10 and partly of numbers that were greater than 10
  • 22.
    Note:  When nullhypothesis is rejected– researcher concludes that unlikely chance alone produce observed difference– thus called significant effect(not produced by chance)  When Null hypothesis is not rejected— researcher concludes its due to chance– not significant
  • 23.
    TESTS OF HYPOTHESES (a)Parametric tests or standard tests of hypotheses; and (b) Non-parametric tests or distribution-free test of hypotheses Parametric tests are: - Test include (1) z-test; (2) t-test 3) χ2 -test (4) F-test - The sample should be normally distributed
  • 24.
     LIMITATIONS OFTHE TESTS OF HYPOTHESES 1. The tests should not be used in a mechanical fashion. Testing is not decision-making itself; the tests are only useful aids for decision-making. 2. Test do not explain the reasons as to why does the difference exist, say between the means of the two samples 3. When a test shows that a difference is statistically significant, then it simply suggests that the difference is probably not due to chance 4. Statistical inferences based on the significance tests cannot be said to be entirely correct evidences concerning the truth of the hypotheses
  • 25.
     Thus, theinference techniques (or the tests) must be combined with adequate knowledge of the subject-matter along with the ability of good judgement
  • 26.
     References: 1) C.R.Kothari. Research methodology 2) Portney. Research methodology
  • 27.
    For detail onlineexplanation contact Dr.Ilona watsapp numb-8722369286