Introduction to Testing of Hypothesis with examples
1.
SRI RAMAKRISHNA ENGINEERINGCOLLEGE
[Educational Service: SNR Sons Charitable Trust]
[Autonomous Institution, Reaccredited by NAAC with ‘A+’ Grade]
[Approved by AICTE and Permanently Affiliated to Anna University, Chennai]
[ISO 9001:2015 Certified and all eligible programmes Accredited by NBA]
Vattamalaipalayam, N.G.G.O. Colony Post, Coimbatore – 641 022.
DEPARTMENT OF MATHEMATICS
Testing of
Hypothesis
Dr.R.Kasthuri
Assistant Professor (Sl.G)
Department of Mathematics
Sri Ramakrishna Engineering College
2.
Introduction
Sampling theory isa study of relationships existing
between a population and samples drawn from the
population.
A population is finite or infinite if the collection
contains finite or infinite elements.
For example, the marks of students in a class will
constitute a finite population whereas the pressure at
every point of the atmosphere will constitute an
infinite population.
A finite subset of a population is called a sample and
the process of selection of such samples is called
sampling.
x
3.
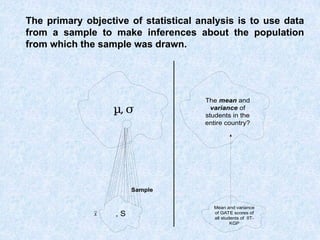
The primary objectiveof statistical analysis is to use data
from a sample to make inferences about the population
from which the sample was drawn.
µ,σ
, S
Sample
Mean and variance
of GATE scores of
all students of IIT-
KGP
The mean and
variance of
students in the
entire country?
x
4.
PARAMETERS AND STATISTICS
Thestatistical constants of the population such as the mean, the variance etc are known as theparameters.
The statistical constants of the sample computed from the members or observations of the sample to estimate the parameters of the population from which the sample has been drawn are known asstatistics.
Poulation mean and variance are normally refered by µ and σ2
while those of the sample are refered by (sample mean)
Ẍ and s2
(sample variance).
5.
TEST OF SIGNIFICANCE
Theaspect of sampling theory is to study the tests of
significance, which enable to decide on the basics of the
results of the samples, whether
1) the deviation between the observed sample statistics
and the hypothetical parameter value (or)
2) the deviation between two sample statistics is
significant (or) might be attributed due to chance (or)
fluctuations of the sampling.
6.
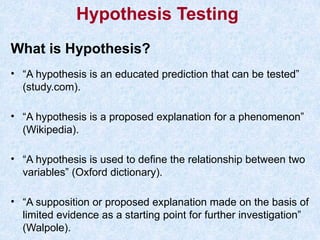
What is Hypothesis?
•“A hypothesis is an educated prediction that can be tested”
(study.com).
• “A hypothesis is a proposed explanation for a phenomenon”
(Wikipedia).
• “A hypothesis is used to define the relationship between two
variables” (Oxford dictionary).
• “A supposition or proposed explanation made on the basis of
limited evidence as a starting point for further investigation”
(Walpole).
Hypothesis Testing
7.
Testing of Hypothesis
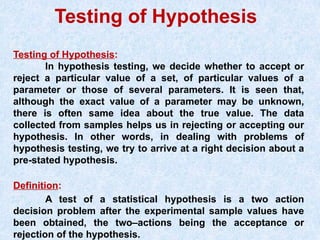
Testingof Hypothesis:
In hypothesis testing, we decide whether to accept or
reject a particular value of a set, of particular values of a
parameter or those of several parameters. It is seen that,
although the exact value of a parameter may be unknown,
there is often same idea about the true value. The data
collected from samples helps us in rejecting or accepting our
hypothesis. In other words, in dealing with problems of
hypothesis testing, we try to arrive at a right decision about a
pre-stated hypothesis.
Definition:
A test of a statistical hypothesis is a two action
decision problem after the experimental sample values have
been obtained, the two–actions being the acceptance or
rejection of the hypothesis.
8.
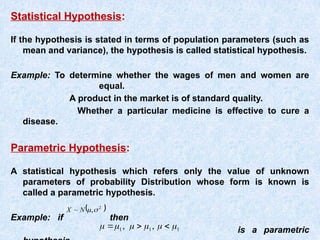
Statistical Hypothesis:
If thehypothesis is stated in terms of population parameters (such as
mean and variance), the hypothesis is called statistical hypothesis.
Example: To determine whether the wages of men and women are
equal.
A product in the market is of standard quality.
Whether a particular medicine is effective to cure a
disease.
Parametric Hypothesis:
A statistical hypothesis which refers only the value of unknown
parameters of probability Distribution whose form is known is
called a parametric hypothesis.
Example: if then
is a parametric
2
,
~
N
X
1
1
1 ,
,
9.
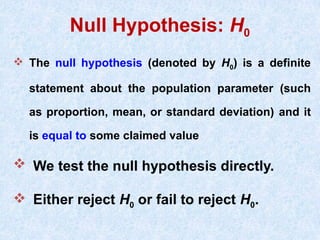
Null Hypothesis: H0
The null hypothesis (denoted by H0) is a definite
statement about the population parameter (such
as proportion, mean, or standard deviation) and it
is equal to some claimed value
We test the null hypothesis directly.
Either reject H0 or fail to reject H0.
10.
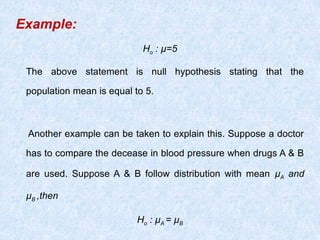
Example:
Ho : µ=5
Theabove statement is null hypothesis stating that the
population mean is equal to 5.
Another example can be taken to explain this. Suppose a doctor
has to compare the decease in blood pressure when drugs A & B
are used. Suppose A & B follow distribution with mean µA and
µB ,then
Ho : µA = µB
11.
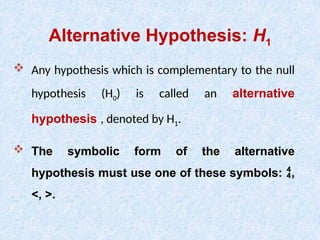
Alternative Hypothesis: H1
Any hypothesis which is complementary to the null
hypothesis (H0) is called an alternative
hypothesis , denoted by H1.
The symbolic form of the alternative
hypothesis must use one of these symbols: ,
<, >.
12.
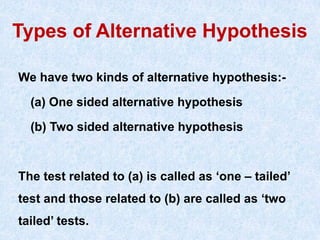
Types of AlternativeHypothesis
We have two kinds of alternative hypothesis:-
(a) One sided alternative hypothesis
(b) Two sided alternative hypothesis
The test related to (a) is called as ‘one – tailed’
test and those related to (b) are called as ‘two
tailed’ tests.
13.
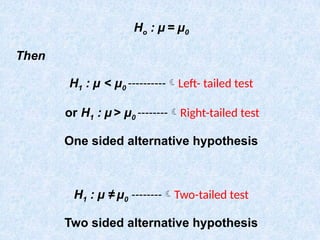
Ho : µ= µ0
Then
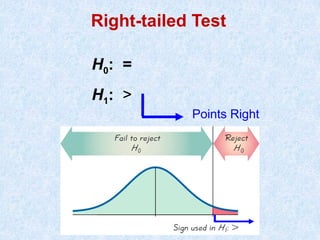
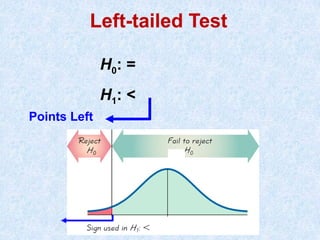
H1 : µ < µ0 ----------Left- tailed test
or H1 : µ > µ0 --------Right-tailed test
One sided alternative hypothesis
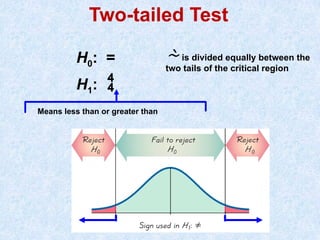
H1 : µ ≠ µ0 --------Two-tailed test
Two sided alternative hypothesis
14.
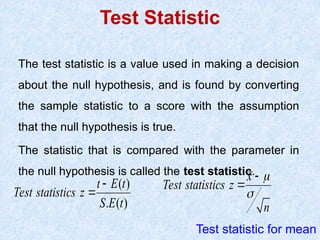
Test Statistic
The teststatistic is a value used in making a decision
about the null hypothesis, and is found by converting
the sample statistic to a score with the assumption
that the null hypothesis is true.
The statistic that is compared with the parameter in
the null hypothesis is called the test statistic.
( )
. ( )
Test statistics
t E t
z
S E t
Test statistic for mean
Test statist
x
i s z
n
c
15.
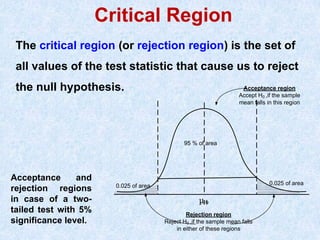
Critical Region
The criticalregion (or rejection region) is the set of
all values of the test statistic that cause us to reject
the null hypothesis.
Acceptance and
rejection regions
in case of a two-
tailed test with 5%
significance level.
µH0
Rejection region
Reject H0 ,if the sample mean falls
in either of these regions
95 % of area
Acceptance region
Accept H0 ,if the sample
mean falls in this region
0.025 of area
0.025 of area
16.
Significance Level
The significancelevel (denoted by ) is the
probability that the test statistic will fall in the
critical region when the null hypothesis is
actually true. Common choices for are
0.05, 0.01, and 0.10.
17.
Critical Value
A criticalvalue is any value that separates the
critical region (where we reject the null
hypothesis) from the values of the test
statistic that do not lead to rejection of the null
hypothesis. The critical values depend on the
nature of the null hypothesis, the sampling
distribution that applies, and the significance
level .
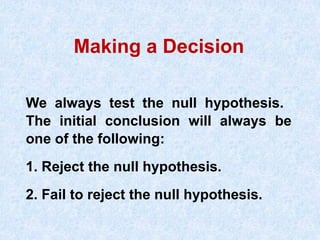
We always testthe null hypothesis.
The initial conclusion will always be
one of the following:
1. Reject the null hypothesis.
2. Fail to reject the null hypothesis.
Making a Decision
23.
Traditional method
Reject H0if the test statistic falls
within the critical region.
Fail to reject H0 if the test statistic
does not fall within the critical
region.
Decision Criterion
24.
Type I Error
AType I error is the mistake of rejecting the null
hypothesis when it is true.
This is similar to a good product being rejected by
the consumer and
hence Type-I error is known as producer’s risk.
The symbol (alpha) is used to represent the
probability of a type I error.
(i.e)P[Reject a lot when it is good] = α
25.
Type II Error
A Type II error is the mistake of failing to reject
the null hypothesis when it is false, it is known
as consumer’s risk.
The symbol (beta) is used to represent the
probability of a type II error.
(i.e) P[accept a lot when it is bad] = β
26.
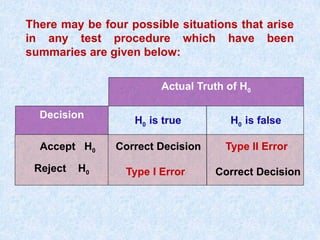
Actual Truth ofH0
H0 is true H0 is false
Accept H0
Reject H0
Correct Decision
Correct Decision
Type II Error
Type I Error
Decision
There may be four possible situations that arise
in any test procedure which have been
summaries are given below:
27.
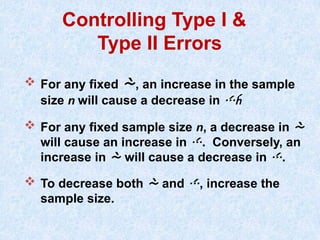
Controlling Type I&
Type II Errors
For any fixed , an increase in the sample
size n will cause a decrease in
For any fixed sample size n, a decrease in
will cause an increase in . Conversely, an
increase in will cause a decrease in .
To decrease both and , increase the
sample size.
Interpreting a Decision
Example:
H0:(Claim) "The average website visitor count is 100."
If H0 is rejected, you should conclude “The observed
data is unlikely to have occurred by chance.”
If you fail to reject H0, you should conclude “there is not
sufficient evidence to to reject it based on the current
data.”
![SRI RAMAKRISHNA ENGINEERING COLLEGE
[Educational Service: SNR Sons Charitable Trust]
[Autonomous Institution, Reaccredited by NAAC with ‘A+’ Grade]
[Approved by AICTE and Permanently Affiliated to Anna University, Chennai]
[ISO 9001:2015 Certified and all eligible programmes Accredited by NBA]
Vattamalaipalayam, N.G.G.O. Colony Post, Coimbatore – 641 022.
DEPARTMENT OF MATHEMATICS
Testing of
Hypothesis
Dr.R.Kasthuri
Assistant Professor (Sl.G)
Department of Mathematics
Sri Ramakrishna Engineering College](https://image.slidesharecdn.com/testingofhypothesis-250726053132-8c040e47/85/Introduction-to-Testing-of-Hypothesis-with-examples-1-320.jpg)
![SRI RAMAKRISHNA ENGINEERING COLLEGE
[Educational Service: SNR Sons Charitable Trust]
[Autonomous Institution, Reaccredited by NAAC with ‘A+’ Grade]
[Approved by AICTE and Permanently Affiliated to Anna University, Chennai]
[ISO 9001:2015 Certified and all eligible programmes Accredited by NBA]
Vattamalaipalayam, N.G.G.O. Colony Post, Coimbatore – 641 022.
DEPARTMENT OF MATHEMATICS
Testing of
Hypothesis
Dr.R.Kasthuri
Assistant Professor (Sl.G)
Department of Mathematics
Sri Ramakrishna Engineering College](https://image.slidesharecdn.com/testingofhypothesis-250726053132-8c040e47/75/Introduction-to-Testing-of-Hypothesis-with-examples-1-2048.jpg)


![Type I Error
A Type I error is the mistake of rejecting the null
hypothesis when it is true.
This is similar to a good product being rejected by
the consumer and
hence Type-I error is known as producer’s risk.
The symbol (alpha) is used to represent the
probability of a type I error.
(i.e)P[Reject a lot when it is good] = α](https://image.slidesharecdn.com/testingofhypothesis-250726053132-8c040e47/85/Introduction-to-Testing-of-Hypothesis-with-examples-24-320.jpg)
![Type II Error
A Type II error is the mistake of failing to reject
the null hypothesis when it is false, it is known
as consumer’s risk.
The symbol (beta) is used to represent the
probability of a type II error.
(i.e) P[accept a lot when it is bad] = β](https://image.slidesharecdn.com/testingofhypothesis-250726053132-8c040e47/85/Introduction-to-Testing-of-Hypothesis-with-examples-25-320.jpg)