SlideShare a Scribd company logo
What is Hypothesis Testing?
 In hypothesis testing, relatively small samples are
used to answer questions about population
parameters (inferential statistics)
 There is always a chance that the selected sample
is not representative of the population; therefore,
there is always a chance that the conclusion
obtained is wrong
 With some assumptions, inferential statistics
allows the estimation of the probability of getting
an “odd” sample and quantifies the probability (p-
value) of a wrong conclusion
Hypothesis Testing–Introduction
- Refers to the use of statistical analysis to determine if
observed differences between two or more data samples
are due to random chance or to be true differences in the
samples
- Increase your confidence that probable X’s are
statistically significant
- Used when you need to be confident that a statistical
difference exists
Hypothesis Testing For Equal Means
 The histograms below show the height of inhabitants of
countries A and B.
 Both samples are of size 100, the scale is the same, and
the unit of measurement is inches.
 Question: Is the population of country B, on average,
taller than that of country A?
Country A
Country B
[inch]
60.0 62.0 64.0 66.0 68.0 70.0 72.0 74.0 76.0 78.0 80.0
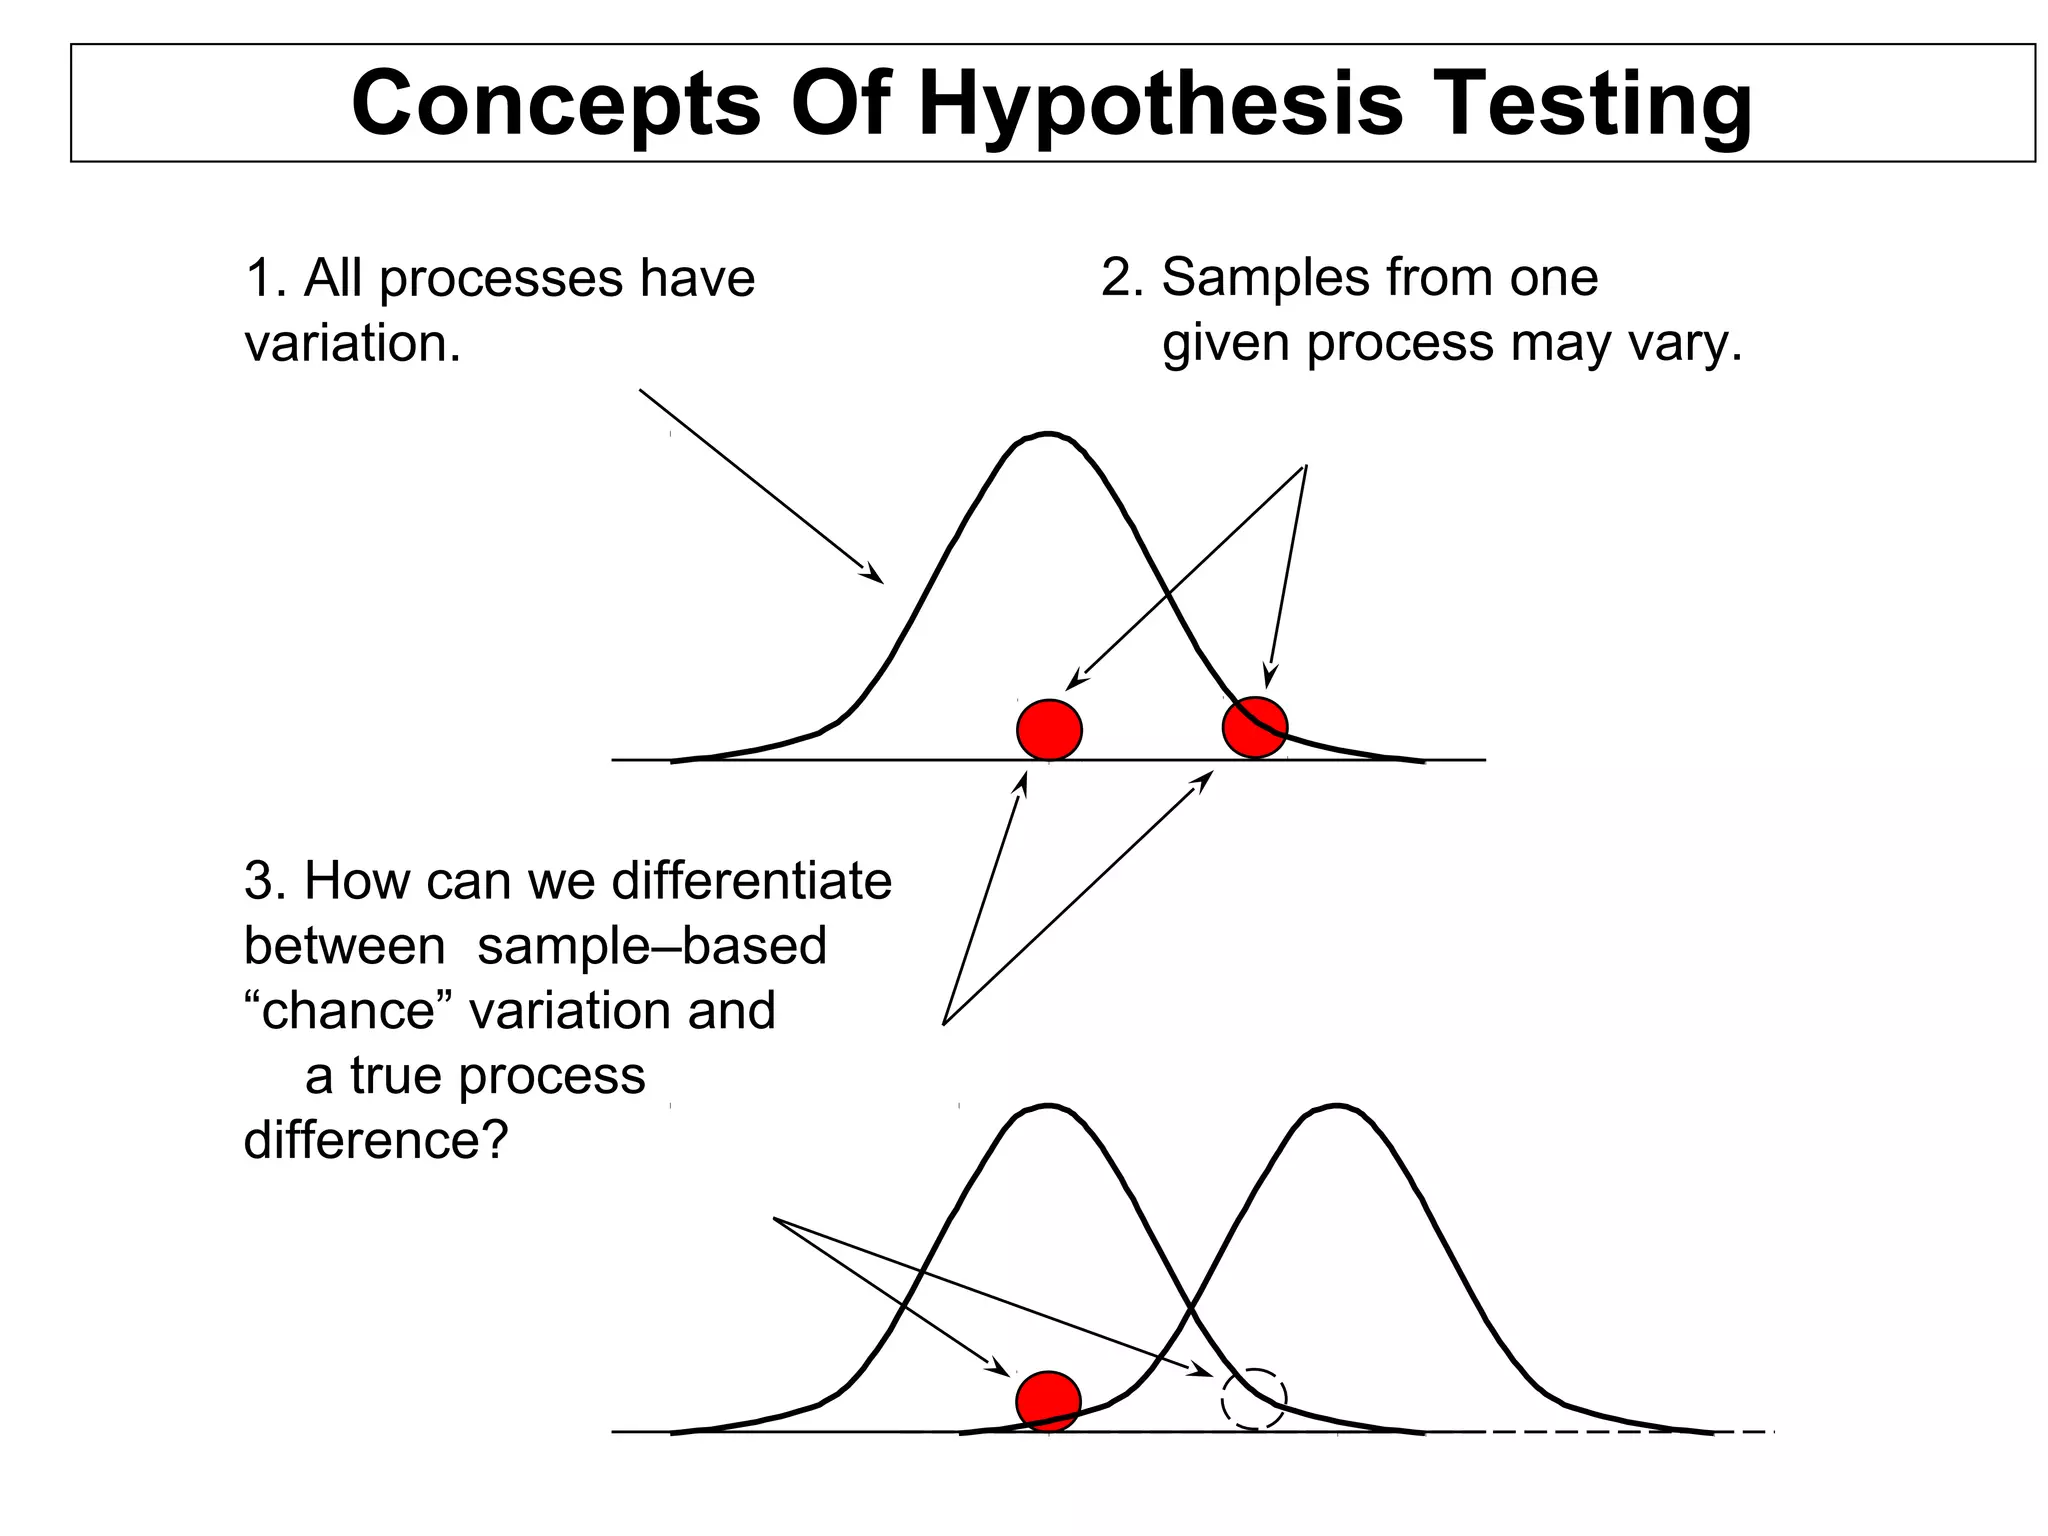
Concepts Of Hypothesis Testing
1. All processes have
variation.
2. Samples from one
given process may vary.
3. How can we differentiate
between sample–based
“chance” variation and
a true process
difference?
Kinds Of Differences
Continuous data:
- Differences in averages
- Differences in variation
- Differences in distribution
“shape” of values
Discrete data:
- Differences in proportions
Hypothesis Testing
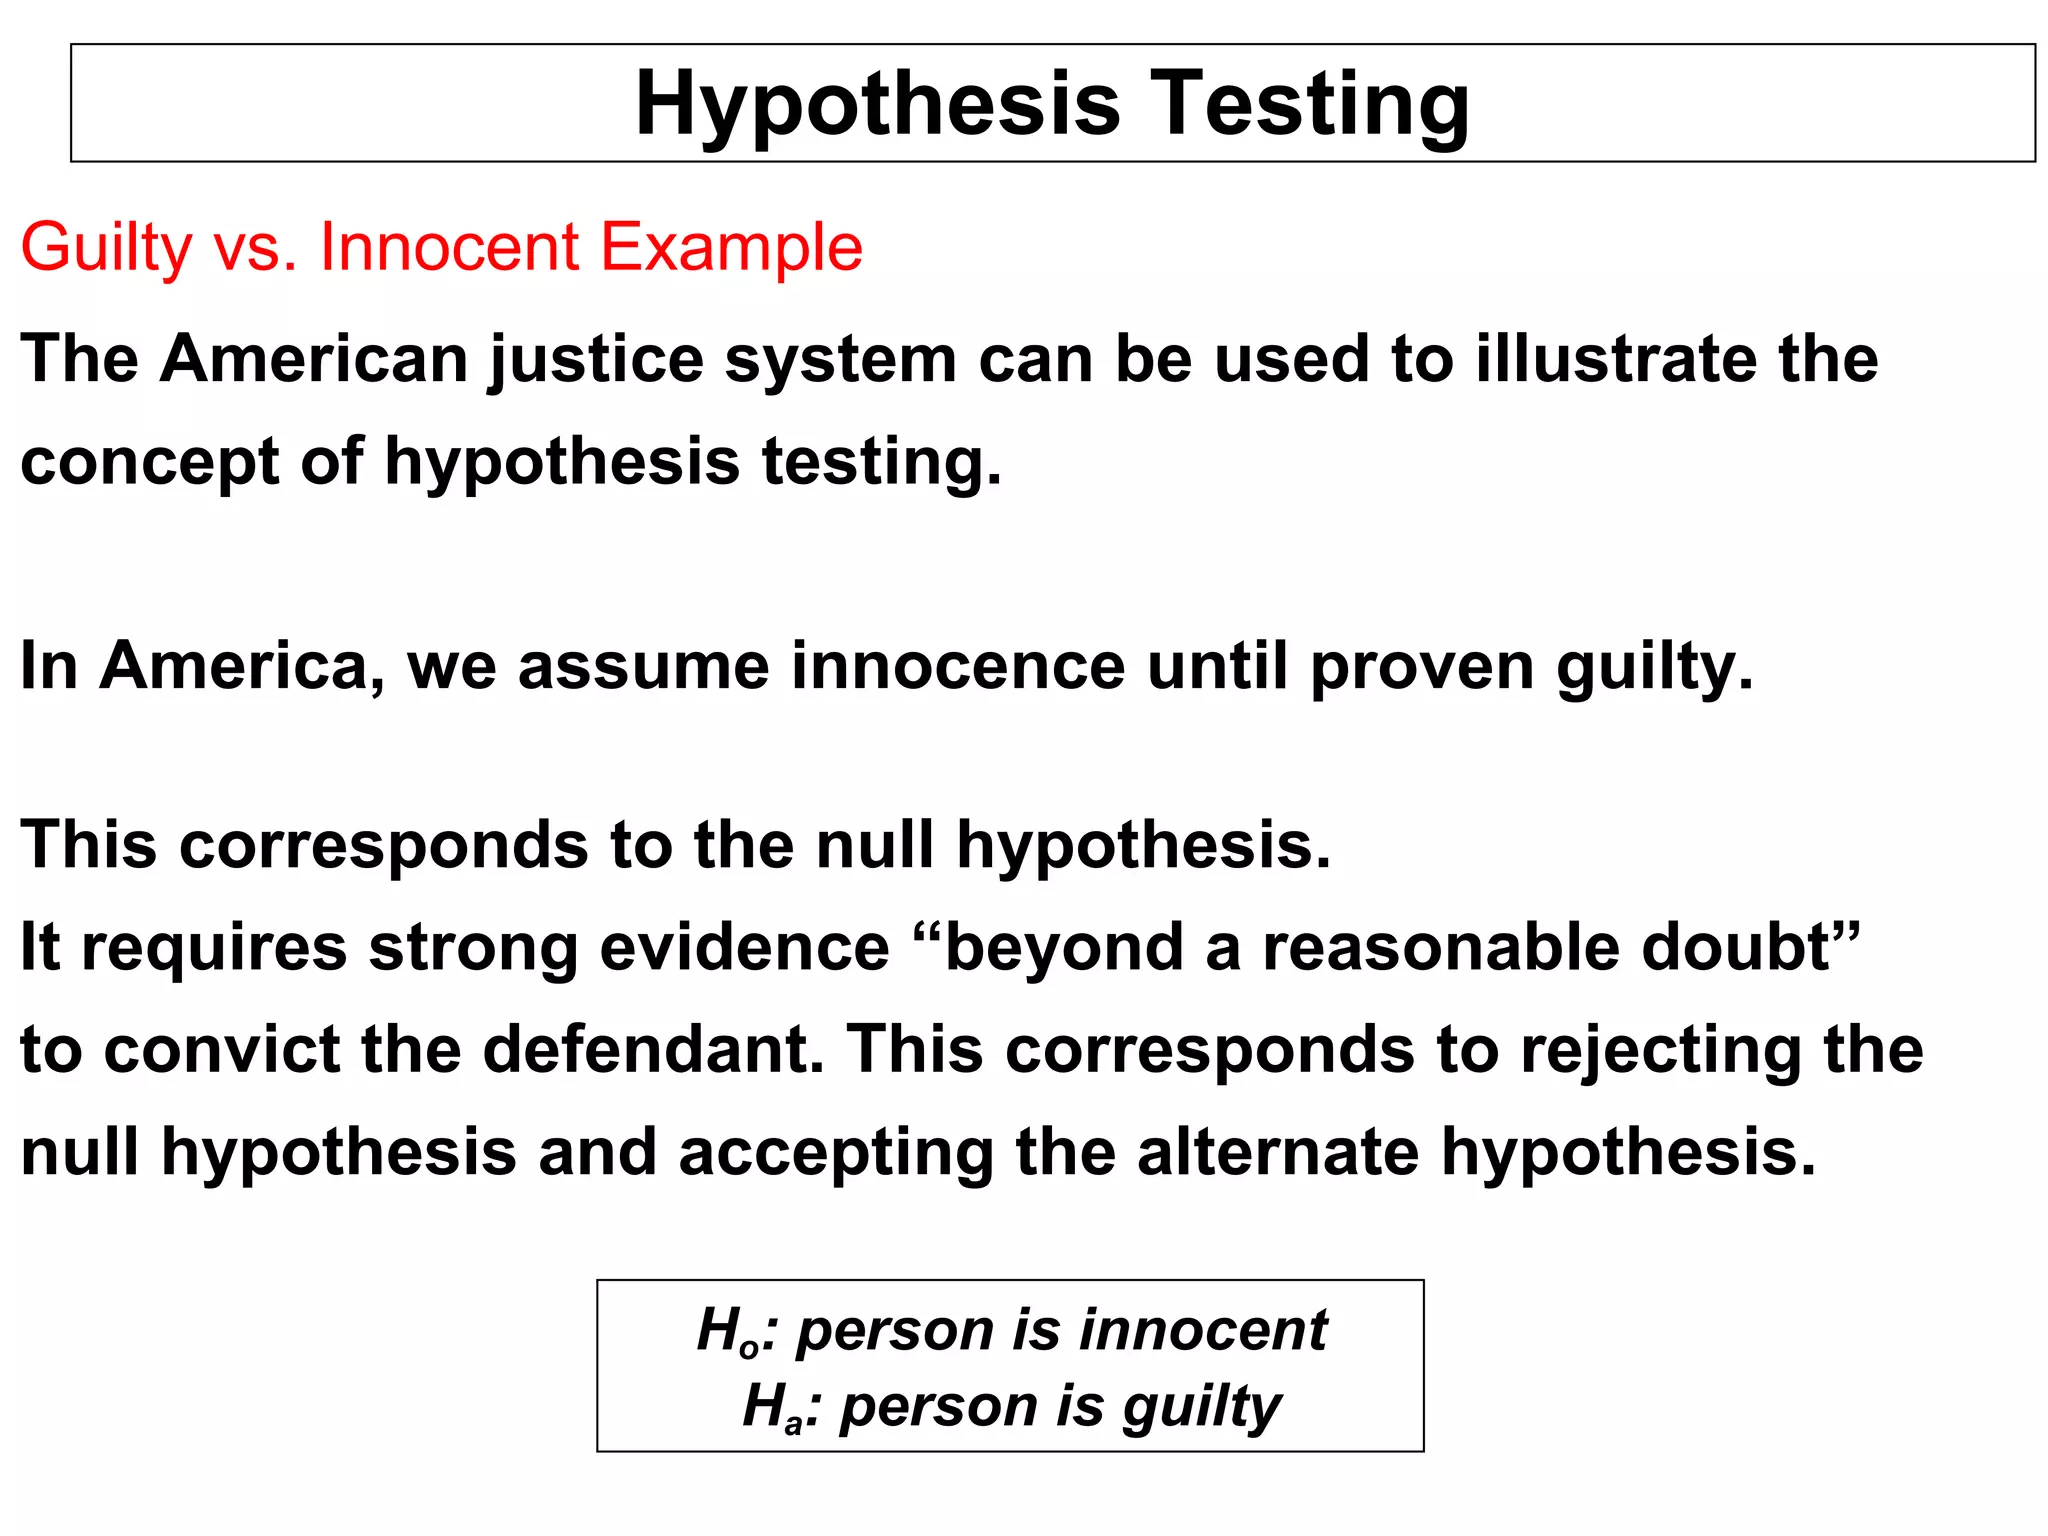
Guilty vs. Innocent Example
The American justice system can be used to illustrate the
concept of hypothesis testing.
In America, we assume innocence until proven guilty.
This corresponds to the null hypothesis.
It requires strong evidence “beyond a reasonable doubt”
to convict the defendant. This corresponds to rejecting the
null hypothesis and accepting the alternate hypothesis.
Ho: person is innocent
Ha: person is guilty
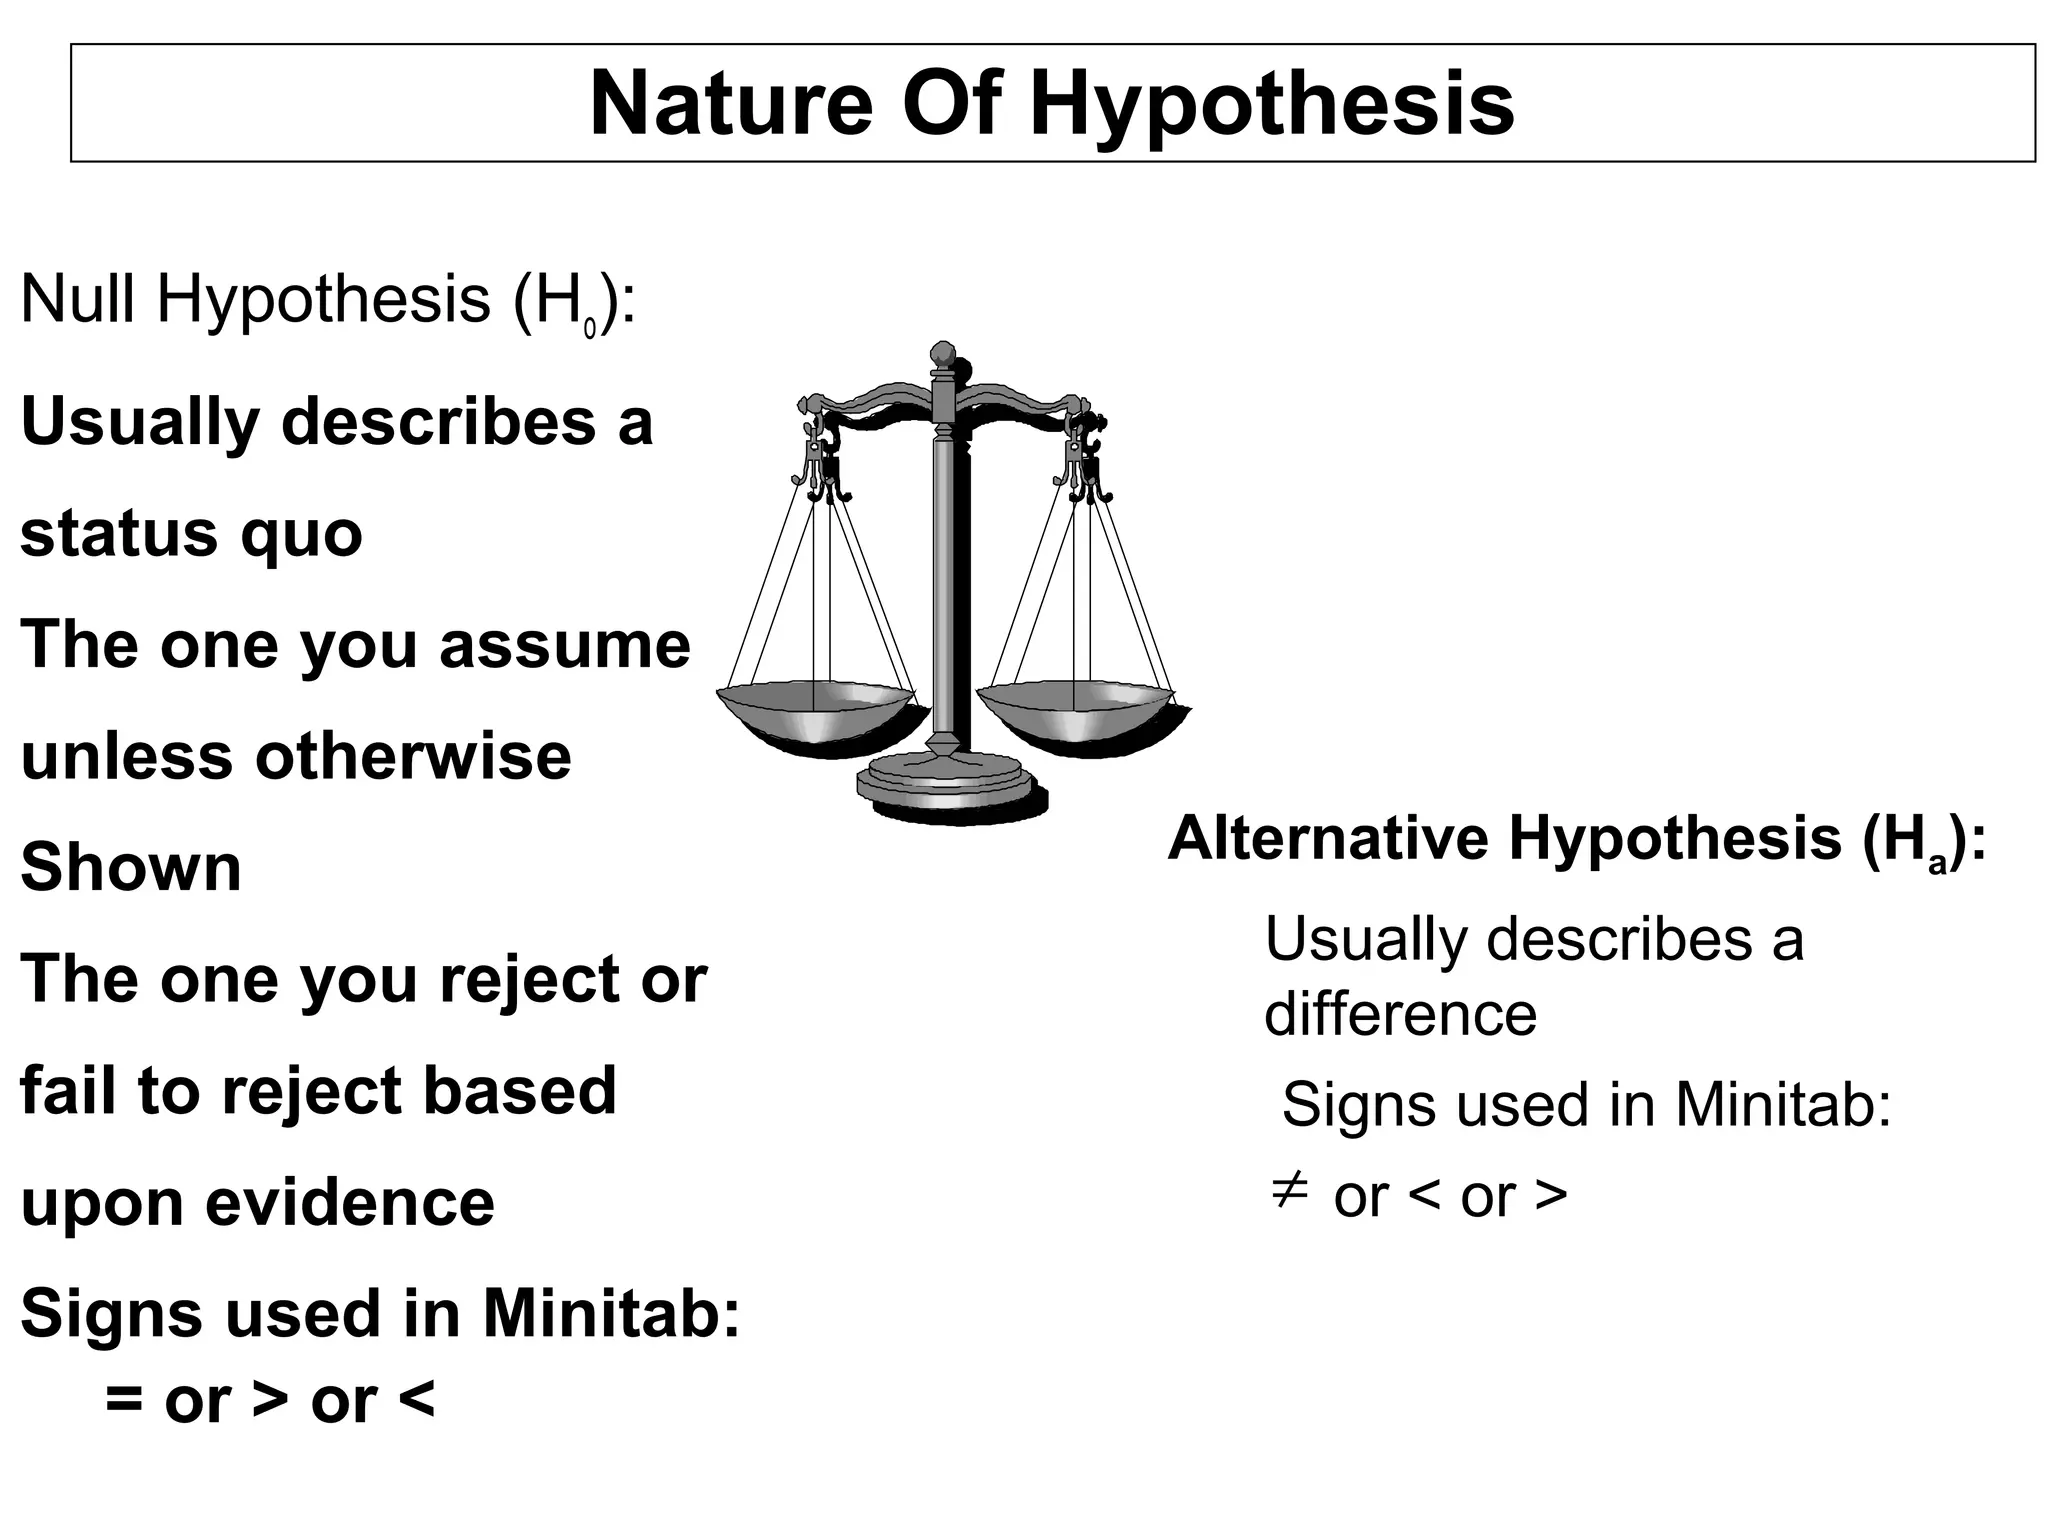
Nature Of Hypothesis
Null Hypothesis (Ho):
Usually describes a
status quo
The one you assume
unless otherwise
Shown
The one you reject or
fail to reject based
upon evidence
Signs used in Minitab:
= or > or <
Alternative Hypothesis (Ha):
Usually describes a
difference
Signs used in Minitab:
or < or >≠
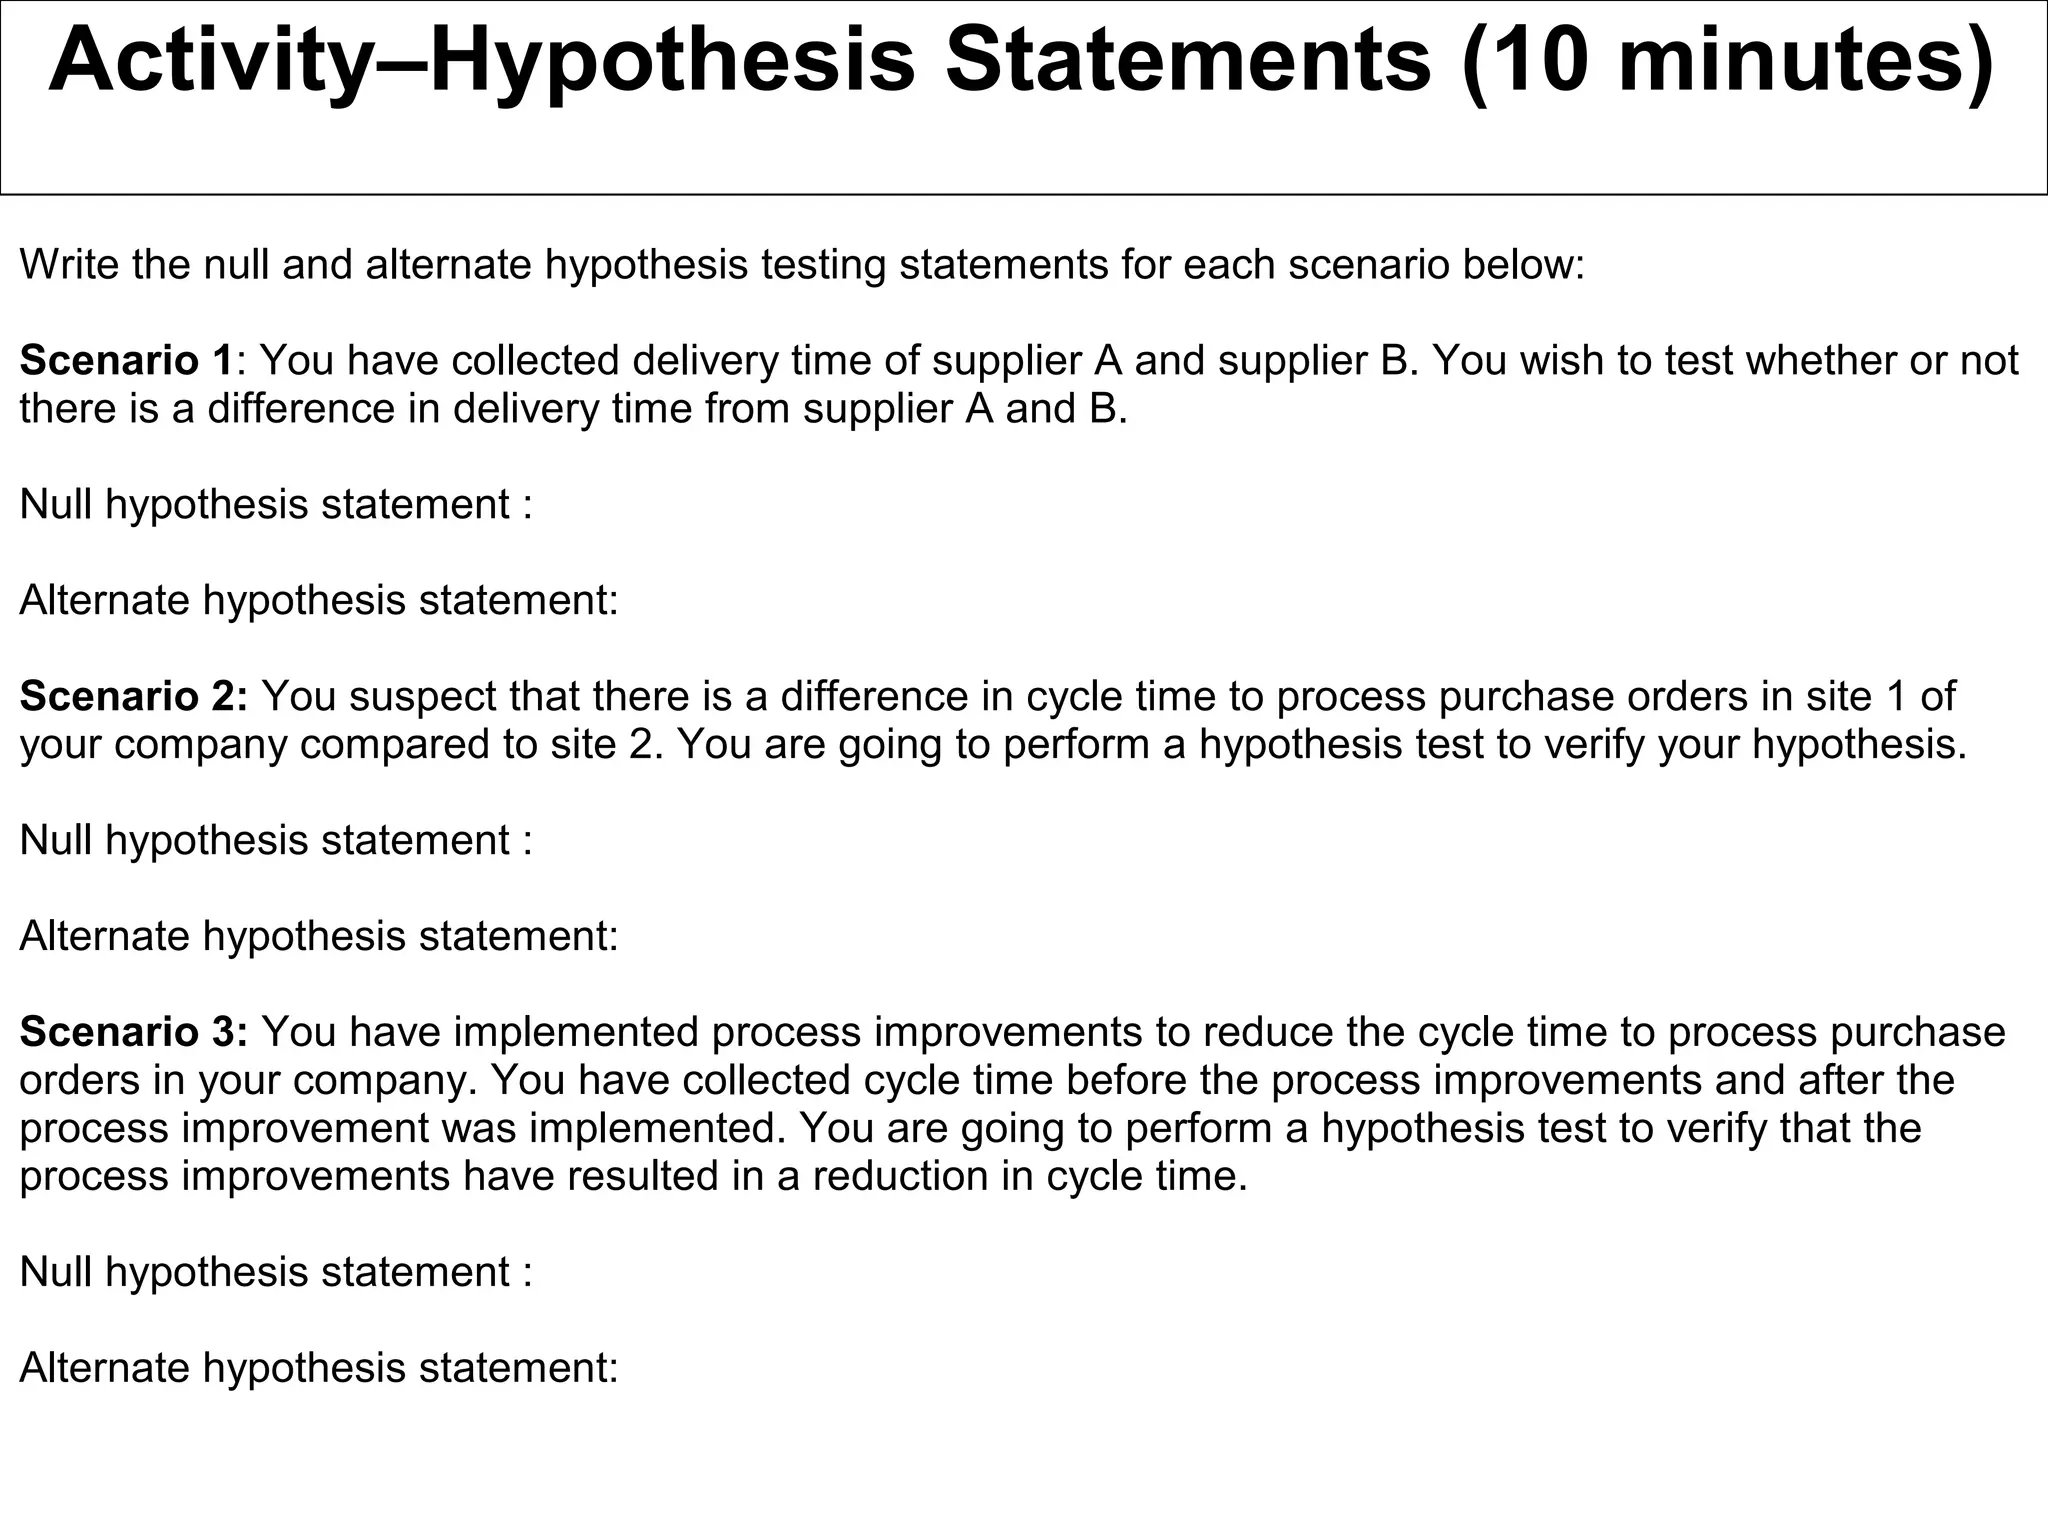
Activity–Hypothesis Statements (10 minutes)
Write the null and alternate hypothesis testing statements for each scenario below:
Scenario 1: You have collected delivery time of supplier A and supplier B. You wish to test whether or not
there is a difference in delivery time from supplier A and B.
Null hypothesis statement :
Alternate hypothesis statement:
Scenario 2: You suspect that there is a difference in cycle time to process purchase orders in site 1 of
your company compared to site 2. You are going to perform a hypothesis test to verify your hypothesis.
Null hypothesis statement :
Alternate hypothesis statement:
Scenario 3: You have implemented process improvements to reduce the cycle time to process purchase
orders in your company. You have collected cycle time before the process improvements and after the
process improvement was implemented. You are going to perform a hypothesis test to verify that the
process improvements have resulted in a reduction in cycle time.
Null hypothesis statement :
Alternate hypothesis statement:
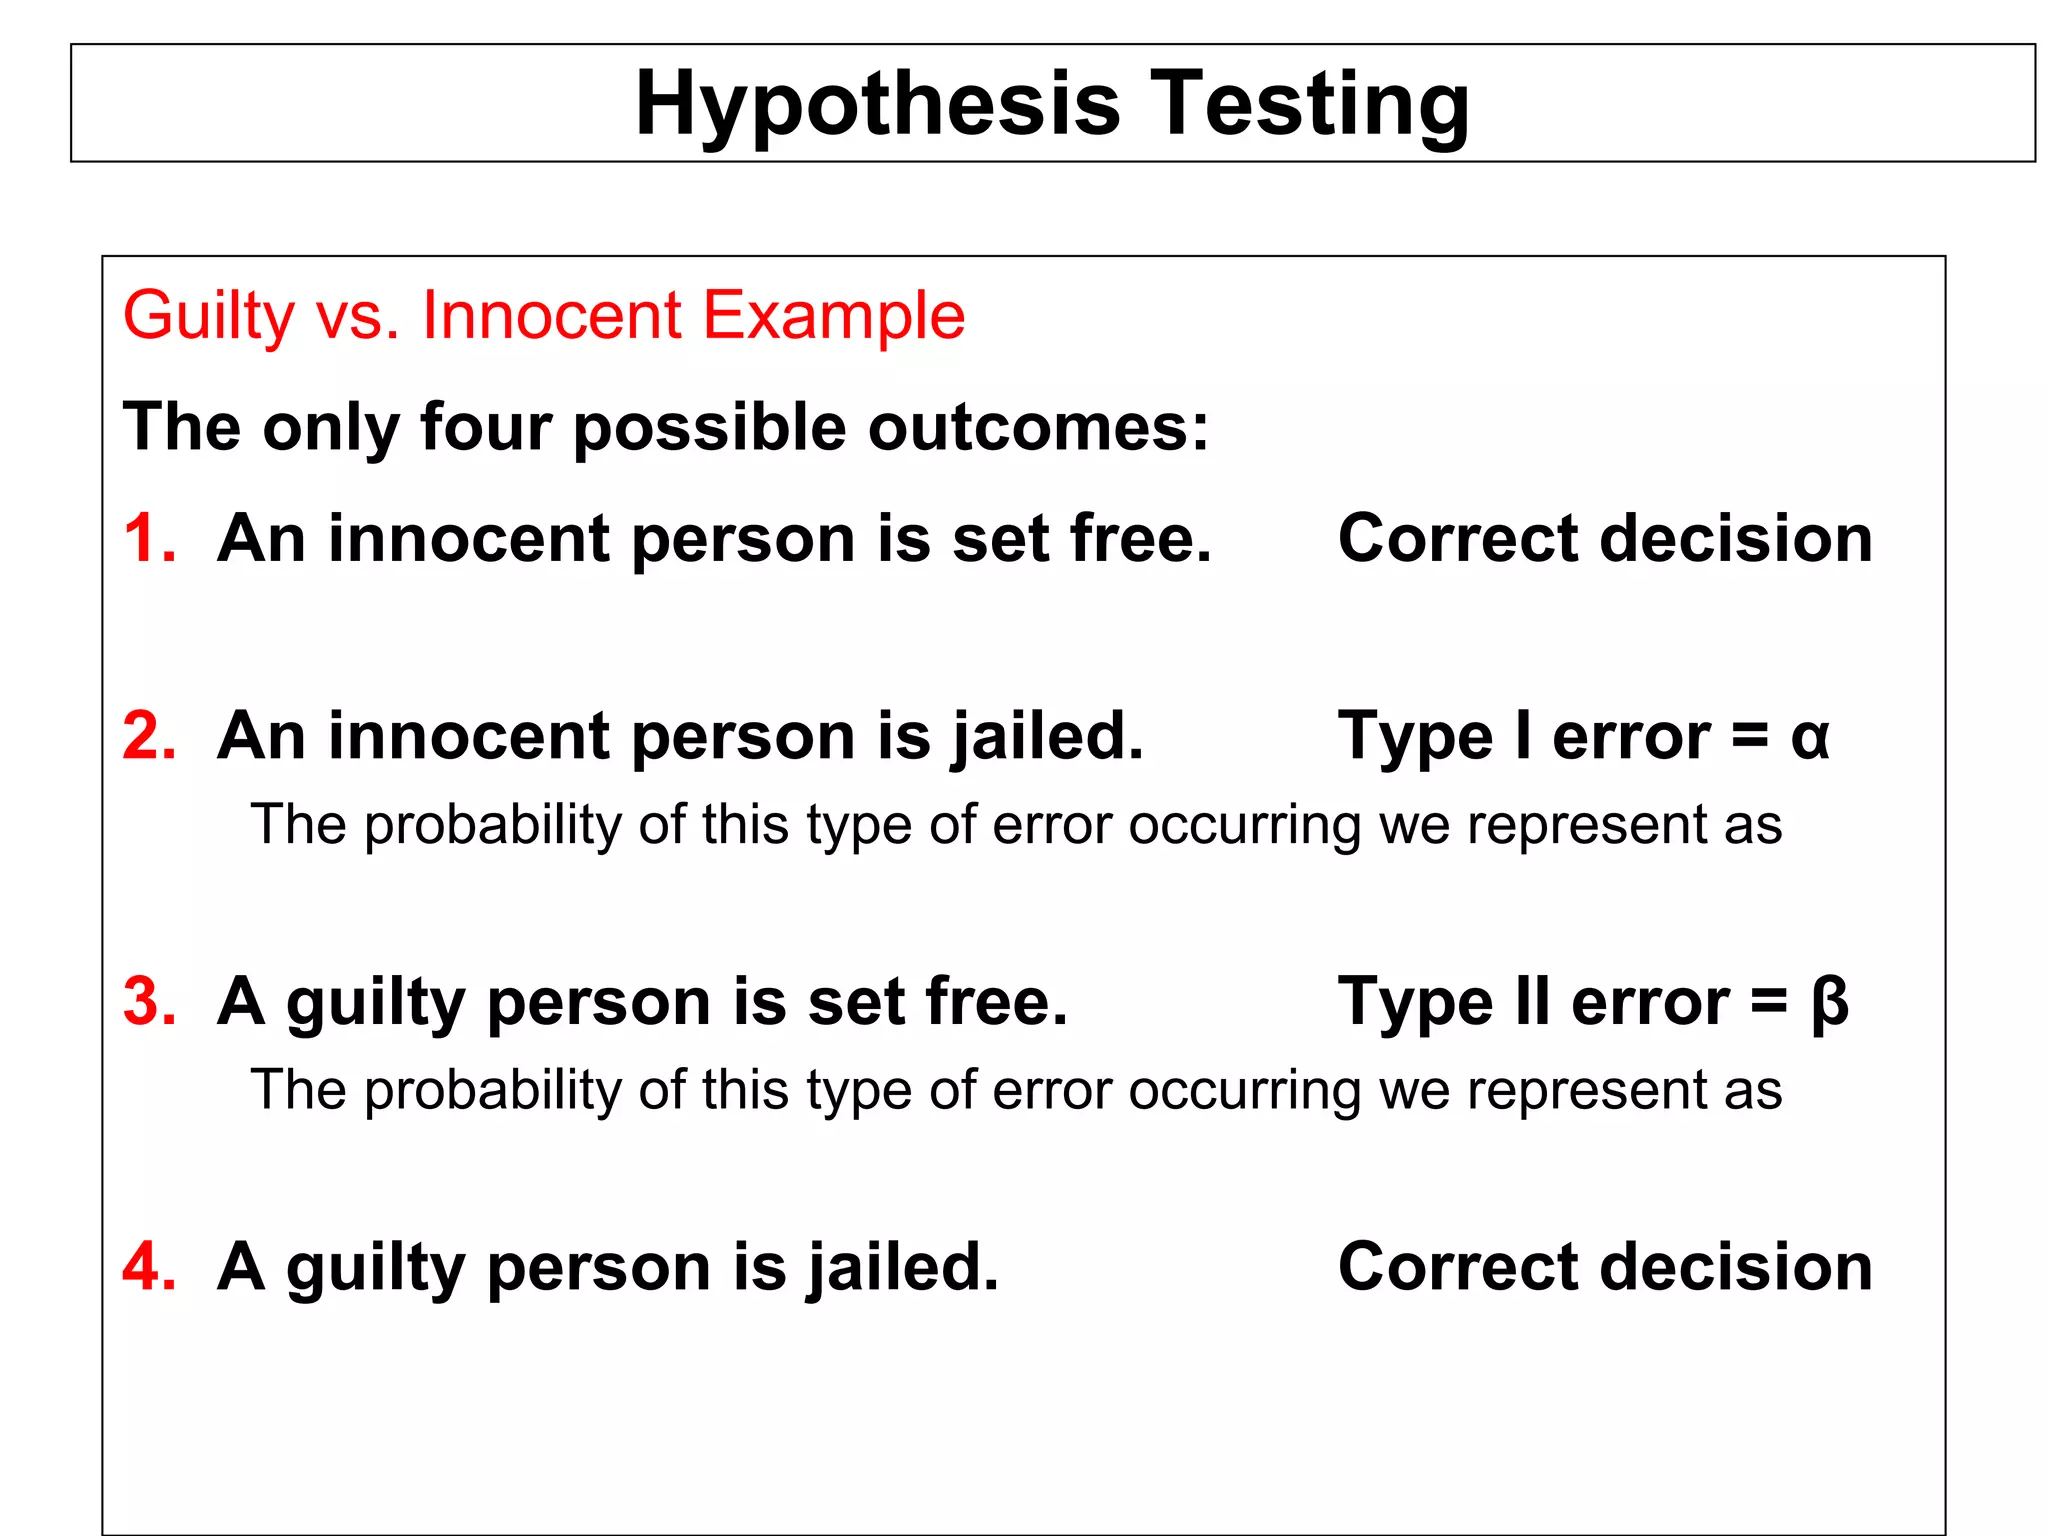
Hypothesis Testing
Guilty vs. Innocent Example
The only four possible outcomes:
1. An innocent person is set free. Correct decision
2. An innocent person is jailed. Type I error = α
The probability of this type of error occurring we represent as
3. A guilty person is set free. Type II error = β
The probability of this type of error occurring we represent as
4. A guilty person is jailed. Correct decision
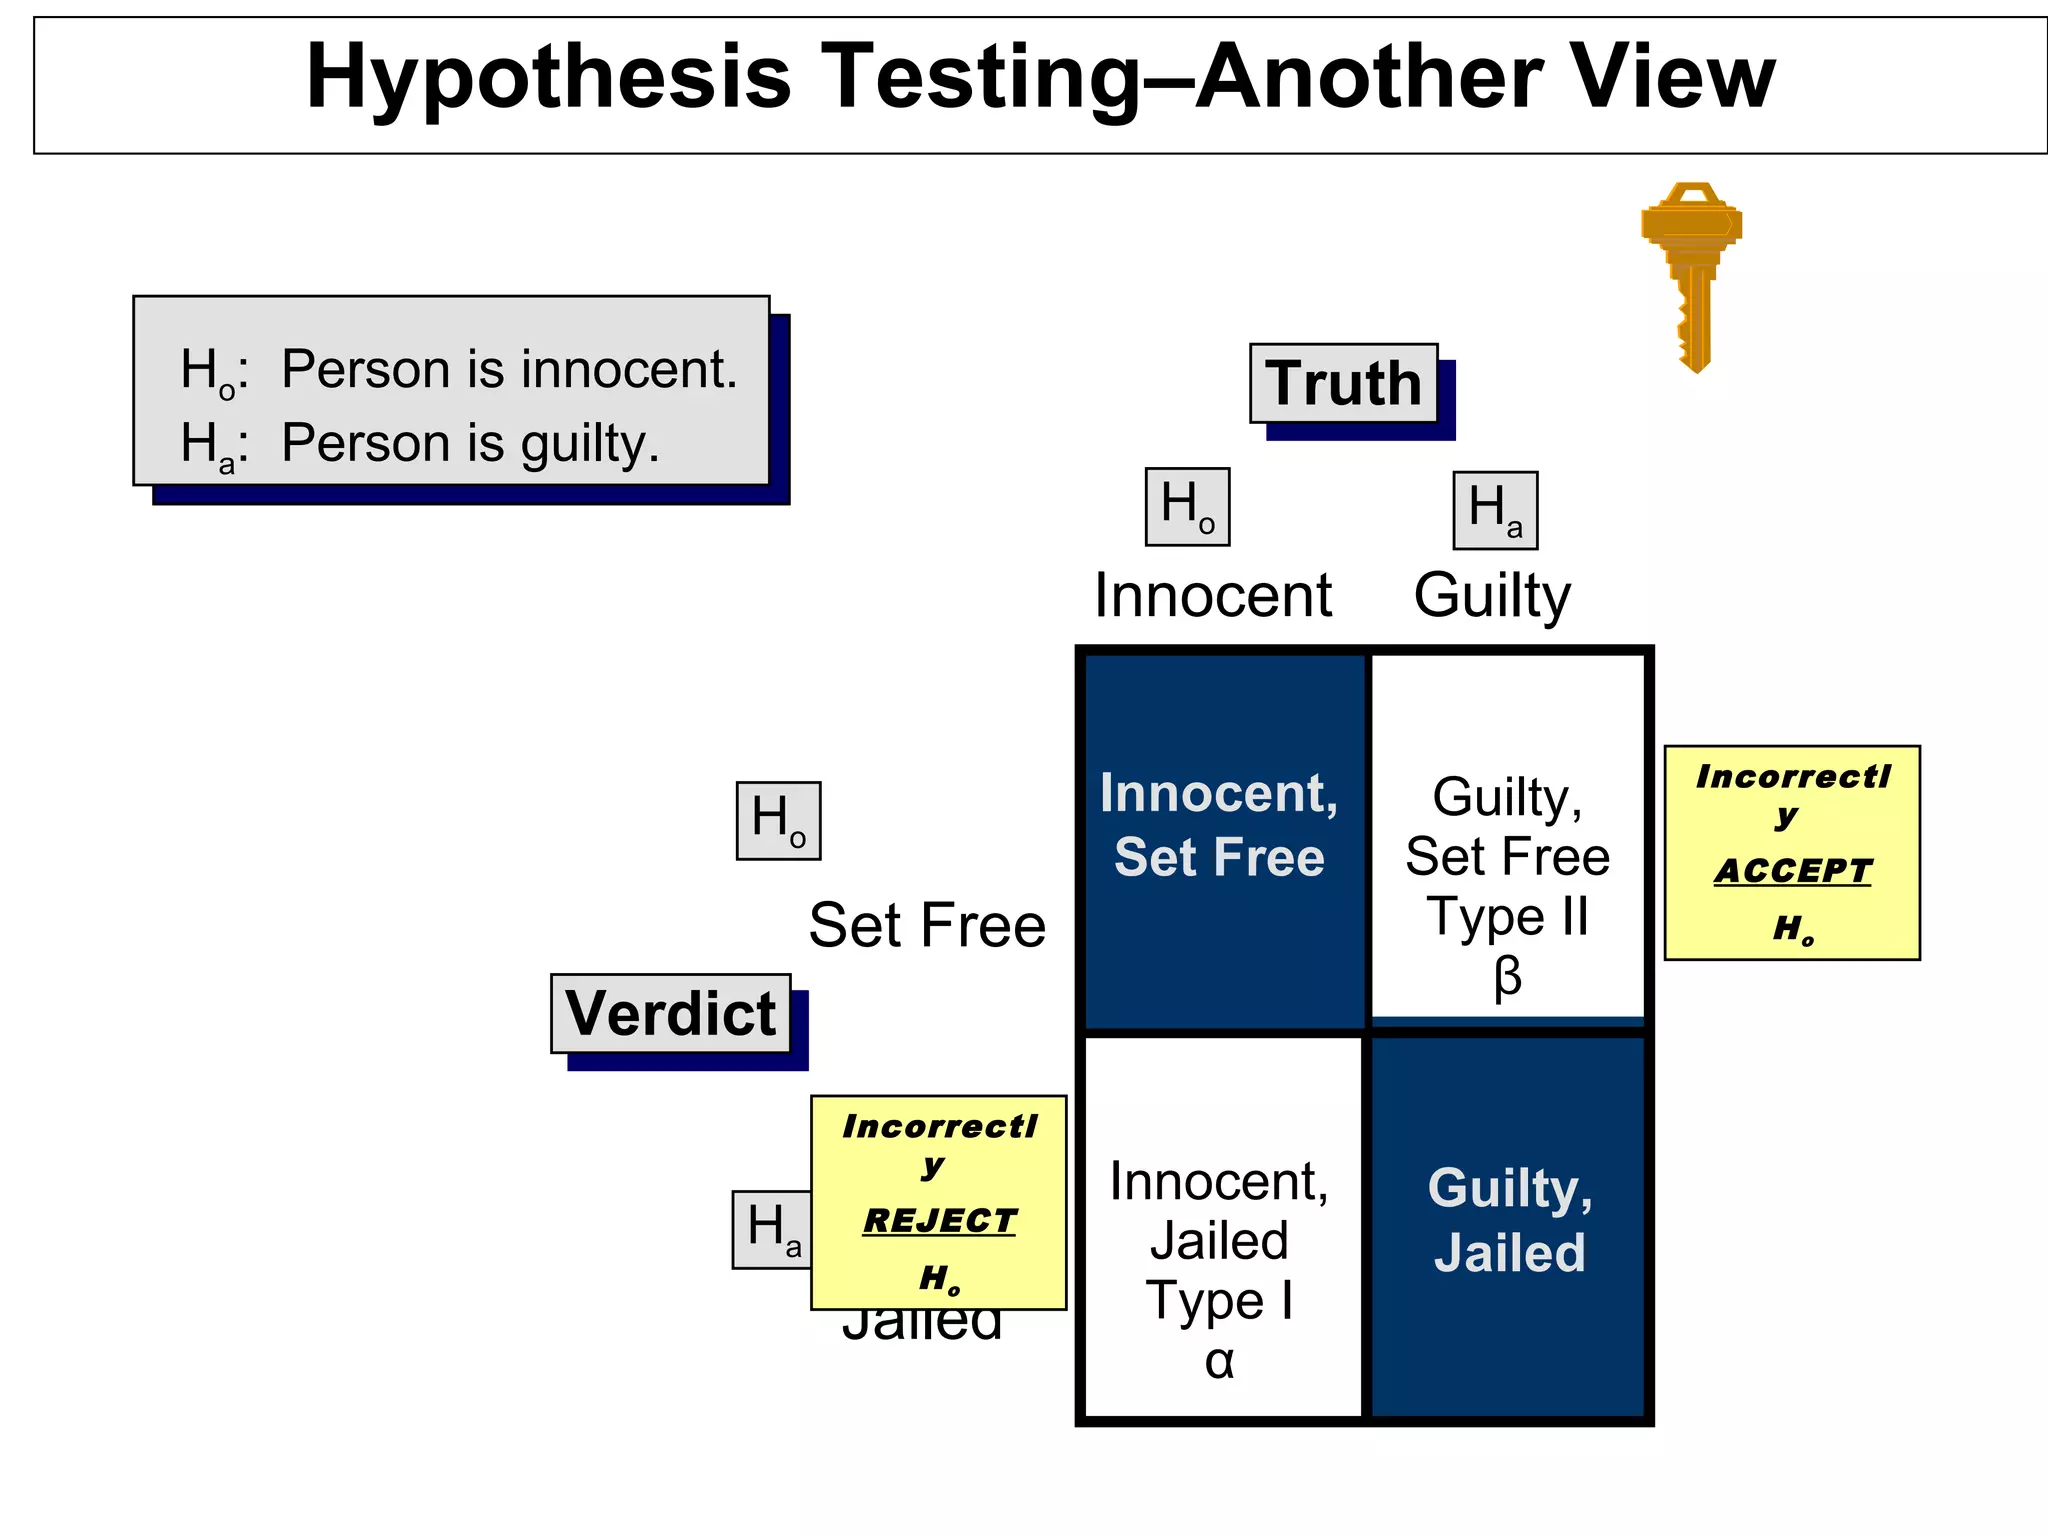
Hypothesis Testing–Another View
TruthTruth
Ho Ha
VerdictVerdict
Ho
Ha
Innocent,
Jailed
Type I
α
Guilty,
Set Free
Type II
β
Innocent,
Set Free
Guilty,
Jailed
Innocent Guilty
Set Free
Jailed
Ho: Person is innocent.
Ha: Person is guilty.
Incorrectl
y
REJECT
Ho
Incorrectl
y
ACCEPT
Ho
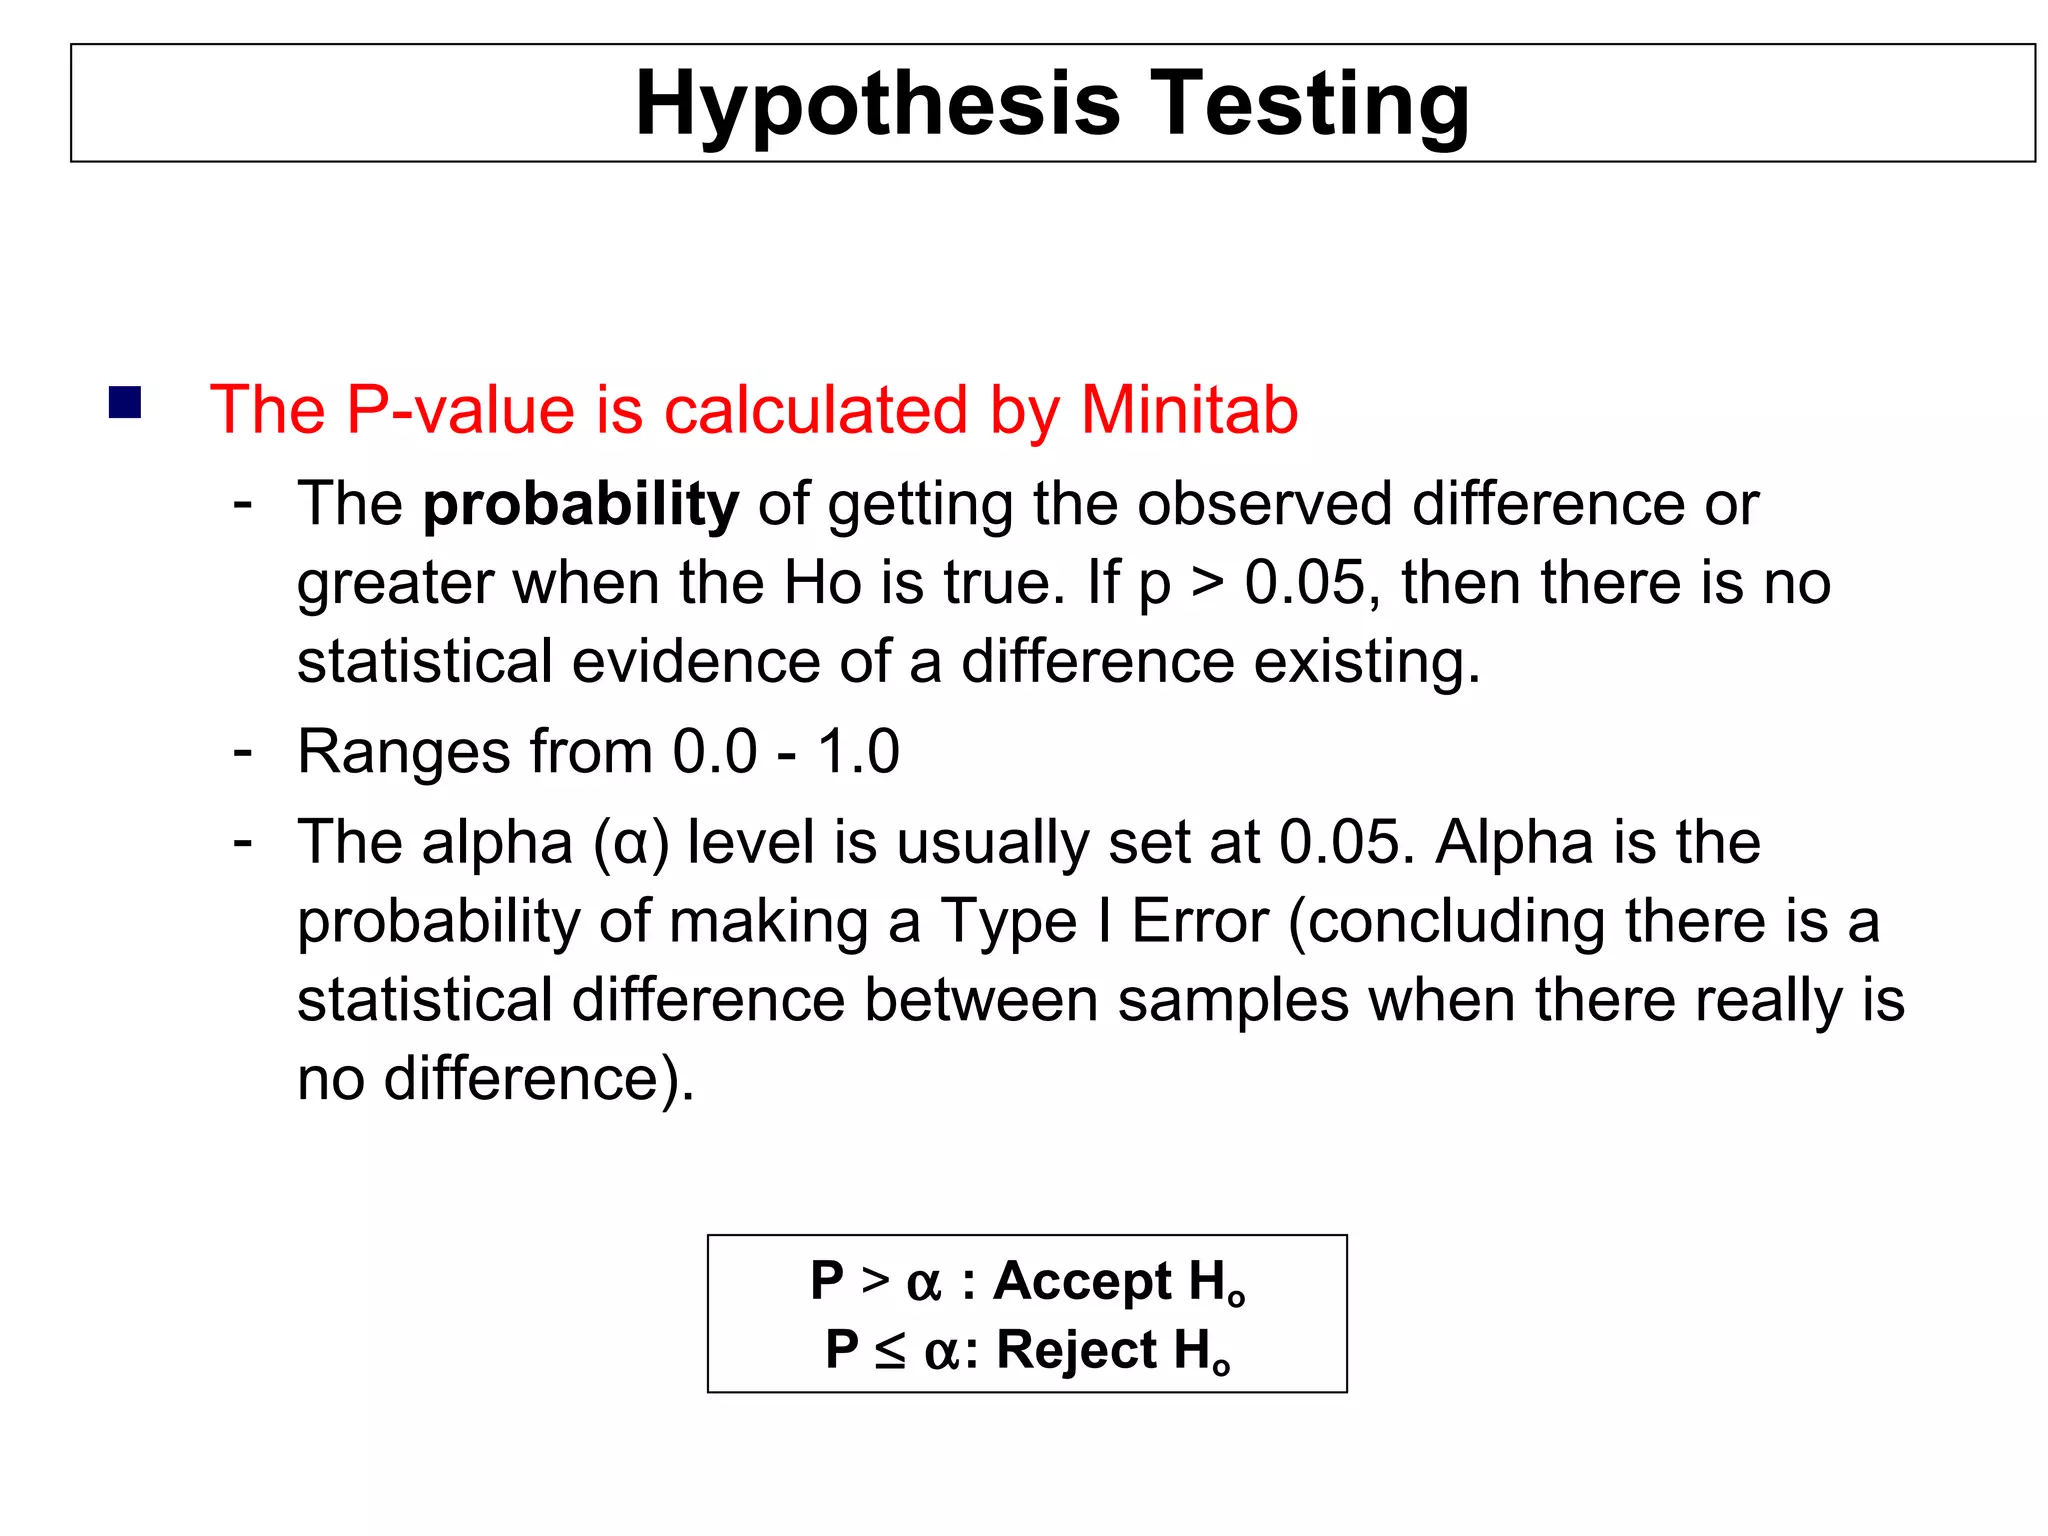
Hypothesis Testing
 The P-value is calculated by Minitab
- The probability of getting the observed difference or
greater when the Ho is true. If p > 0.05, then there is no
statistical evidence of a difference existing.
- Ranges from 0.0 - 1.0
- The alpha (α) level is usually set at 0.05. Alpha is the
probability of making a Type I Error (concluding there is a
statistical difference between samples when there really is
no difference).
P > α : Accept Ho
P ≤ α: Reject Ho
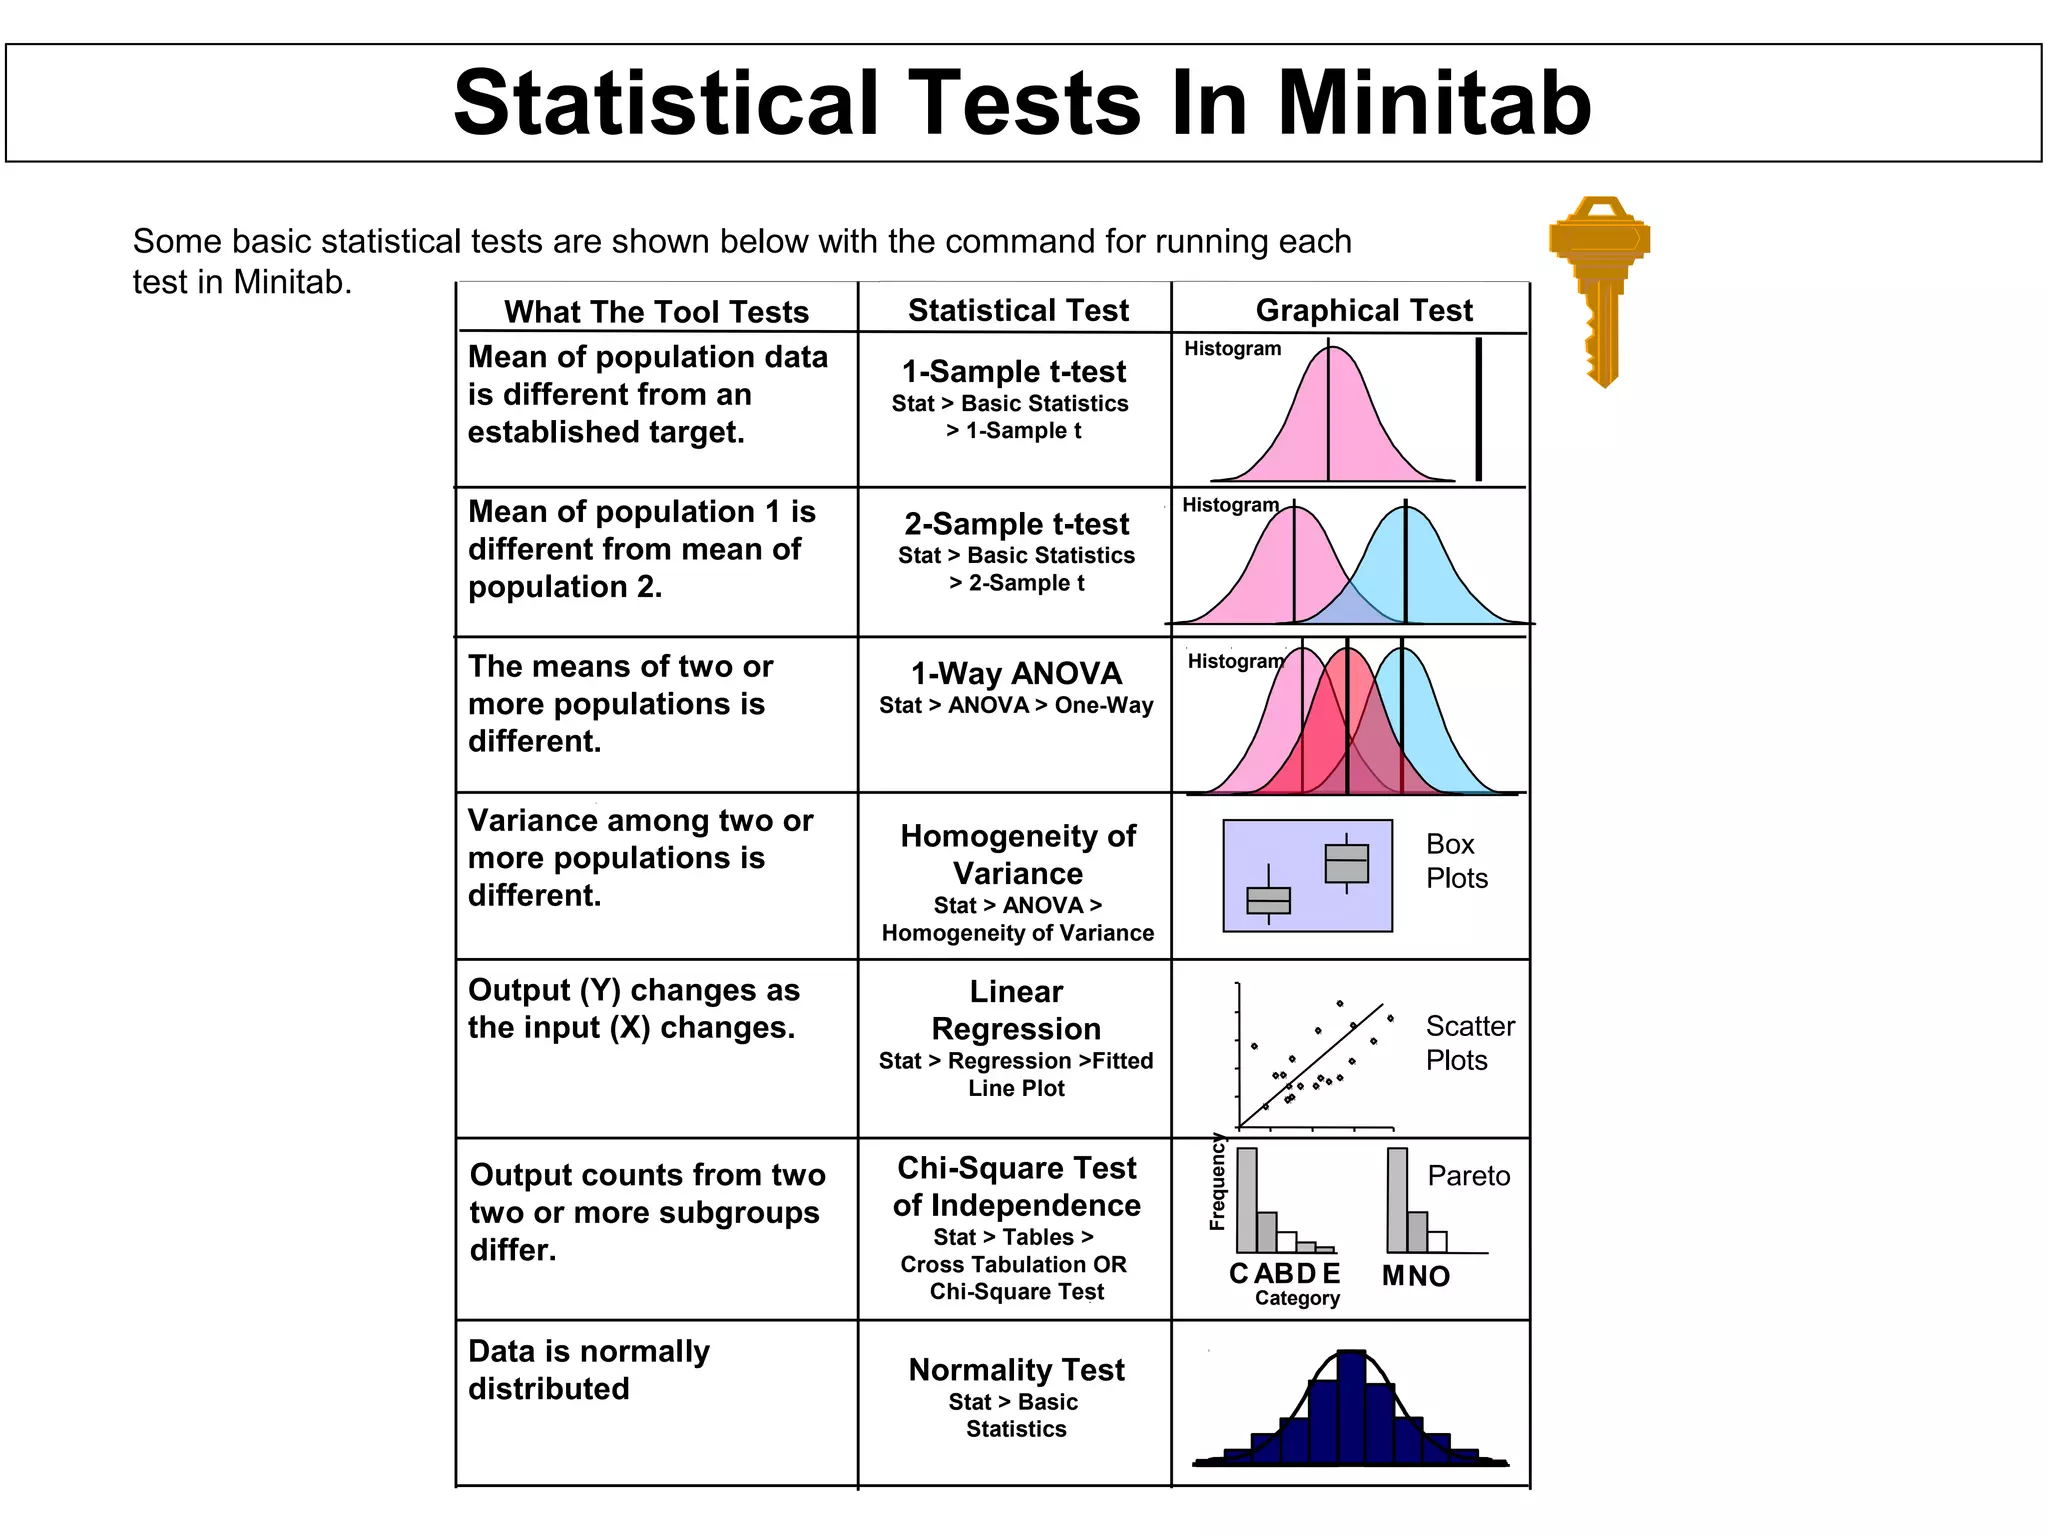
Statistical Tests In Minitab
Some basic statistical tests are shown below with the command for running each
test in Minitab.
Variance among two or
more populations is
different.
Homogeneity of
Variance
Stat > ANOVA >
Homogeneity of Variance
Output (Y) changes as
the input (X) changes.
Linear
Regression
Stat > Regression >Fitted
Line Plot
Output counts from two
two or more subgroups
differ.
Chi-Square Test
of Independence
Stat > Tables >
Cross Tabulation OR
Chi-Square Test
Box
Plots
Scatter
Plots
C ABD E
Frequency
Category
Pareto
MNO
What The Tool Tests Statistical Test Graphical Test
Mean of population data
is different from an
established target.
1-Sample t-test
Stat > Basic Statistics
> 1-Sample t
Mean of population 1 is
different from mean of
population 2.
2-Sample t-test
Stat > Basic Statistics
> 2-Sample t
The means of two or
more populations is
different.
1-Way ANOVA
Stat > ANOVA > One-Way
Histogram
Histogram
Histogram
Normality Test
Stat > Basic
Statistics
Data is normally
distributed
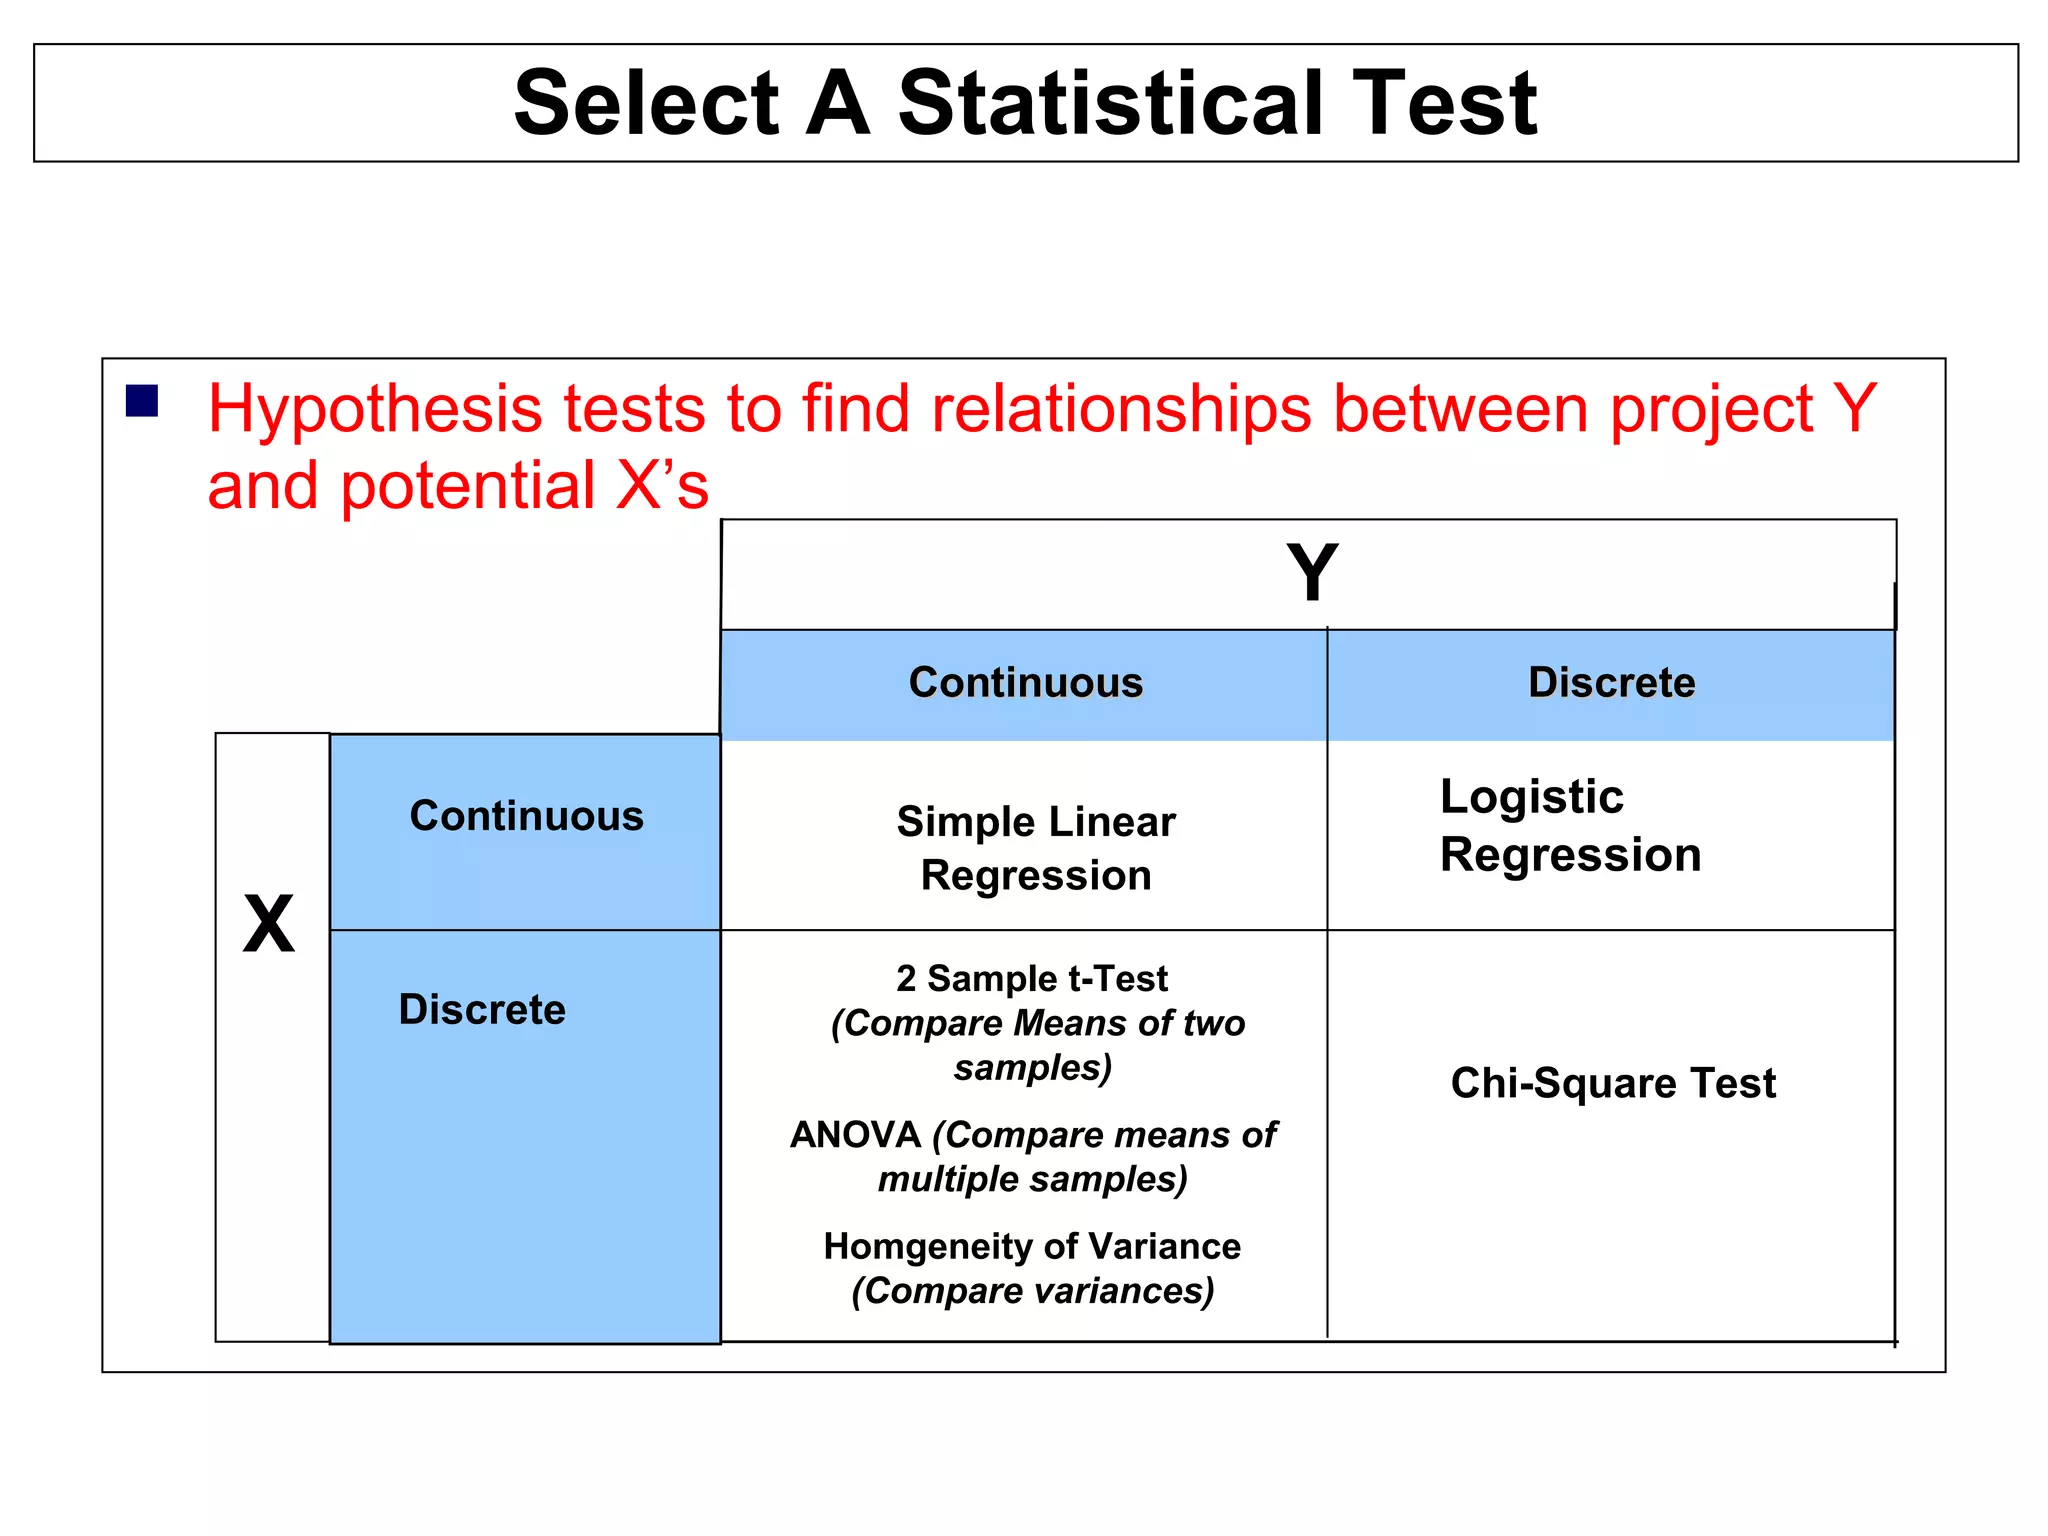
Select A Statistical Test
 Hypothesis tests to find relationships between project Y
and potential X’s
Simple Linear
Regression
2 Sample t-Test
(Compare Means of two
samples)
ANOVA (Compare means of
multiple samples)
Homgeneity of Variance
(Compare variances)
ContinuousContinuous DiscreteDiscrete
Discrete
Continuous
X
Chi-Square Test
Y
Logistic
Regression
Hypothesis Test Summary
Normal Data
Variance Tests (Continuous Y)
F-test- Compares two sample variances.
Homogeneity of Variance –Compares two
or more sample variances (use Levene’s
Test)
Mean Tests (Continuous Y)
T-test One-sample–Tests if sample mean is
equal to a known mean or target.
T-test Two-sample–Tests if two sample
means are equal.
ANOVA One-Way–Tests if two or more
sample means are equal.
ANOVA Two-Way–Tests if means from
samples classified by two categories are
equal.
Correlation–Tests linear relation- ship
between two variables.
Regression–Defines the linear relationship
between a dependent and independent
variable.
(Here, “Normality” applies to the
residuals of the regression.)
Non-Normal Data
Variance Tests (Continuous Y)
Homogeneity of Variance–Compares two or
more sample variances (use Levene’s Test)
Median Tests (Continuous Y)
Mood’s Median Test–Another test for two or
more medians. More robust to outliers in
data.
Correlation–Tests linear relationship
between two variables.
Proportion Tests (Discrete Y)
P-Test–Tests if two population proportions
are equal.
Chi-Square Test–Tests if three or more
relative counts are equal.
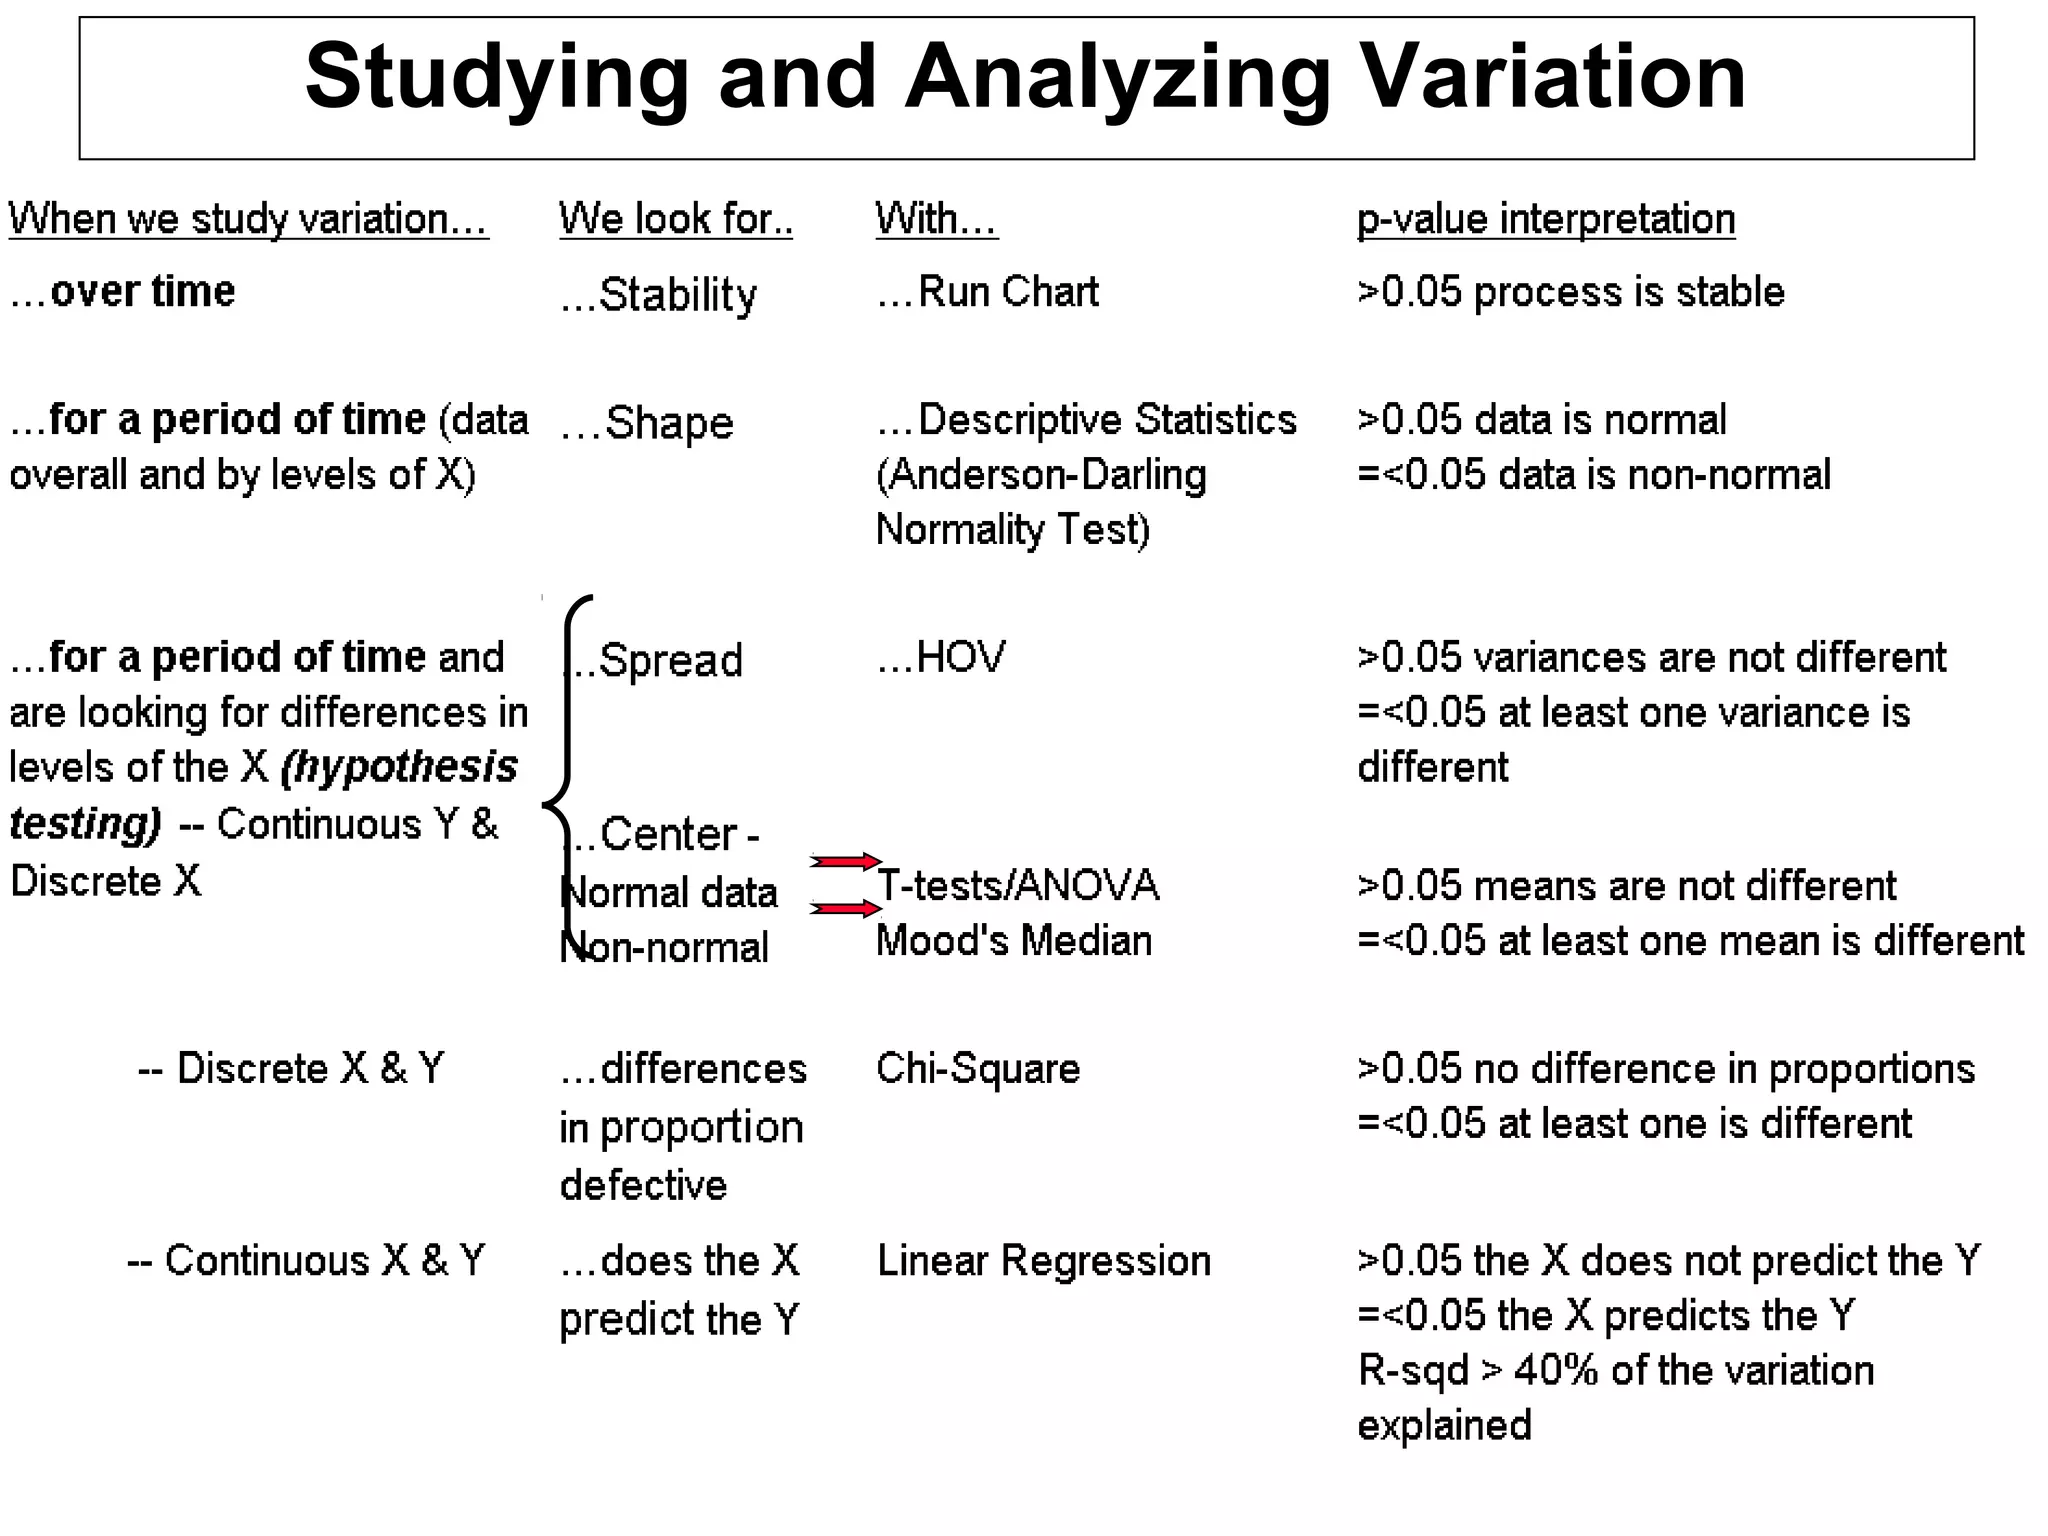
Studying and Analyzing Variation
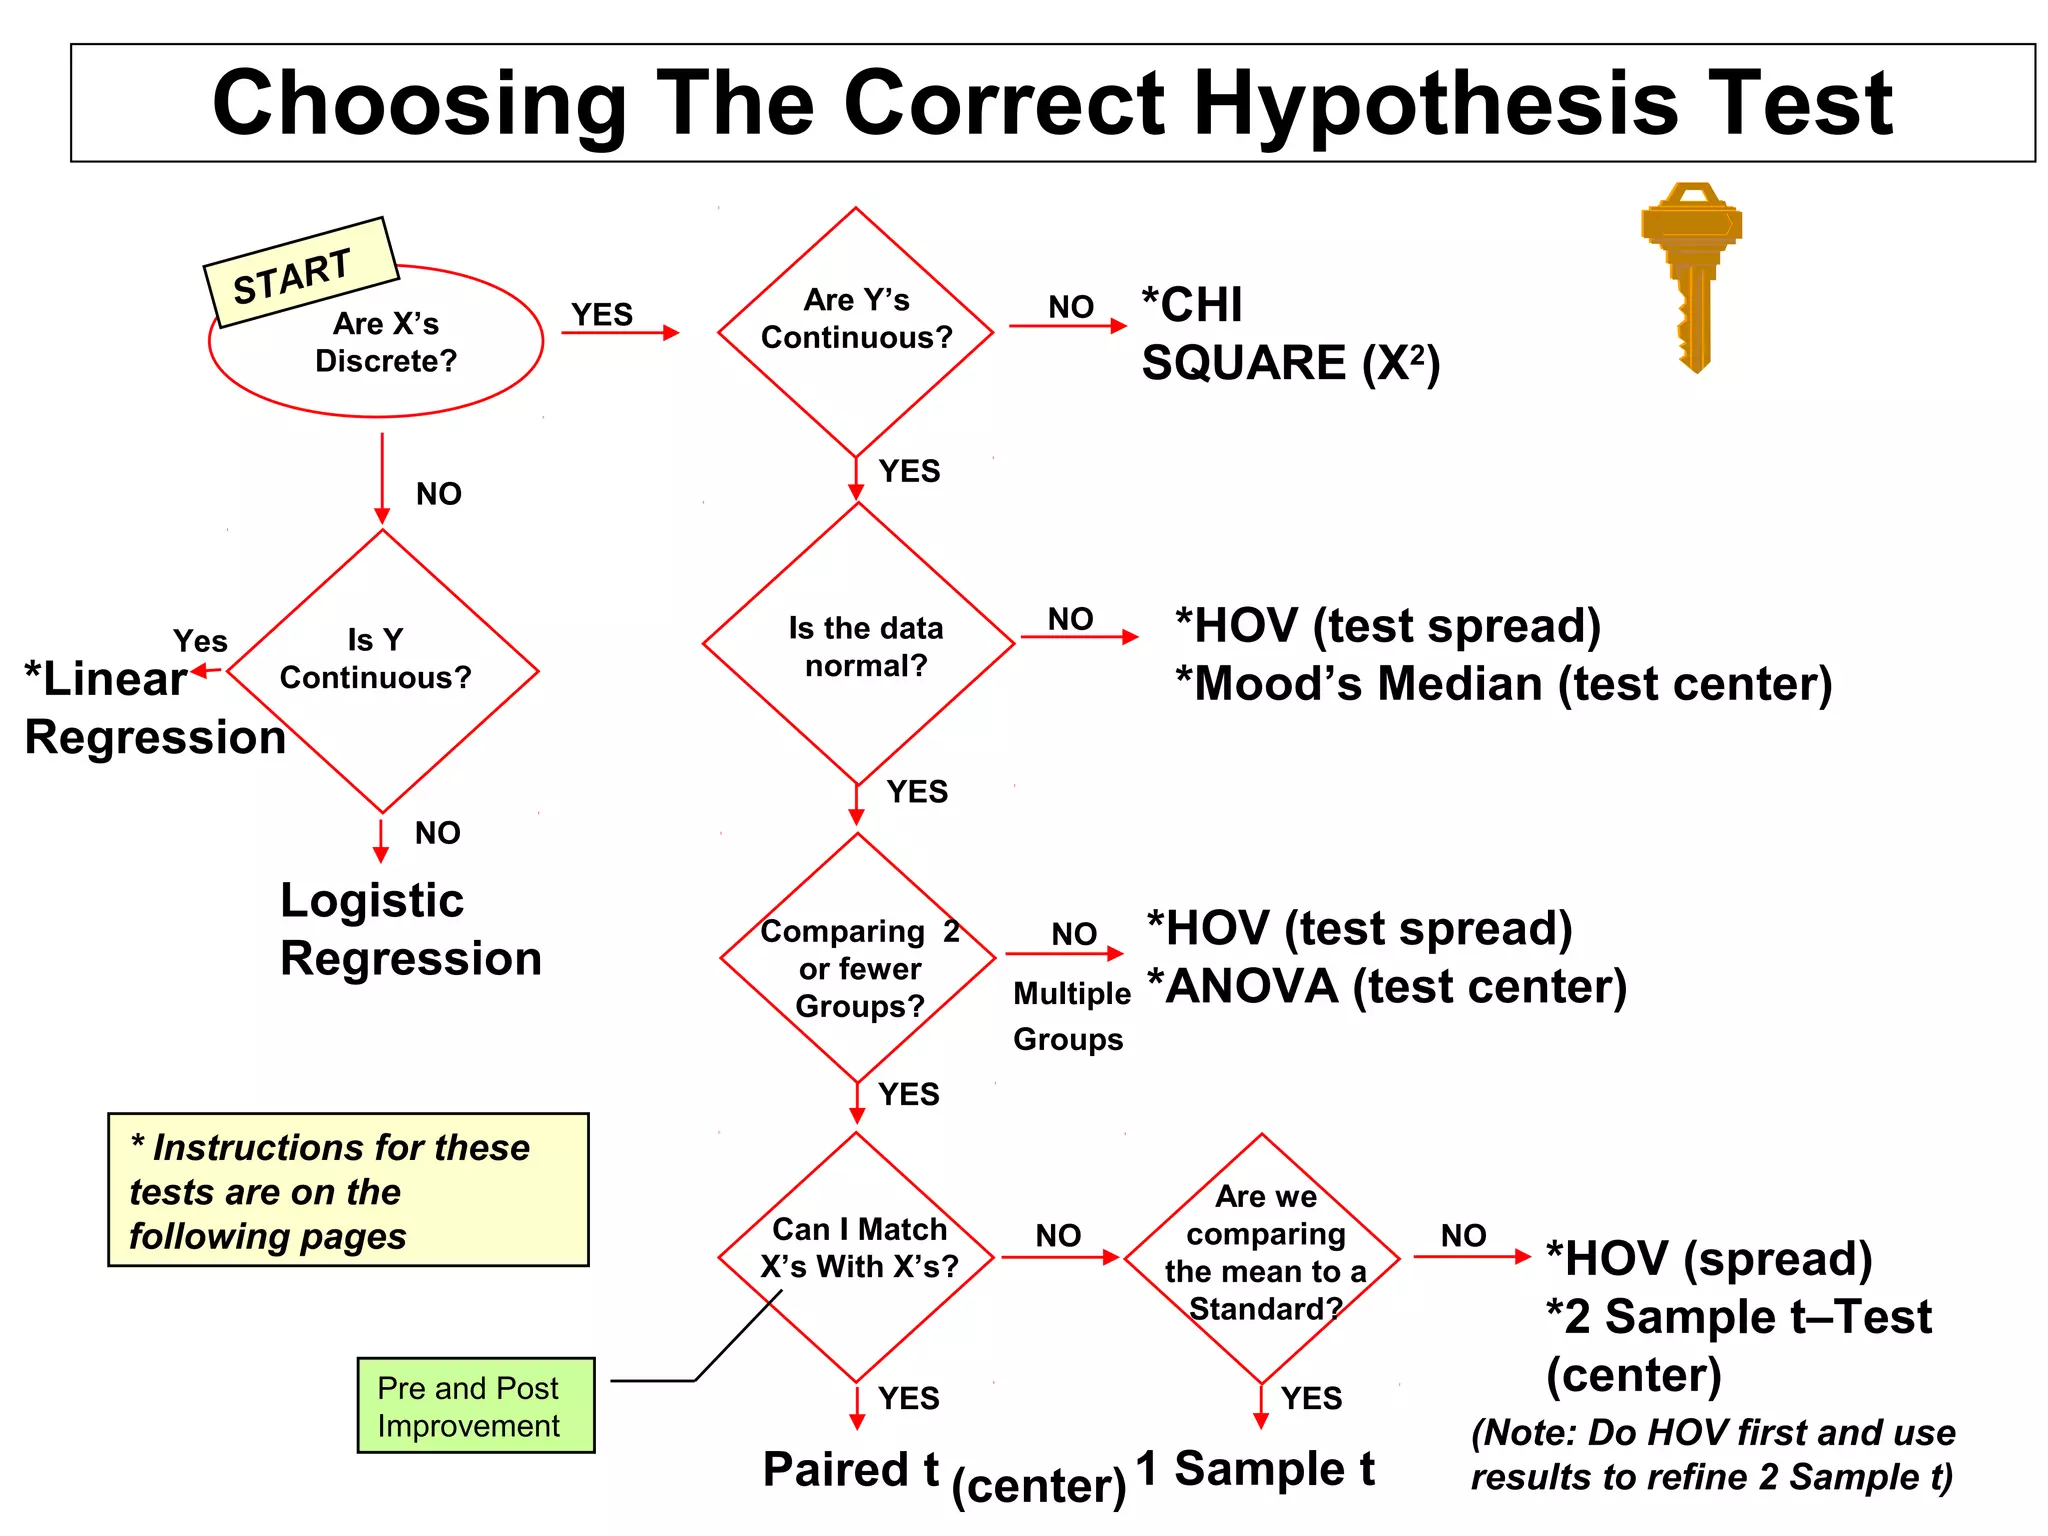
Choosing The Correct Hypothesis Test
*HOV (test spread)
*Mood’s Median (test center)
*HOV (test spread)
*ANOVA (test center)
Comparing 2
or fewer
Groups?
Can I Match
X’s With X’s?
Are we
comparing
the mean to a
Standard?
Paired t 1 Sample t
NO
NO NO
YES YES
Is the data
normal?
NO
YES
*CHI
SQUARE (X2
)
Are Y’s
Continuous?
NO
YES
YES
*HOV (spread)
*2 Sample t–Test
(center)
Are X’s
Discrete?
YES
Logistic
Regression
NO
Is Y
Continuous?
NO
Yes
*Linear
Regression
(Note: Do HOV first and use
results to refine 2 Sample t)
Multiple
Groups
START
* Instructions for these
tests are on the
following pages
Pre and Post
Improvement
(center)
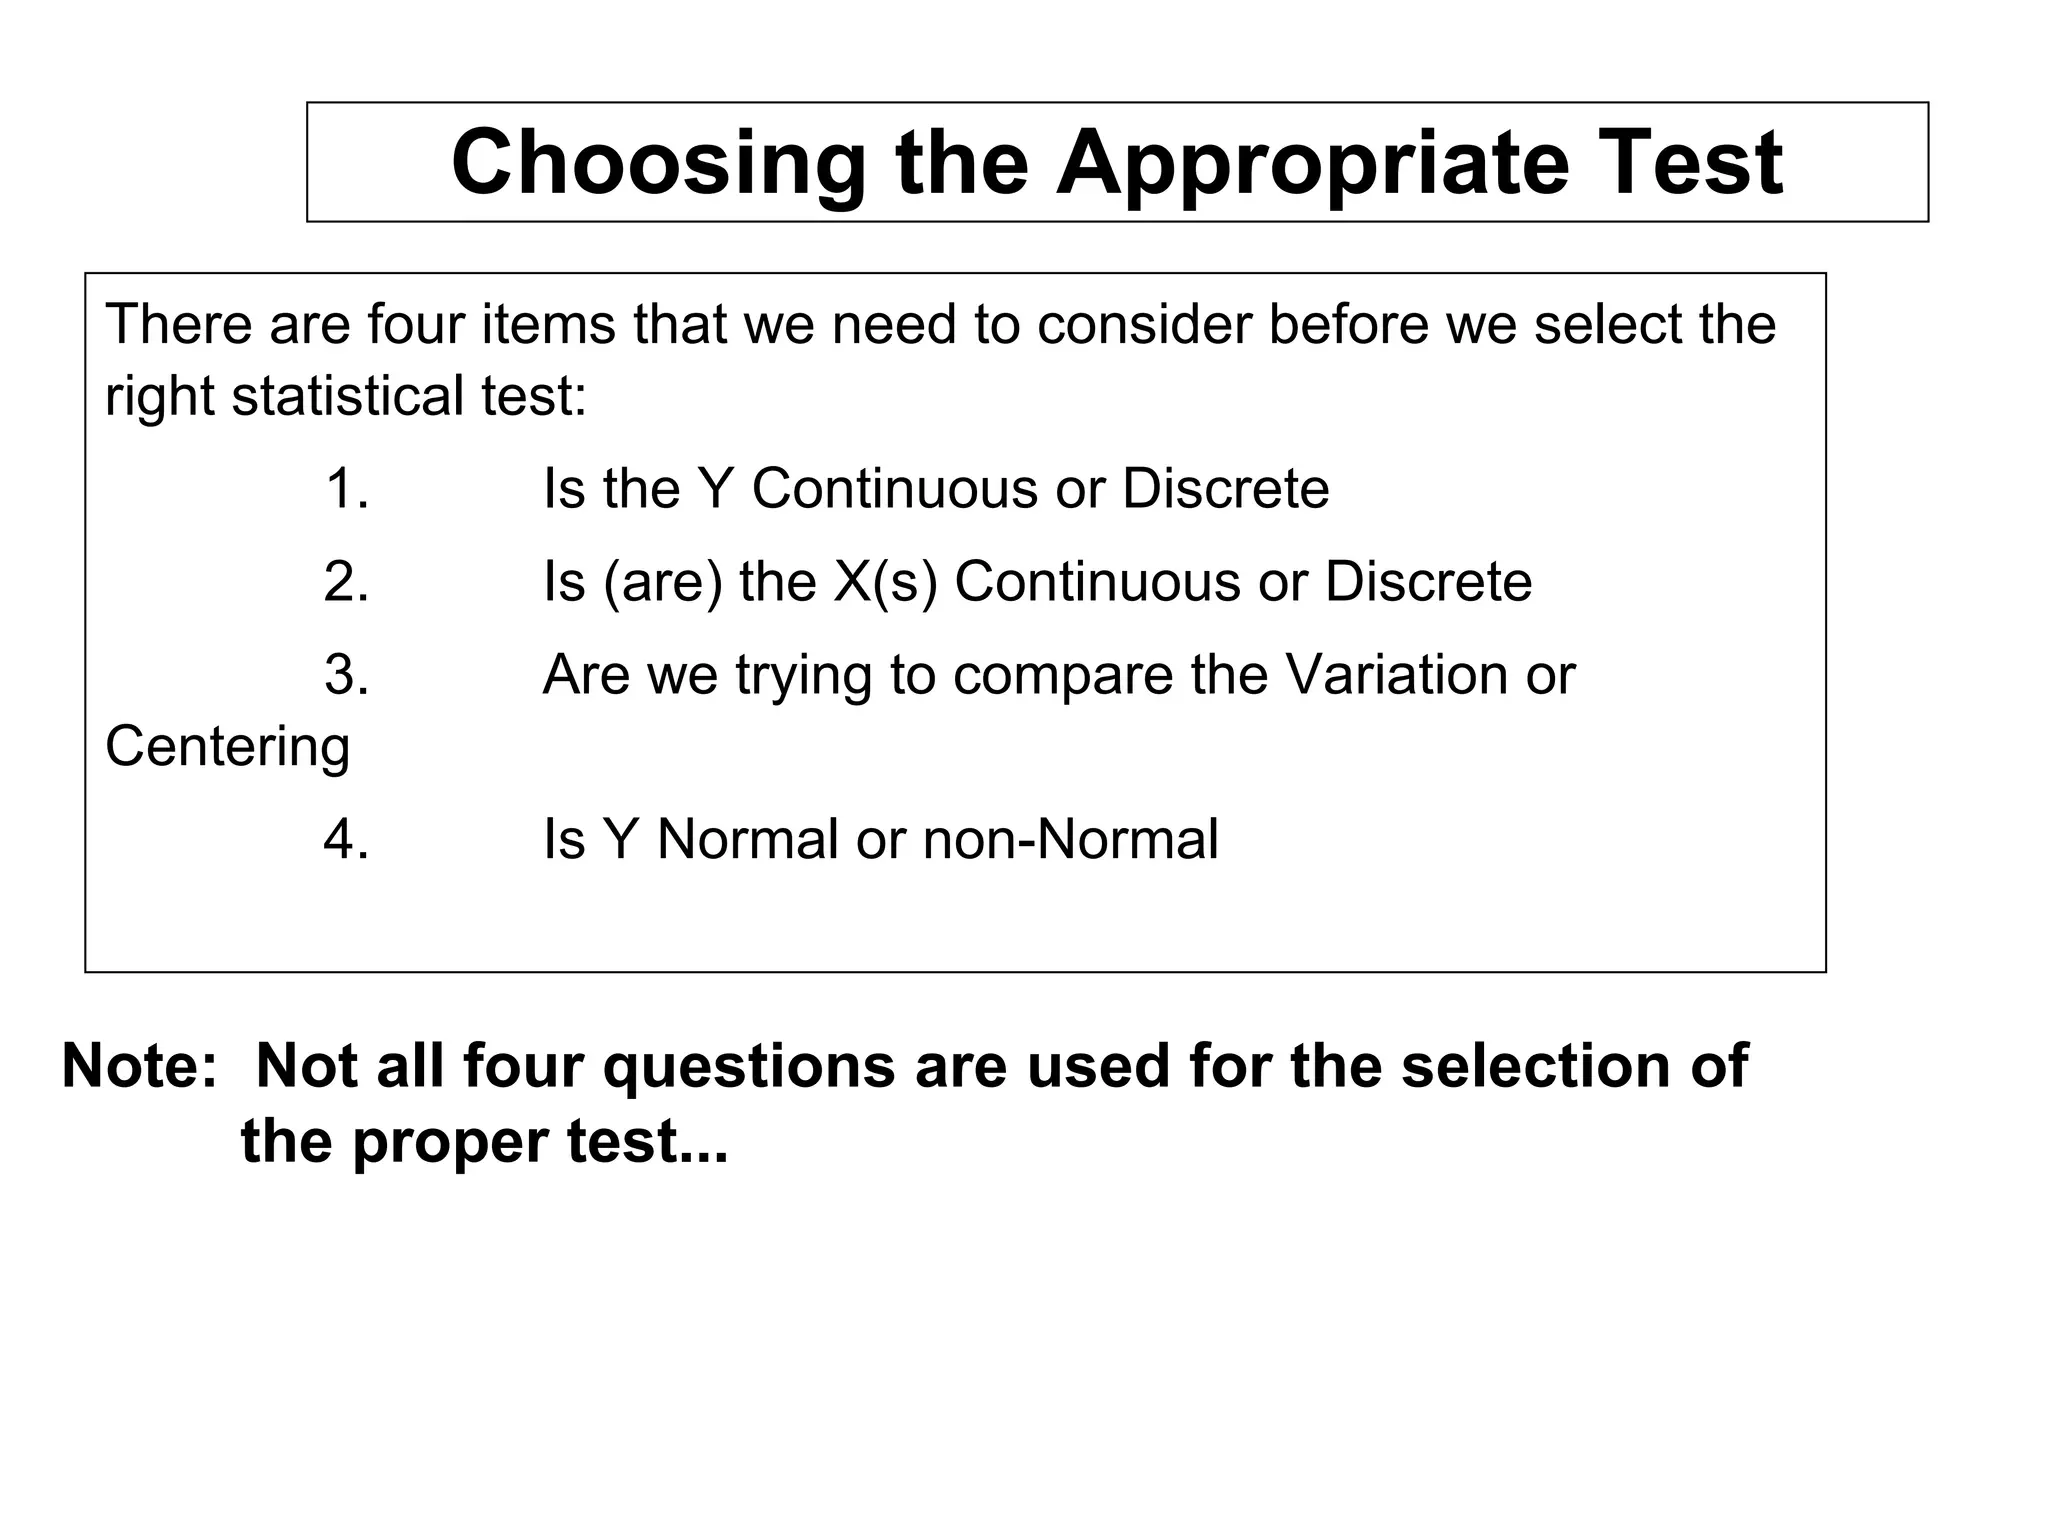
Choosing the Appropriate Test
There are four items that we need to consider before we select the
right statistical test:
1. Is the Y Continuous or Discrete
2. Is (are) the X(s) Continuous or Discrete
3. Are we trying to compare the Variation or
Centering
4. Is Y Normal or non-Normal
Note: Not all four questions are used for the selection of
the proper test...
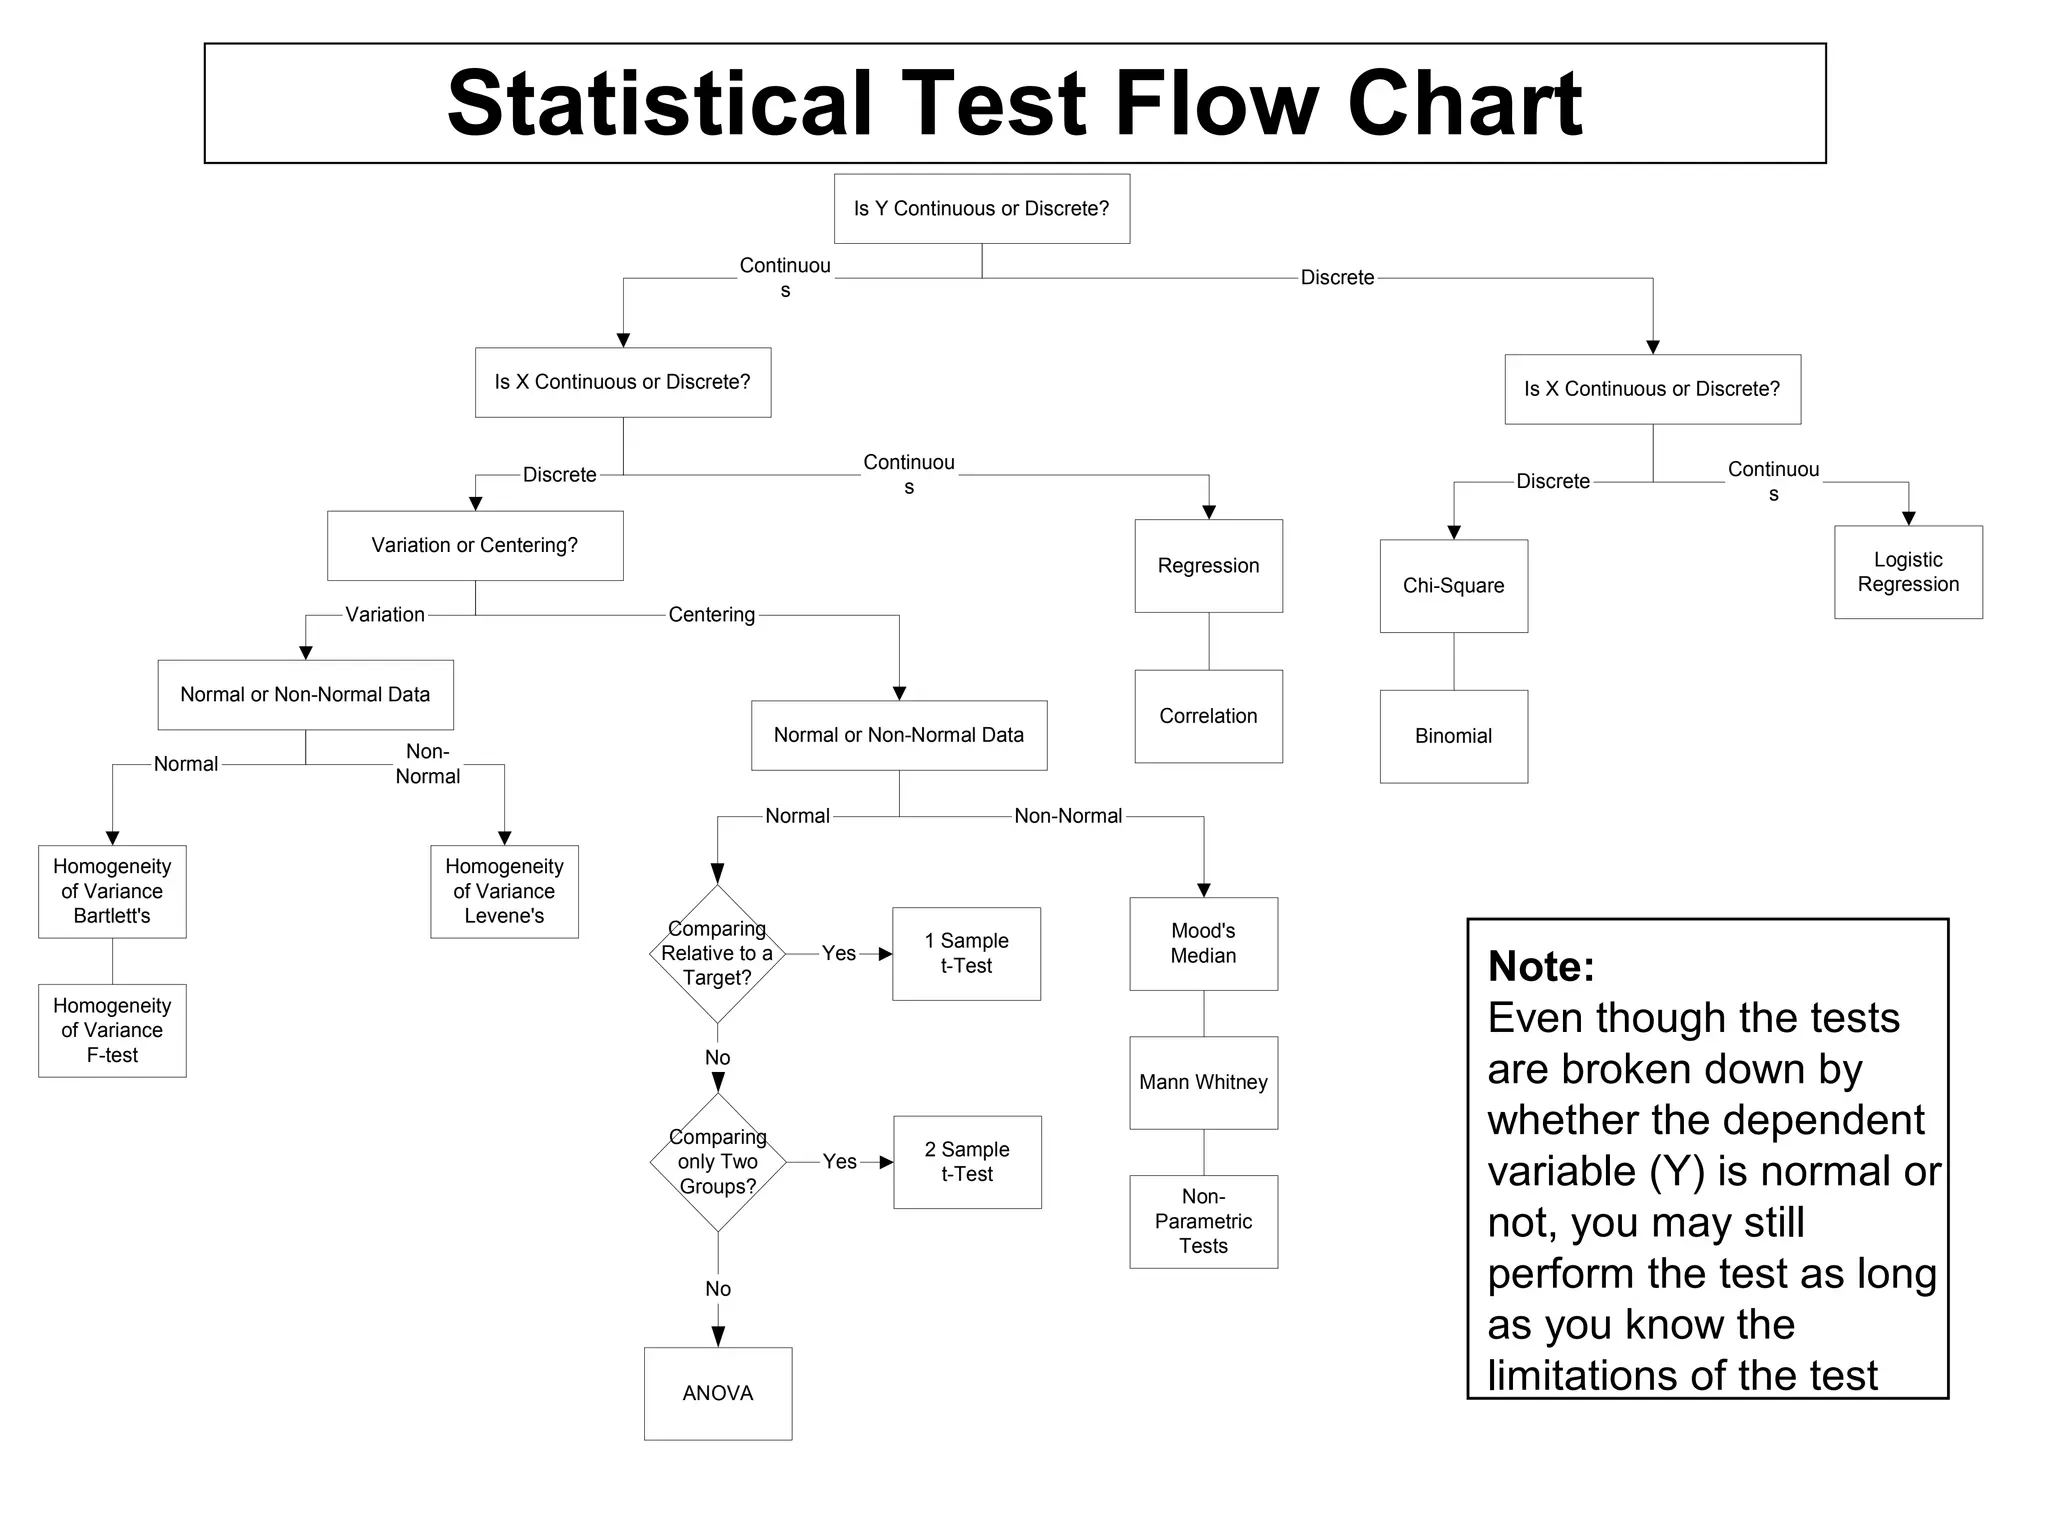
Statistical Test Flow Chart
Is Y Continuous or Discrete?
Is X Continuous or Discrete? Is X Continuous or Discrete?
Chi-Square
Variation or Centering?
Discrete
Continuou
s
Continuou
s
Discrete Continuou
s
Discrete
Binomial
Logistic
Regression
Regression
Correlation
Mood's
Median
Mann Whitney
Centering
Normal or Non-Normal Data
Non-Normal
Non-
Parametric
Tests
Normal
No
ANOVA
No
Comparing
Relative to a
Target?
Comparing
only Two
Groups?
2 Sample
t-Test
Yes
1 Sample
t-Test
Yes
Normal or Non-Normal Data
Variation
Homogeneity
of Variance
Bartlett's
Homogeneity
of Variance
F-test
Homogeneity
of Variance
Levene's
Normal
Non-
Normal
Note:
Even though the tests
are broken down by
whether the dependent
variable (Y) is normal or
not, you may still
perform the test as long
as you know the
limitations of the test
Which Hypothesis Testing Tool Would You Use?
For each scenario described below, which hypothesis testing tool would
you use? Assume normal distribution, where appropriate
1. A six-sigma project is being conducted in the field to improve the cycle time for warranty
repair returns. The warranty return cycle time was measured for a period of 6 weeks for 4
regions. The Green Belt suspects that there is a difference in average warranty repair cycle
time among each of the regions. How would you test whether there is a statistically
significant difference in mean cycle time for the different regions?
2. Tungsten steel erosion shields are fitted to the low pressure blading in steam turbines.
The most important feature of a shield is its resistance to wear. Resistance to wear can be
measured by abrasion loss, which is thought to be associated with the hardness of steel.
How would you test whether there is a statistically significant relationship between
resistance to wear and abrasion hardness of steel?
3. Your business purchases sheet stock from two different suppliers. It has found an
unacceptably large number of defects being caused by thickness beyond tolerance levels.
Data for overall mean thickness data was analyzed and found to be on target. Data was
collected that would identify a potential difference in the variation of the thickness of the
material by supplier.
4. Checks Are Us is a payroll processing firm. Timecard errors are routinely monitored and
recorded. A Black Belt investigating the errors wishes to determine if there are any
differences in the number of errors among five of its major customers. The number of errors
contained in a sample of 150 employees was recorded for five weeks. How would you test if
there is a statistically significant difference in the number of errors among the customers?

More Related Content

What's hot

Hypothesis testing
Hypothesis testingHypothesis testing
Hypothesis testing
Kaori Kubo Germano, PhD
 
Hypothesis testing
Hypothesis testingHypothesis testing
Hypothesis testing
Madhuranath R
 
Acceptance Sampling
Acceptance SamplingAcceptance Sampling
Multivariate Analysis
Multivariate AnalysisMultivariate Analysis
Multivariate Analysis
Stig-Arne Kristoffersen
 
Lecture2 hypothesis testing
Lecture2 hypothesis testingLecture2 hypothesis testing
Lecture2 hypothesis testing
o_devinyak
 
Hypothesis testing
Hypothesis testingHypothesis testing
Hypothesis testing
Sumit Sharma
 
Quality and statistical process control ppt @ bec doms
Quality and statistical process control ppt @ bec domsQuality and statistical process control ppt @ bec doms
Quality and statistical process control ppt @ bec doms
Babasab Patil
 
TOPIC- HYPOTHESIS TESTING RMS.pptx
TOPIC- HYPOTHESIS TESTING  RMS.pptxTOPIC- HYPOTHESIS TESTING  RMS.pptx
TOPIC- HYPOTHESIS TESTING RMS.pptx
anamikamishra29
 
Inferential statistics
Inferential statisticsInferential statistics
Inferential statistics
Ashok Kulkarni
 
Critical Value and The P Value
Critical Value and The P ValueCritical Value and The P Value
Critical Value and The P Value
Pharmacy Universe
 
Kruskal Wallis test, Friedman test, Spearman Correlation
Kruskal Wallis test, Friedman test, Spearman CorrelationKruskal Wallis test, Friedman test, Spearman Correlation
Kruskal Wallis test, Friedman test, Spearman Correlation
Rizwan S A
 
Diagnostic in poisson regression models
Diagnostic in poisson regression modelsDiagnostic in poisson regression models
Diagnostic in poisson regression models
University of Southampton
 
02training material for msa
02training material for msa02training material for msa
02training material for msa營松 林
 
Chapter 15 Social Research
Chapter 15 Social ResearchChapter 15 Social Research
Chapter 15 Social Researcharpsychology
 
Measurement System Analysis - Module 2
Measurement System Analysis - Module 2Measurement System Analysis - Module 2
Measurement System Analysis - Module 2
Subhodeep Deb
 
Hypothesis testing an introduction
Hypothesis testing an introductionHypothesis testing an introduction
Hypothesis testing an introductionGeetika Gulyani
 
10. measurement system analysis (msa)
10. measurement system analysis (msa)10. measurement system analysis (msa)
10. measurement system analysis (msa)
Hakeem-Ur- Rehman
 
4.5. logistic regression
4.5. logistic regression4.5. logistic regression
4.5. logistic regression
A M
 

What's hot (20)

Hypothesis testing
Hypothesis testingHypothesis testing
Hypothesis testing
 
Hypothesis testing
Hypothesis testingHypothesis testing
Hypothesis testing
 
Acceptance Sampling
Acceptance SamplingAcceptance Sampling
Acceptance Sampling
 
Multivariate Analysis
Multivariate AnalysisMultivariate Analysis
Multivariate Analysis
 
Lecture2 hypothesis testing
Lecture2 hypothesis testingLecture2 hypothesis testing
Lecture2 hypothesis testing
 
Hypothesis testing
Hypothesis testingHypothesis testing
Hypothesis testing
 
Quality and statistical process control ppt @ bec doms
Quality and statistical process control ppt @ bec domsQuality and statistical process control ppt @ bec doms
Quality and statistical process control ppt @ bec doms
 
TOPIC- HYPOTHESIS TESTING RMS.pptx
TOPIC- HYPOTHESIS TESTING  RMS.pptxTOPIC- HYPOTHESIS TESTING  RMS.pptx
TOPIC- HYPOTHESIS TESTING RMS.pptx
 
Inferential statistics
Inferential statisticsInferential statistics
Inferential statistics
 
Critical Value and The P Value
Critical Value and The P ValueCritical Value and The P Value
Critical Value and The P Value
 
Scalling technique
Scalling technique Scalling technique
Scalling technique
 
Kruskal Wallis test, Friedman test, Spearman Correlation
Kruskal Wallis test, Friedman test, Spearman CorrelationKruskal Wallis test, Friedman test, Spearman Correlation
Kruskal Wallis test, Friedman test, Spearman Correlation
 
Diagnostic in poisson regression models
Diagnostic in poisson regression modelsDiagnostic in poisson regression models
Diagnostic in poisson regression models
 
02training material for msa
02training material for msa02training material for msa
02training material for msa
 
Chapter 15 Social Research
Chapter 15 Social ResearchChapter 15 Social Research
Chapter 15 Social Research
 
Measurement System Analysis - Module 2
Measurement System Analysis - Module 2Measurement System Analysis - Module 2
Measurement System Analysis - Module 2
 
Hypothesis testing an introduction
Hypothesis testing an introductionHypothesis testing an introduction
Hypothesis testing an introduction
 
10. measurement system analysis (msa)
10. measurement system analysis (msa)10. measurement system analysis (msa)
10. measurement system analysis (msa)
 
Chapter13
Chapter13Chapter13
Chapter13
 
4.5. logistic regression
4.5. logistic regression4.5. logistic regression
4.5. logistic regression
 

Viewers also liked

DITEC - Software Engineering
DITEC - Software EngineeringDITEC - Software Engineering
DITEC - Software Engineering
Rasan Samarasinghe
 
Software Reengineering
Software ReengineeringSoftware Reengineering
Software Reengineering
Deniz Kılınç
 
Chapter 7 software reliability
Chapter 7 software reliabilityChapter 7 software reliability
Chapter 7 software reliability
despicable me
 
Chapter 4 software design
Chapter 4  software designChapter 4  software design
Chapter 4 software designCliftone Mullah
 
Introduction to UML
Introduction to UMLIntroduction to UML
Software reverse engineering
Software reverse engineeringSoftware reverse engineering
Software reverse engineering
Parminder Singh
 

Viewers also liked (6)

DITEC - Software Engineering
DITEC - Software EngineeringDITEC - Software Engineering
DITEC - Software Engineering
 
Software Reengineering
Software ReengineeringSoftware Reengineering
Software Reengineering
 
Chapter 7 software reliability
Chapter 7 software reliabilityChapter 7 software reliability
Chapter 7 software reliability
 
Chapter 4 software design
Chapter 4  software designChapter 4  software design
Chapter 4 software design
 
Introduction to UML
Introduction to UMLIntroduction to UML
Introduction to UML
 
Software reverse engineering
Software reverse engineeringSoftware reverse engineering
Software reverse engineering
 

Similar to Hypothesis Testing in Six Sigma

Spss session 1 and 2
Spss session 1 and 2Spss session 1 and 2
Spss session 1 and 2
Judianto Nugroho
 
20200519073328de6dca404c.pdfkshhjejhehdhd
20200519073328de6dca404c.pdfkshhjejhehdhd20200519073328de6dca404c.pdfkshhjejhehdhd
20200519073328de6dca404c.pdfkshhjejhehdhd
HimanshuSharma723273
 
Presentation chi-square test & Anova
Presentation   chi-square test & AnovaPresentation   chi-square test & Anova
Presentation chi-square test & Anova
Sonnappan Sridhar
 
Unit 4 Tests of Significance
Unit 4 Tests of SignificanceUnit 4 Tests of Significance
Unit 4 Tests of Significance
Rai University
 
hypothesis test
 hypothesis test hypothesis test
hypothesis test
Unsa Shakir
 
Tests of significance
Tests of significanceTests of significance
Tests of significance
Shubhanshu Gupta
 
What So Funny About Proportion Testv3
What So Funny About Proportion Testv3What So Funny About Proportion Testv3
What So Funny About Proportion Testv3
ChrisConnors
 
Hypothesistesting2
Hypothesistesting2Hypothesistesting2
Hypothesistesting2
Nithin Ramachandran
 
Testing of Hypothesis, p-value, Gaussian distribution, null hypothesis
Testing of Hypothesis, p-value, Gaussian distribution, null hypothesisTesting of Hypothesis, p-value, Gaussian distribution, null hypothesis
Testing of Hypothesis, p-value, Gaussian distribution, null hypothesis
svmmcradonco1
 
Hypothesis testing
Hypothesis testingHypothesis testing
Hypothesis testing
Sathish Rajamani
 
Review Z Test Ci 1
Review Z Test Ci 1Review Z Test Ci 1
Review Z Test Ci 1shoffma5
 
Hypothesis testing
Hypothesis testingHypothesis testing
Hypothesis testing
Hossain Hemel
 
Hypothesis_Testing.ppt
Hypothesis_Testing.pptHypothesis_Testing.ppt
Hypothesis_Testing.ppt
ssuserac2a40
 
Formulating Hypotheses
Formulating Hypotheses Formulating Hypotheses
Formulating Hypotheses
Shilpi Panchal
 
Basics of Hypothesis testing for Pharmacy
Basics of Hypothesis testing for PharmacyBasics of Hypothesis testing for Pharmacy
Basics of Hypothesis testing for Pharmacy
Parag Shah
 
Parametric tests
Parametric  testsParametric  tests
Parametric tests
shefali jain
 
Testing of Hypothesis.pptx
Testing of Hypothesis.pptxTesting of Hypothesis.pptx
Testing of Hypothesis.pptx
hemamalini398951
 
Testing of hypothesis
Testing of hypothesisTesting of hypothesis
Testing of hypothesis
RuchiJainRuchiJain
 

Similar to Hypothesis Testing in Six Sigma (20)

Spss session 1 and 2
Spss session 1 and 2Spss session 1 and 2
Spss session 1 and 2
 
20200519073328de6dca404c.pdfkshhjejhehdhd
20200519073328de6dca404c.pdfkshhjejhehdhd20200519073328de6dca404c.pdfkshhjejhehdhd
20200519073328de6dca404c.pdfkshhjejhehdhd
 
Presentation chi-square test & Anova
Presentation   chi-square test & AnovaPresentation   chi-square test & Anova
Presentation chi-square test & Anova
 
Unit 4 Tests of Significance
Unit 4 Tests of SignificanceUnit 4 Tests of Significance
Unit 4 Tests of Significance
 
Stat topics
Stat topicsStat topics
Stat topics
 
hypothesis test
 hypothesis test hypothesis test
hypothesis test
 
Tests of significance
Tests of significanceTests of significance
Tests of significance
 
What So Funny About Proportion Testv3
What So Funny About Proportion Testv3What So Funny About Proportion Testv3
What So Funny About Proportion Testv3
 
Hypothesistesting2
Hypothesistesting2Hypothesistesting2
Hypothesistesting2
 
Testing of Hypothesis, p-value, Gaussian distribution, null hypothesis
Testing of Hypothesis, p-value, Gaussian distribution, null hypothesisTesting of Hypothesis, p-value, Gaussian distribution, null hypothesis
Testing of Hypothesis, p-value, Gaussian distribution, null hypothesis
 
Hypothesis testing
Hypothesis testingHypothesis testing
Hypothesis testing
 
Formulatinghypotheses
Formulatinghypotheses Formulatinghypotheses
Formulatinghypotheses
 
Review Z Test Ci 1
Review Z Test Ci 1Review Z Test Ci 1
Review Z Test Ci 1
 
Hypothesis testing
Hypothesis testingHypothesis testing
Hypothesis testing
 
Hypothesis_Testing.ppt
Hypothesis_Testing.pptHypothesis_Testing.ppt
Hypothesis_Testing.ppt
 
Formulating Hypotheses
Formulating Hypotheses Formulating Hypotheses
Formulating Hypotheses
 
Basics of Hypothesis testing for Pharmacy
Basics of Hypothesis testing for PharmacyBasics of Hypothesis testing for Pharmacy
Basics of Hypothesis testing for Pharmacy
 
Parametric tests
Parametric  testsParametric  tests
Parametric tests
 
Testing of Hypothesis.pptx
Testing of Hypothesis.pptxTesting of Hypothesis.pptx
Testing of Hypothesis.pptx
 
Testing of hypothesis
Testing of hypothesisTesting of hypothesis
Testing of hypothesis
 

More from Body of Knowledge

Smart Art Graphics Ready to Use Template
Smart Art Graphics Ready to Use TemplateSmart Art Graphics Ready to Use Template
Smart Art Graphics Ready to Use Template
Body of Knowledge
 
Process maturity
Process maturityProcess maturity
Process maturity
Body of Knowledge
 
Powerpoint presentation template library
Powerpoint presentation template libraryPowerpoint presentation template library
Powerpoint presentation template library
Body of Knowledge
 
Hypothesis Test Bank with Solutions
Hypothesis Test Bank with SolutionsHypothesis Test Bank with Solutions
Hypothesis Test Bank with Solutions
Body of Knowledge
 
Project Handover Document Template
Project Handover Document TemplateProject Handover Document Template
Project Handover Document Template
Body of Knowledge
 
Voice of Customer
Voice of CustomerVoice of Customer
Voice of Customer
Body of Knowledge
 
Six Sigma DMAIC Case Study
Six Sigma DMAIC Case StudySix Sigma DMAIC Case Study
Six Sigma DMAIC Case Study
Body of Knowledge
 
Industrialisation of Analytics in India
Industrialisation of Analytics in IndiaIndustrialisation of Analytics in India
Industrialisation of Analytics in India
Body of Knowledge
 

More from Body of Knowledge (8)

Smart Art Graphics Ready to Use Template
Smart Art Graphics Ready to Use TemplateSmart Art Graphics Ready to Use Template
Smart Art Graphics Ready to Use Template
 
Process maturity
Process maturityProcess maturity
Process maturity
 
Powerpoint presentation template library
Powerpoint presentation template libraryPowerpoint presentation template library
Powerpoint presentation template library
 
Hypothesis Test Bank with Solutions
Hypothesis Test Bank with SolutionsHypothesis Test Bank with Solutions
Hypothesis Test Bank with Solutions
 
Project Handover Document Template
Project Handover Document TemplateProject Handover Document Template
Project Handover Document Template
 
Voice of Customer
Voice of CustomerVoice of Customer
Voice of Customer
 
Six Sigma DMAIC Case Study
Six Sigma DMAIC Case StudySix Sigma DMAIC Case Study
Six Sigma DMAIC Case Study
 
Industrialisation of Analytics in India
Industrialisation of Analytics in IndiaIndustrialisation of Analytics in India
Industrialisation of Analytics in India
 

Recently uploaded

Sustainability: Balancing the Environment, Equity & Economy
Sustainability: Balancing the Environment, Equity & EconomySustainability: Balancing the Environment, Equity & Economy
Sustainability: Balancing the Environment, Equity & Economy
Operational Excellence Consulting
 
ModelingMarketingStrategiesMKS.CollumbiaUniversitypdf
ModelingMarketingStrategiesMKS.CollumbiaUniversitypdfModelingMarketingStrategiesMKS.CollumbiaUniversitypdf
ModelingMarketingStrategiesMKS.CollumbiaUniversitypdf
fisherameliaisabella
 
anas about venice for grade 6f about venice
anas about venice for grade 6f about veniceanas about venice for grade 6f about venice
anas about venice for grade 6f about venice
anasabutalha2013
 
ENTREPRENEURSHIP TRAINING.ppt for graduating class (1).ppt
ENTREPRENEURSHIP TRAINING.ppt for graduating class (1).pptENTREPRENEURSHIP TRAINING.ppt for graduating class (1).ppt
ENTREPRENEURSHIP TRAINING.ppt for graduating class (1).ppt
zechu97
 
Buy Verified PayPal Account | Buy Google 5 Star Reviews
Buy Verified PayPal Account | Buy Google 5 Star ReviewsBuy Verified PayPal Account | Buy Google 5 Star Reviews
Buy Verified PayPal Account | Buy Google 5 Star Reviews
usawebmarket
 
Digital Transformation and IT Strategy Toolkit and Templates
Digital Transformation and IT Strategy Toolkit and TemplatesDigital Transformation and IT Strategy Toolkit and Templates
Digital Transformation and IT Strategy Toolkit and Templates
Aurelien Domont, MBA
 
The Influence of Marketing Strategy and Market Competition on Business Perfor...
The Influence of Marketing Strategy and Market Competition on Business Perfor...The Influence of Marketing Strategy and Market Competition on Business Perfor...
The Influence of Marketing Strategy and Market Competition on Business Perfor...
Adam Smith
 
What are the main advantages of using HR recruiter services.pdf
What are the main advantages of using HR recruiter services.pdfWhat are the main advantages of using HR recruiter services.pdf
What are the main advantages of using HR recruiter services.pdf
HumanResourceDimensi1
 
CADAVER AS OUR FIRST TEACHER anatomt in your.pptx
CADAVER AS OUR FIRST TEACHER anatomt in your.pptxCADAVER AS OUR FIRST TEACHER anatomt in your.pptx
CADAVER AS OUR FIRST TEACHER anatomt in your.pptx
fakeloginn69
 
Affordable Stationery Printing Services in Jaipur | Navpack n Print
Affordable Stationery Printing Services in Jaipur | Navpack n PrintAffordable Stationery Printing Services in Jaipur | Navpack n Print
Affordable Stationery Printing Services in Jaipur | Navpack n Print
Navpack & Print
 
Attending a job Interview for B1 and B2 Englsih learners
Attending a job Interview for B1 and B2 Englsih learnersAttending a job Interview for B1 and B2 Englsih learners
Attending a job Interview for B1 and B2 Englsih learners
Erika906060
 
ikea_woodgreen_petscharity_dog-alogue_digital.pdf
ikea_woodgreen_petscharity_dog-alogue_digital.pdfikea_woodgreen_petscharity_dog-alogue_digital.pdf
ikea_woodgreen_petscharity_dog-alogue_digital.pdf
agatadrynko
 
amptalk_RecruitingDeck_english_2024.06.05
amptalk_RecruitingDeck_english_2024.06.05amptalk_RecruitingDeck_english_2024.06.05
amptalk_RecruitingDeck_english_2024.06.05
marketing317746
 
Search Disrupted Google’s Leaked Documents Rock the SEO World.pdf
Search Disrupted Google’s Leaked Documents Rock the SEO World.pdfSearch Disrupted Google’s Leaked Documents Rock the SEO World.pdf
Search Disrupted Google’s Leaked Documents Rock the SEO World.pdf
Arihant Webtech Pvt. Ltd
 
一比一原版加拿大渥太华大学毕业证(uottawa毕业证书)如何办理
一比一原版加拿大渥太华大学毕业证(uottawa毕业证书)如何办理一比一原版加拿大渥太华大学毕业证(uottawa毕业证书)如何办理
一比一原版加拿大渥太华大学毕业证(uottawa毕业证书)如何办理
taqyed
 
Cracking the Workplace Discipline Code Main.pptx
Cracking the Workplace Discipline Code Main.pptxCracking the Workplace Discipline Code Main.pptx
Cracking the Workplace Discipline Code Main.pptx
Workforce Group
 
Business Valuation Principles for Entrepreneurs
Business Valuation Principles for EntrepreneursBusiness Valuation Principles for Entrepreneurs
Business Valuation Principles for Entrepreneurs
Ben Wann
 
The effects of customers service quality and online reviews on customer loyal...
The effects of customers service quality and online reviews on customer loyal...The effects of customers service quality and online reviews on customer loyal...
The effects of customers service quality and online reviews on customer loyal...
balatucanapplelovely
 
5 Things You Need To Know Before Hiring a Videographer
5 Things You Need To Know Before Hiring a Videographer5 Things You Need To Know Before Hiring a Videographer
5 Things You Need To Know Before Hiring a Videographer
ofm712785
 
Project File Report BBA 6th semester.pdf
Project File Report BBA 6th semester.pdfProject File Report BBA 6th semester.pdf
Project File Report BBA 6th semester.pdf
RajPriye
 

Recently uploaded (20)

Sustainability: Balancing the Environment, Equity & Economy
Sustainability: Balancing the Environment, Equity & EconomySustainability: Balancing the Environment, Equity & Economy
Sustainability: Balancing the Environment, Equity & Economy
 
ModelingMarketingStrategiesMKS.CollumbiaUniversitypdf
ModelingMarketingStrategiesMKS.CollumbiaUniversitypdfModelingMarketingStrategiesMKS.CollumbiaUniversitypdf
ModelingMarketingStrategiesMKS.CollumbiaUniversitypdf
 
anas about venice for grade 6f about venice
anas about venice for grade 6f about veniceanas about venice for grade 6f about venice
anas about venice for grade 6f about venice
 
ENTREPRENEURSHIP TRAINING.ppt for graduating class (1).ppt
ENTREPRENEURSHIP TRAINING.ppt for graduating class (1).pptENTREPRENEURSHIP TRAINING.ppt for graduating class (1).ppt
ENTREPRENEURSHIP TRAINING.ppt for graduating class (1).ppt
 
Buy Verified PayPal Account | Buy Google 5 Star Reviews
Buy Verified PayPal Account | Buy Google 5 Star ReviewsBuy Verified PayPal Account | Buy Google 5 Star Reviews
Buy Verified PayPal Account | Buy Google 5 Star Reviews
 
Digital Transformation and IT Strategy Toolkit and Templates
Digital Transformation and IT Strategy Toolkit and TemplatesDigital Transformation and IT Strategy Toolkit and Templates
Digital Transformation and IT Strategy Toolkit and Templates
 
The Influence of Marketing Strategy and Market Competition on Business Perfor...
The Influence of Marketing Strategy and Market Competition on Business Perfor...The Influence of Marketing Strategy and Market Competition on Business Perfor...
The Influence of Marketing Strategy and Market Competition on Business Perfor...
 
What are the main advantages of using HR recruiter services.pdf
What are the main advantages of using HR recruiter services.pdfWhat are the main advantages of using HR recruiter services.pdf
What are the main advantages of using HR recruiter services.pdf
 
CADAVER AS OUR FIRST TEACHER anatomt in your.pptx
CADAVER AS OUR FIRST TEACHER anatomt in your.pptxCADAVER AS OUR FIRST TEACHER anatomt in your.pptx
CADAVER AS OUR FIRST TEACHER anatomt in your.pptx
 
Affordable Stationery Printing Services in Jaipur | Navpack n Print
Affordable Stationery Printing Services in Jaipur | Navpack n PrintAffordable Stationery Printing Services in Jaipur | Navpack n Print
Affordable Stationery Printing Services in Jaipur | Navpack n Print
 
Attending a job Interview for B1 and B2 Englsih learners
Attending a job Interview for B1 and B2 Englsih learnersAttending a job Interview for B1 and B2 Englsih learners
Attending a job Interview for B1 and B2 Englsih learners
 
ikea_woodgreen_petscharity_dog-alogue_digital.pdf
ikea_woodgreen_petscharity_dog-alogue_digital.pdfikea_woodgreen_petscharity_dog-alogue_digital.pdf
ikea_woodgreen_petscharity_dog-alogue_digital.pdf
 
amptalk_RecruitingDeck_english_2024.06.05
amptalk_RecruitingDeck_english_2024.06.05amptalk_RecruitingDeck_english_2024.06.05
amptalk_RecruitingDeck_english_2024.06.05
 
Search Disrupted Google’s Leaked Documents Rock the SEO World.pdf
Search Disrupted Google’s Leaked Documents Rock the SEO World.pdfSearch Disrupted Google’s Leaked Documents Rock the SEO World.pdf
Search Disrupted Google’s Leaked Documents Rock the SEO World.pdf
 
一比一原版加拿大渥太华大学毕业证(uottawa毕业证书)如何办理
一比一原版加拿大渥太华大学毕业证(uottawa毕业证书)如何办理一比一原版加拿大渥太华大学毕业证(uottawa毕业证书)如何办理
一比一原版加拿大渥太华大学毕业证(uottawa毕业证书)如何办理
 
Cracking the Workplace Discipline Code Main.pptx
Cracking the Workplace Discipline Code Main.pptxCracking the Workplace Discipline Code Main.pptx
Cracking the Workplace Discipline Code Main.pptx
 
Business Valuation Principles for Entrepreneurs
Business Valuation Principles for EntrepreneursBusiness Valuation Principles for Entrepreneurs
Business Valuation Principles for Entrepreneurs
 
The effects of customers service quality and online reviews on customer loyal...
The effects of customers service quality and online reviews on customer loyal...The effects of customers service quality and online reviews on customer loyal...
The effects of customers service quality and online reviews on customer loyal...
 
5 Things You Need To Know Before Hiring a Videographer
5 Things You Need To Know Before Hiring a Videographer5 Things You Need To Know Before Hiring a Videographer
5 Things You Need To Know Before Hiring a Videographer
 
Project File Report BBA 6th semester.pdf
Project File Report BBA 6th semester.pdfProject File Report BBA 6th semester.pdf
Project File Report BBA 6th semester.pdf
 

Hypothesis Testing in Six Sigma

  • 1. What is Hypothesis Testing?  In hypothesis testing, relatively small samples are used to answer questions about population parameters (inferential statistics)  There is always a chance that the selected sample is not representative of the population; therefore, there is always a chance that the conclusion obtained is wrong  With some assumptions, inferential statistics allows the estimation of the probability of getting an “odd” sample and quantifies the probability (p- value) of a wrong conclusion
  • 2. Hypothesis Testing–Introduction - Refers to the use of statistical analysis to determine if observed differences between two or more data samples are due to random chance or to be true differences in the samples - Increase your confidence that probable X’s are statistically significant - Used when you need to be confident that a statistical difference exists
  • 3. Hypothesis Testing For Equal Means  The histograms below show the height of inhabitants of countries A and B.  Both samples are of size 100, the scale is the same, and the unit of measurement is inches.  Question: Is the population of country B, on average, taller than that of country A? Country A Country B [inch] 60.0 62.0 64.0 66.0 68.0 70.0 72.0 74.0 76.0 78.0 80.0
  • 4. Concepts Of Hypothesis Testing 1. All processes have variation. 2. Samples from one given process may vary. 3. How can we differentiate between sample–based “chance” variation and a true process difference?
  • 5. Kinds Of Differences Continuous data: - Differences in averages - Differences in variation - Differences in distribution “shape” of values Discrete data: - Differences in proportions
  • 6. Hypothesis Testing Guilty vs. Innocent Example The American justice system can be used to illustrate the concept of hypothesis testing. In America, we assume innocence until proven guilty. This corresponds to the null hypothesis. It requires strong evidence “beyond a reasonable doubt” to convict the defendant. This corresponds to rejecting the null hypothesis and accepting the alternate hypothesis. Ho: person is innocent Ha: person is guilty
  • 7. Nature Of Hypothesis Null Hypothesis (Ho): Usually describes a status quo The one you assume unless otherwise Shown The one you reject or fail to reject based upon evidence Signs used in Minitab: = or > or < Alternative Hypothesis (Ha): Usually describes a difference Signs used in Minitab: or < or >≠
  • 8. Activity–Hypothesis Statements (10 minutes) Write the null and alternate hypothesis testing statements for each scenario below: Scenario 1: You have collected delivery time of supplier A and supplier B. You wish to test whether or not there is a difference in delivery time from supplier A and B. Null hypothesis statement : Alternate hypothesis statement: Scenario 2: You suspect that there is a difference in cycle time to process purchase orders in site 1 of your company compared to site 2. You are going to perform a hypothesis test to verify your hypothesis. Null hypothesis statement : Alternate hypothesis statement: Scenario 3: You have implemented process improvements to reduce the cycle time to process purchase orders in your company. You have collected cycle time before the process improvements and after the process improvement was implemented. You are going to perform a hypothesis test to verify that the process improvements have resulted in a reduction in cycle time. Null hypothesis statement : Alternate hypothesis statement:
  • 9. Hypothesis Testing Guilty vs. Innocent Example The only four possible outcomes: 1. An innocent person is set free. Correct decision 2. An innocent person is jailed. Type I error = α The probability of this type of error occurring we represent as 3. A guilty person is set free. Type II error = β The probability of this type of error occurring we represent as 4. A guilty person is jailed. Correct decision
  • 10. Hypothesis Testing–Another View TruthTruth Ho Ha VerdictVerdict Ho Ha Innocent, Jailed Type I α Guilty, Set Free Type II β Innocent, Set Free Guilty, Jailed Innocent Guilty Set Free Jailed Ho: Person is innocent. Ha: Person is guilty. Incorrectl y REJECT Ho Incorrectl y ACCEPT Ho
  • 11. Hypothesis Testing  The P-value is calculated by Minitab - The probability of getting the observed difference or greater when the Ho is true. If p > 0.05, then there is no statistical evidence of a difference existing. - Ranges from 0.0 - 1.0 - The alpha (α) level is usually set at 0.05. Alpha is the probability of making a Type I Error (concluding there is a statistical difference between samples when there really is no difference). P > α : Accept Ho P ≤ α: Reject Ho
  • 12. Statistical Tests In Minitab Some basic statistical tests are shown below with the command for running each test in Minitab. Variance among two or more populations is different. Homogeneity of Variance Stat > ANOVA > Homogeneity of Variance Output (Y) changes as the input (X) changes. Linear Regression Stat > Regression >Fitted Line Plot Output counts from two two or more subgroups differ. Chi-Square Test of Independence Stat > Tables > Cross Tabulation OR Chi-Square Test Box Plots Scatter Plots C ABD E Frequency Category Pareto MNO What The Tool Tests Statistical Test Graphical Test Mean of population data is different from an established target. 1-Sample t-test Stat > Basic Statistics > 1-Sample t Mean of population 1 is different from mean of population 2. 2-Sample t-test Stat > Basic Statistics > 2-Sample t The means of two or more populations is different. 1-Way ANOVA Stat > ANOVA > One-Way Histogram Histogram Histogram Normality Test Stat > Basic Statistics Data is normally distributed
  • 13. Select A Statistical Test  Hypothesis tests to find relationships between project Y and potential X’s Simple Linear Regression 2 Sample t-Test (Compare Means of two samples) ANOVA (Compare means of multiple samples) Homgeneity of Variance (Compare variances) ContinuousContinuous DiscreteDiscrete Discrete Continuous X Chi-Square Test Y Logistic Regression
  • 14. Hypothesis Test Summary Normal Data Variance Tests (Continuous Y) F-test- Compares two sample variances. Homogeneity of Variance –Compares two or more sample variances (use Levene’s Test) Mean Tests (Continuous Y) T-test One-sample–Tests if sample mean is equal to a known mean or target. T-test Two-sample–Tests if two sample means are equal. ANOVA One-Way–Tests if two or more sample means are equal. ANOVA Two-Way–Tests if means from samples classified by two categories are equal. Correlation–Tests linear relation- ship between two variables. Regression–Defines the linear relationship between a dependent and independent variable. (Here, “Normality” applies to the residuals of the regression.) Non-Normal Data Variance Tests (Continuous Y) Homogeneity of Variance–Compares two or more sample variances (use Levene’s Test) Median Tests (Continuous Y) Mood’s Median Test–Another test for two or more medians. More robust to outliers in data. Correlation–Tests linear relationship between two variables. Proportion Tests (Discrete Y) P-Test–Tests if two population proportions are equal. Chi-Square Test–Tests if three or more relative counts are equal.
  • 16. Choosing The Correct Hypothesis Test *HOV (test spread) *Mood’s Median (test center) *HOV (test spread) *ANOVA (test center) Comparing 2 or fewer Groups? Can I Match X’s With X’s? Are we comparing the mean to a Standard? Paired t 1 Sample t NO NO NO YES YES Is the data normal? NO YES *CHI SQUARE (X2 ) Are Y’s Continuous? NO YES YES *HOV (spread) *2 Sample t–Test (center) Are X’s Discrete? YES Logistic Regression NO Is Y Continuous? NO Yes *Linear Regression (Note: Do HOV first and use results to refine 2 Sample t) Multiple Groups START * Instructions for these tests are on the following pages Pre and Post Improvement (center)
  • 17. Choosing the Appropriate Test There are four items that we need to consider before we select the right statistical test: 1. Is the Y Continuous or Discrete 2. Is (are) the X(s) Continuous or Discrete 3. Are we trying to compare the Variation or Centering 4. Is Y Normal or non-Normal Note: Not all four questions are used for the selection of the proper test...
  • 18. Statistical Test Flow Chart Is Y Continuous or Discrete? Is X Continuous or Discrete? Is X Continuous or Discrete? Chi-Square Variation or Centering? Discrete Continuou s Continuou s Discrete Continuou s Discrete Binomial Logistic Regression Regression Correlation Mood's Median Mann Whitney Centering Normal or Non-Normal Data Non-Normal Non- Parametric Tests Normal No ANOVA No Comparing Relative to a Target? Comparing only Two Groups? 2 Sample t-Test Yes 1 Sample t-Test Yes Normal or Non-Normal Data Variation Homogeneity of Variance Bartlett's Homogeneity of Variance F-test Homogeneity of Variance Levene's Normal Non- Normal Note: Even though the tests are broken down by whether the dependent variable (Y) is normal or not, you may still perform the test as long as you know the limitations of the test
  • 19. Which Hypothesis Testing Tool Would You Use? For each scenario described below, which hypothesis testing tool would you use? Assume normal distribution, where appropriate 1. A six-sigma project is being conducted in the field to improve the cycle time for warranty repair returns. The warranty return cycle time was measured for a period of 6 weeks for 4 regions. The Green Belt suspects that there is a difference in average warranty repair cycle time among each of the regions. How would you test whether there is a statistically significant difference in mean cycle time for the different regions? 2. Tungsten steel erosion shields are fitted to the low pressure blading in steam turbines. The most important feature of a shield is its resistance to wear. Resistance to wear can be measured by abrasion loss, which is thought to be associated with the hardness of steel. How would you test whether there is a statistically significant relationship between resistance to wear and abrasion hardness of steel? 3. Your business purchases sheet stock from two different suppliers. It has found an unacceptably large number of defects being caused by thickness beyond tolerance levels. Data for overall mean thickness data was analyzed and found to be on target. Data was collected that would identify a potential difference in the variation of the thickness of the material by supplier. 4. Checks Are Us is a payroll processing firm. Timecard errors are routinely monitored and recorded. A Black Belt investigating the errors wishes to determine if there are any differences in the number of errors among five of its major customers. The number of errors contained in a sample of 150 employees was recorded for five weeks. How would you test if there is a statistically significant difference in the number of errors among the customers?

Editor's Notes

  1. An assertion or conjecture about one or more parameters of a population(s). To determine whether it is true or false, we must examine the entire population, this is impossible!! Instead, use a random sample to provide evidencethat either supports or does not support the hypothesis The conclusion is then based upon statistical significance It is important to remember that this conclusion isan inference about the population determined from the sample data
  2. Issue: how conclusive is the evidence that the sample results indicate a real, more-than-random effect in the underlying population or process? In the Analyze phase we will try to determine which X’s have an effect on the Y. We can compare two sets of data, with X set at different values, thereby determining if that X has an effect. Examples: Does a process perform better using machine/material/fixture/tool A or B? Does the purchased material conform to the desired specifications? Is there a difference in performance between vendor A or B? Is there a difference in your process after you make a change? Is the process on target?
  3. To improve processes, we need to identify factors which impact the mean or standard deviation. Once we have identified these factors and made adjustments for improvement, we need to validate actual improvements in our processes. Sometimes we cannot decide graphically or by using calculated statistics (sample mean and standard deviation) if there is a statistically significant difference between processes. In such cases the decision will be subjective. We perform a formal statistical hypothesis test to decide objectively whether there is a difference.
  4. There are a variety of different hypothesis tests. Each one tests for a different kind of “difference.”
  5. Note that we are not proving the hypothesis to be true or false. We will reject or fail to reject the null hypothesis based on the evidence from our samples. Failing to reject the null hypothesis implies that the data does not provide sufficient evidence to conclude that a difference exists. On the other hand, rejection of the null hypothesis implies that the sample data provides sufficient evidence to say that a difference exists.
  6. Why is it important to minimize the chance of making a Type I error in a six-sigma project?
  7. This is a visual way of looking at the four possible outcomes of hypothesis testing.
  8. The p (probability) value is the statistical measure for the strength of H0, usually reported with a range between 0.0 and 1.0. The higher the p-value, the more evidence we have to support H0, that there is no difference. Think of the null hypothesis as a jury trial: the accused is innocent until proven guilty. In hypothesis testing, the samples are assumed equal until proven not. Since we are usually doing a hypothesis test to prove there is a difference, we are looking for p-values less than 0.05. By convention if p &amp;gt;.05 accept H0 (no difference). If p.05 reject H0 (difference exists).
  9. There are a number of hypothesis tests for both normal and non-normal data. You should consult a Black Belt or Master Black Belt if you are not sure which test to use for you project, or if your project involves non-normal data. The next page shows a summary of the tests that we will look at in detail during this training. We have already looked at the Normality Test in previous modules.
  10. Note: In order to use this chart, we are assuming our X’s are discrete. Otherwise, use Regression. Moods Median Test Homogeniety of Variance (Hov) – Levene’s Test Chi Square Analysis of Variance (ANOVA)