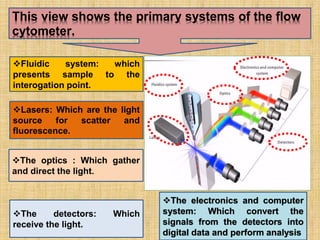
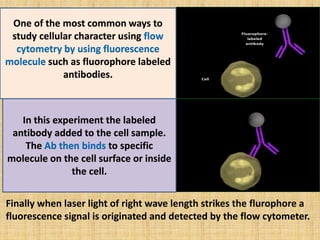
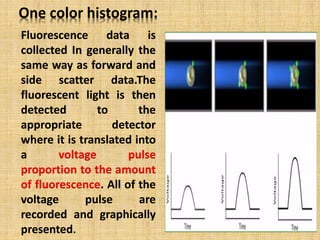
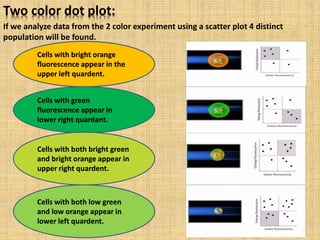
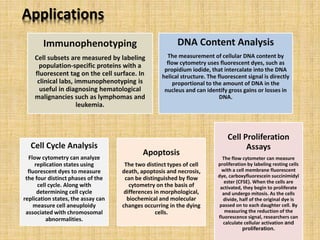
Flow Cytometry
Name: Md. Fayezur Rahaman.
Roll No:16VPATHJJ04M
Reg No: 37164
Department of Pathology
Bangladesh Agricultural University,
Mymensingh
TOPICS:
oDefinition
oprimary systems of the flow cytometer
oPrinciples and data analysis
oApplications
Flow Cytometry: Definition
Flow ~ in motion
Cyto ~ cell
Metry ~ measure
 Measuring properties of single cells in a fluid
sample.
 Gives us the ability to analyze many properties of
many cells in very little time
In biotechnology, flow cytometry is
a laser-based, biophysical technology
employed in cell counting, cell
sorting, biomarker detection by
suspending cells in a stream of fluid and
passing them by an electronic detection
apparatus.
A Flow Cytometer
Place your
sample here
Lasers: Which are the light
source for scatter and
fluorescence.
The optics : Which gather
and direct the light
The detectors: Which
receive the light.
The electronics and computer
system: Which convert the
signals from the detectors into
digital data and perform analysis
Fluidic system: which
presents sample to the
interogation point.
This view shows the primary systems of the flow
cytometer.
WORKING PRINCIPLES AND
DATA ANALYSIS
Flow cytometry
performes analyses
by passing thousands
of cells per second
through a laser bean
and capturing the
light emerges from
each cell passes
through.
The interrogation point:
It is the heart of the system, where the laser
and sample intersect and the optics collect the
resulting scatter and the fluorescense.
For accurate data
collection it is important
to particles/cells are
passed through the laser
beam one at a time.
How the sample pass through the interrogation
point?
The scattered light received
by the detector and
transmitted into a voltage
pulse.
Small cell produce small
scatter and large cell produce
large scatter . The magnitude
of the voltage pulse recorded
for each cell is proportional
to the cell size.
How laser light is used to detect
individual cell in the stream?
Forward scatter:
If we plot a histogram of
these data small cell
appears to the right and
larger cell appear to the
left
SIDE SCATTER:
These side scattered lite is focused through a lense system& is
collected by separate detector usually located 90◦ from the laser
path.
WHEN CREATE A SCATTER PLOT USING FORWARD AND
SIDE SCATTER DATA,
lymphocytes which are
small cells with low
internal complexity
Monocytes which are
medium sized Cell
with slightly more
internal complexity
Neutrophils and
other granulocytes
which are large cell,
that have a lot of
internal complexity
Finally when laser light of right wave length strikes the flurophore a
fluorescence signal is originated and detected by the flow cytometer.
One of the most common ways to
study cellular character using flow
cytometry by using fluorescence
molecule such as fluorophore labeled
antibodies.
In this experiment the labeled
antibody added to the cell sample.
The Ab then binds to specific
molecule on the cell surface or inside
the cell.
Fluorescence Detection
The fluorescent light coming
from labeled cells as they pass
through the laser travels along
the same path as the side
scatter signal. As the light
travels along this path it is
directed through a series of
filters and mirrors so the
particular wave length ranges
are determined to the
appropriate detectors.
One color histogram:
Fluorescence data is
collected In generally the
same way as forward and
side scatter data.The
fluorescent light is then
detected to the
appropriate detector
where it is translated into
a voltage pulse
proportion to the amount
of fluorescence. All of the
voltage pulse are
recorded and graphically
presented.
Two color dot plot:
If we analyze data from the 2 color experiment using a scatter plot 4 distinct
population will be found.
Cells with bright orange
fluorescence appear in the
upper left quardent.
Cells with green
fluorescence appear in
lower right quardant.
Cells with both bright green
and bright orange appear in
upper right quardent.
Cells with both low green
and low orange appear in
lower left quardent.
Applications
Immunophenotyping
Cell subsets are measured by labeling
population-specific proteins with a
fluorescent tag on the cell surface. In
clinical labs, immunophenotyping is
useful in diagnosing hematological
malignancies such as lymphomas and
leukemia.
DNA Content Analysis
The measurement of cellular DNA content by
flow cytometry uses fluorescent dyes, such as
propidium iodide, that intercalate into the DNA
helical structure. The fluorescent signal is directly
proportional to the amount of DNA in the
nucleus and can identify gross gains or losses in
DNA.
Cell Cycle Analysis
Flow cytometry can analyze
replication states using
fluorescent dyes to measure
the four distinct phases of the
cell cycle. Along with
determining cell cycle
replication states, the assay can
measure cell aneuploidy
associated with chromosomal
abnormalities.
Apoptosis
The two distinct types of cell
death, apoptosis and necrosis,
can be distinguished by flow
cytometry on the basis of
differences in morphological,
biochemical and molecular
changes occurring in the dying
cells.
Cell Proliferation
Assays
The flow cytometer can measure
proliferation by labeling resting cells
with a cell membrane fluorescent
dye, carboxyfluorescein succinimidyl
ester (CFSE). When the cells are
activated, they begin to proliferate
and undergo mitosis. As the cells
divide, half of the original dye is
passed on to each daughter cell. By
measuring the reduction of the
fluorescence signal, researchers can
calculate cellular activation and
proliferation.
References
 http://flowcytometry.berkeley.edu/pdfs/Basic%20Flow%20Cytometry.pdf
 http://www.azom.com/article.aspx?ArticleID=6020
 https://www.beckmancoulter.com/wsrportal/wsr/industrial/particle-technologies/coulter-
principle/index.htm
 http://www.cyto.purdue.edu/cdroms/cyto2/6/coulter/ss000103.htm
 http://ajcp.ascpjournals.org/content/134/2/271.full.pdf+html
 http://cancerres.aacrjournals.org/content/43/9/3982.full.pdf+html
 Appl.%20Environ.%20Microbiol.-1990-Amann-1919-25.pdf
 http://europepmc.org/abstract/med/2645625
 http://www.clinchem.org/content/46/8/1221.full
 http://www.icms.qmul.ac.uk/flowcytometry/uses/cellcycleanalysis/cellcycle/index.html
 Kuby Immunology, 7th Edition
 http://www.clinchem.org/content/46/8/1221.full
 http://www.seattlechildrens.org/research/cores/flow-cytometry/applications-of-flow-cytometry
 http://www.d.umn.edu/~biomed/flowcytometry/introflowcytometry.pdf
Flow Cytometry technique

Flow Cytometry technique

  • 1.
    Flow Cytometry Name: Md.Fayezur Rahaman. Roll No:16VPATHJJ04M Reg No: 37164 Department of Pathology Bangladesh Agricultural University, Mymensingh
  • 2.
    TOPICS: oDefinition oprimary systems ofthe flow cytometer oPrinciples and data analysis oApplications
  • 3.
    Flow Cytometry: Definition Flow~ in motion Cyto ~ cell Metry ~ measure  Measuring properties of single cells in a fluid sample.  Gives us the ability to analyze many properties of many cells in very little time
  • 4.
    In biotechnology, flowcytometry is a laser-based, biophysical technology employed in cell counting, cell sorting, biomarker detection by suspending cells in a stream of fluid and passing them by an electronic detection apparatus.
  • 5.
    A Flow Cytometer Placeyour sample here
  • 6.
    Lasers: Which arethe light source for scatter and fluorescence. The optics : Which gather and direct the light The detectors: Which receive the light. The electronics and computer system: Which convert the signals from the detectors into digital data and perform analysis Fluidic system: which presents sample to the interogation point. This view shows the primary systems of the flow cytometer.
  • 7.
  • 8.
    Flow cytometry performes analyses bypassing thousands of cells per second through a laser bean and capturing the light emerges from each cell passes through.
  • 9.
    The interrogation point: Itis the heart of the system, where the laser and sample intersect and the optics collect the resulting scatter and the fluorescense.
  • 10.
    For accurate data collectionit is important to particles/cells are passed through the laser beam one at a time. How the sample pass through the interrogation point?
  • 11.
    The scattered lightreceived by the detector and transmitted into a voltage pulse. Small cell produce small scatter and large cell produce large scatter . The magnitude of the voltage pulse recorded for each cell is proportional to the cell size. How laser light is used to detect individual cell in the stream? Forward scatter:
  • 12.
    If we plota histogram of these data small cell appears to the right and larger cell appear to the left
  • 13.
    SIDE SCATTER: These sidescattered lite is focused through a lense system& is collected by separate detector usually located 90◦ from the laser path.
  • 14.
    WHEN CREATE ASCATTER PLOT USING FORWARD AND SIDE SCATTER DATA, lymphocytes which are small cells with low internal complexity Monocytes which are medium sized Cell with slightly more internal complexity Neutrophils and other granulocytes which are large cell, that have a lot of internal complexity
  • 15.
    Finally when laserlight of right wave length strikes the flurophore a fluorescence signal is originated and detected by the flow cytometer. One of the most common ways to study cellular character using flow cytometry by using fluorescence molecule such as fluorophore labeled antibodies. In this experiment the labeled antibody added to the cell sample. The Ab then binds to specific molecule on the cell surface or inside the cell.
  • 16.
    Fluorescence Detection The fluorescentlight coming from labeled cells as they pass through the laser travels along the same path as the side scatter signal. As the light travels along this path it is directed through a series of filters and mirrors so the particular wave length ranges are determined to the appropriate detectors.
  • 17.
    One color histogram: Fluorescencedata is collected In generally the same way as forward and side scatter data.The fluorescent light is then detected to the appropriate detector where it is translated into a voltage pulse proportion to the amount of fluorescence. All of the voltage pulse are recorded and graphically presented.
  • 18.
    Two color dotplot: If we analyze data from the 2 color experiment using a scatter plot 4 distinct population will be found. Cells with bright orange fluorescence appear in the upper left quardent. Cells with green fluorescence appear in lower right quardant. Cells with both bright green and bright orange appear in upper right quardent. Cells with both low green and low orange appear in lower left quardent.
  • 19.
    Applications Immunophenotyping Cell subsets aremeasured by labeling population-specific proteins with a fluorescent tag on the cell surface. In clinical labs, immunophenotyping is useful in diagnosing hematological malignancies such as lymphomas and leukemia. DNA Content Analysis The measurement of cellular DNA content by flow cytometry uses fluorescent dyes, such as propidium iodide, that intercalate into the DNA helical structure. The fluorescent signal is directly proportional to the amount of DNA in the nucleus and can identify gross gains or losses in DNA. Cell Cycle Analysis Flow cytometry can analyze replication states using fluorescent dyes to measure the four distinct phases of the cell cycle. Along with determining cell cycle replication states, the assay can measure cell aneuploidy associated with chromosomal abnormalities. Apoptosis The two distinct types of cell death, apoptosis and necrosis, can be distinguished by flow cytometry on the basis of differences in morphological, biochemical and molecular changes occurring in the dying cells. Cell Proliferation Assays The flow cytometer can measure proliferation by labeling resting cells with a cell membrane fluorescent dye, carboxyfluorescein succinimidyl ester (CFSE). When the cells are activated, they begin to proliferate and undergo mitosis. As the cells divide, half of the original dye is passed on to each daughter cell. By measuring the reduction of the fluorescence signal, researchers can calculate cellular activation and proliferation.
  • 20.
    References  http://flowcytometry.berkeley.edu/pdfs/Basic%20Flow%20Cytometry.pdf  http://www.azom.com/article.aspx?ArticleID=6020 https://www.beckmancoulter.com/wsrportal/wsr/industrial/particle-technologies/coulter- principle/index.htm  http://www.cyto.purdue.edu/cdroms/cyto2/6/coulter/ss000103.htm  http://ajcp.ascpjournals.org/content/134/2/271.full.pdf+html  http://cancerres.aacrjournals.org/content/43/9/3982.full.pdf+html  Appl.%20Environ.%20Microbiol.-1990-Amann-1919-25.pdf  http://europepmc.org/abstract/med/2645625  http://www.clinchem.org/content/46/8/1221.full  http://www.icms.qmul.ac.uk/flowcytometry/uses/cellcycleanalysis/cellcycle/index.html  Kuby Immunology, 7th Edition  http://www.clinchem.org/content/46/8/1221.full  http://www.seattlechildrens.org/research/cores/flow-cytometry/applications-of-flow-cytometry  http://www.d.umn.edu/~biomed/flowcytometry/introflowcytometry.pdf

Editor's Notes

  • #5 Fluorescence-activated cell sorting (FACS) Cell sorting is the ability to separate cells according to their properties. These properties can be described as intracellular (inside the cell) or extracellular (outside the cell). Intracellular processes can include DNA, RNA and protein molecule interaction, whereas extracellular physical properties include size, shape (morphology), and surface protein expression. A biomarker is a measurable indicator of the severity or presence of some disease state. For example, rubidium chloride is used in isotopic labeling to evaluate perfusion of heart muscle. More specifically, a biomarker indicates a change in expression or state of a protein that correlates with the risk or progression of a disease, or with the susceptibility of the disease to a given treatment.