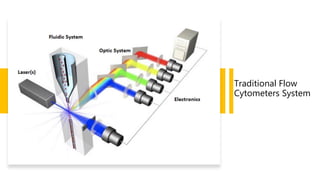
Flow Cytometry in Cell
Biology
Prepared by:
Amani Alsharidah, 441203711
Aljouhra AlHargan, 442203436
ZOO 642
Advanced Cytology
Definition
• Flow cytometry (FCM) is defined as a method for qualitative and quantitative analysis of
biological and physical properties of cells suspended in a liquid, passing through
a laser beam, in a single file.
• It is a complicated technique that works on the principle of light scattering and
fluorescence emission and provides rapid multi-parametric measurements of a single
cell.
Flow Cyto - metry
Motion Cell Measurement
An Overview
• FCM is a useful tool in cell biology because it combines different cytological examinations.
• It gives information about cell number, size, macromolecular content, in addition to genetic
identity that can be determined by various labels, stains, and probes.
• It is considered as a powerful tool that has applications in immunology, molecular biology ,
pathology, cancer biology and infectious disease.
• It offers several unique advantages as it allows fast multiparametric analysis of cell populations in
addition to enabling physical sorting of the cells to separate the subpopulations.
Flow Cytometry
Principle
• Flow cytometers utilize lasers as light sources to
produce both scattered and fluorescent light
signals that are read by detectors such as
photodiodes or photomultiplier tubes.
• These signals are converted into  electronic
signals that are analyzed by a computer and
written to a standardized format data file.
• Cell populations can be analyzed and/or purified
based on their fluorescent or light scattering
characteristics.
Traditional Flow Cytometers System
The flow system
Fluidics
The light sensing system
Optical
Signal processing
Electronic
Fluidics: The Flow
System
• Cells suspended in fluid (usually buffered
saline) are pressured to pass in a single file
to a laser point where the sample is analyzed.
• Once samples are in the sheath fluid, cells
are forced to pass one by one by
hudrodynamic focusing.
• The result of the hydrodynamic focusing is
that only ONE cell pass through the laser
beam at a given time.
Optical: The Light
Sensing System
• It consist of excitation optics (laser), and
collection optics (photomultiplier tubes) that
emit visible and fluorescence light signals to
be used to analyze samples.
• When a cell passes through the laser beam, it
emitts light (fuoresence) and scatters light
(forwad and side scattering).
Electronics: Signal
Processing
• The signals are converted into  digital
values that can be read and analyzed by
computer systems.
• It converts photons to  photoelectrons,
then it measure the pulse, then translate it
into a plot.
Traditional Flow
Cytometers System
FCM samples
Peripheral
Blood
Bone
Marrow
Tissue and
Body fluids
Flow cytometry measurement
1. Measurement of forward and side scatter of light.
2. Measurement of scatter light and fluorescence.
Measurement of forward and side scatter of
light.
• Cells or particles passing through the beam scatter light, which is detected
as FS and SS.
• Cell populations can often be distinguished based on differences in their
size and granularity.
Side scatter (SS)
• The amount of light scattered at right
angle to the indicant light beam depends
on the internal complexity of the particle,
this known Side Scatter (SSC).
• Related to cell granularity and complexity.
• Side scatter detected at 90, to the laser
beam.
Forward scatter
(FS)
• Measuring the size of the cell or
particle.
• Related to cell surface area.
• Detection along axis of incident light in
the forward direction.
Total blood counting
• Larger and more granular granulocyte cells produce a large population with high SS and FS.
• Monocytes are large cells, but not so granular, so these produce a separate population with
high FS but lower SS.
• Smaller lymphocytes and lymphoblasts produce a separate population with less FS. They
are not granular cells, so also have low SS.
• Therefore, these cells can be separated into different populations based on their FS and SS
alone.
Figure: Dot plot of FS versus SS.
Each dot represents a single cell
analyzed by the flow cytometer.
The characteristic position of different
cell populations is determined by
differences in cell size and granularity.
Measurement of scattered light and fluorescence
• As well as separating cells based on FS and SS, cells can also be separated by whether
they express a particular protein.
• In this case, a fluorochrome is often used to stain the protein of interest.
• Fluorochromes used for the detection of target proteins emit light when excited by a laser
with the corresponding excitation wavelength.
• These fluorescent stained cells or particles can be detected individually.
Flow cytometers
and fluorecent
probes
• Modern flow cytometers use many laser
wavelengths and corresponding fluorescent
probes for simultaneous analysis of 20 or more cell
characteristics.
• Advanced instruments will usually be equipped
with:
1. a cyan laser 488 nm ,
2. a red laser diode ~640 nm
3. a green, green-yellow, or yellow diode-pumped
solid-state (DPSS ) laser ( 532
,
552
,
ro
561 nm
• These lasers all excite a variety of fluorochromes.
Flow
cytometry
application
In Clinical Laboratories:
1. Immunophenotyping.
2. CD4 absolute counts.
3. Cell cycle.
4. Residual white blood cell detection.
Flow
cytometry
application
In Research Laboratories
1. Immune function studies.
2. Hematopoietic stem cells.
3. Multi-drug resistance studies (cancer).
4. Kinetics studies (cell function) Platelet
analysis (coronary disease).
5. Environmental sample analysis.
Result
Flow cytometry method for quantitation of T cell and monocyte
activation status. Representative dot plots from analysis of patient
samples are shown.
CD4+ T cells and CD8+ T cells gated on CD3+ CD4+ (A,C,E) and
CD3+ CD8+ (B,D,F) lymphocytes from (A-B), a healthy control;
(C- D), tuberculosis; (E-F), influenza;
the inserted percentages indicate the fraction of HLA-DR+ cells.
Monocyte plots gated on CD3- CD14+ monocytes from (G), a
healthy control; (H), tuberculosis; (I), influenza;
mfi = mean fluorescence intensity.
Thank You..
Any questions?
References
• Robinson, R. K. (2014). Encyclopedia of food microbiology. Academic press.
• McKinnon K. M. (2018). Flow Cytometry: An Overview. Current protocols in immunology, 120, 5.1.1–5.1.11. https://doi.org/10.1002/cpim.40
• Chantzoura, E., & Kaji, K. (2017). Flow Cytometry. In Basic Science Methods for Clinical Researchers (pp. 173-189). Academic Press.
• O'Leary TJ. Flow cytometry in diagnostic cytology. Diagn Cytopathol. 1998 Jan;18(1):41-6. doi: 10.1002/(sici)1097-0339(199801)18:1<41::aid-dc7>3.0.co;2-x.
PMID: 9451557.
• https://www.labome.com/method/Flow-Cytometry-A-Survey-and-the-Basics.html
• https://www.laserfocusworld.com/lasers-sources/article/16548156/lasers-for-the-biosciences-novel-ultraviolet-320-nm-laser-source-enhances-flow-cytometry

Flow cytometry in cell biology

  • 1.
    Flow Cytometry inCell Biology Prepared by: Amani Alsharidah, 441203711 Aljouhra AlHargan, 442203436 ZOO 642 Advanced Cytology
  • 2.
    Definition • Flow cytometry(FCM) is defined as a method for qualitative and quantitative analysis of biological and physical properties of cells suspended in a liquid, passing through a laser beam, in a single file. • It is a complicated technique that works on the principle of light scattering and fluorescence emission and provides rapid multi-parametric measurements of a single cell.
  • 3.
    Flow Cyto -metry Motion Cell Measurement
  • 4.
    An Overview • FCMis a useful tool in cell biology because it combines different cytological examinations. • It gives information about cell number, size, macromolecular content, in addition to genetic identity that can be determined by various labels, stains, and probes. • It is considered as a powerful tool that has applications in immunology, molecular biology , pathology, cancer biology and infectious disease. • It offers several unique advantages as it allows fast multiparametric analysis of cell populations in addition to enabling physical sorting of the cells to separate the subpopulations.
  • 5.
    Flow Cytometry Principle • Flowcytometers utilize lasers as light sources to produce both scattered and fluorescent light signals that are read by detectors such as photodiodes or photomultiplier tubes. • These signals are converted into  electronic signals that are analyzed by a computer and written to a standardized format data file. • Cell populations can be analyzed and/or purified based on their fluorescent or light scattering characteristics.
  • 6.
    Traditional Flow CytometersSystem The flow system Fluidics The light sensing system Optical Signal processing Electronic
  • 7.
    Fluidics: The Flow System •Cells suspended in fluid (usually buffered saline) are pressured to pass in a single file to a laser point where the sample is analyzed. • Once samples are in the sheath fluid, cells are forced to pass one by one by hudrodynamic focusing. • The result of the hydrodynamic focusing is that only ONE cell pass through the laser beam at a given time.
  • 8.
    Optical: The Light SensingSystem • It consist of excitation optics (laser), and collection optics (photomultiplier tubes) that emit visible and fluorescence light signals to be used to analyze samples. • When a cell passes through the laser beam, it emitts light (fuoresence) and scatters light (forwad and side scattering).
  • 9.
    Electronics: Signal Processing • Thesignals are converted into  digital values that can be read and analyzed by computer systems. • It converts photons to  photoelectrons, then it measure the pulse, then translate it into a plot.
  • 10.
  • 11.
  • 12.
    Flow cytometry measurement 1.Measurement of forward and side scatter of light. 2. Measurement of scatter light and fluorescence.
  • 13.
    Measurement of forwardand side scatter of light. • Cells or particles passing through the beam scatter light, which is detected as FS and SS. • Cell populations can often be distinguished based on differences in their size and granularity.
  • 14.
    Side scatter (SS) •The amount of light scattered at right angle to the indicant light beam depends on the internal complexity of the particle, this known Side Scatter (SSC). • Related to cell granularity and complexity. • Side scatter detected at 90, to the laser beam.
  • 15.
    Forward scatter (FS) • Measuringthe size of the cell or particle. • Related to cell surface area. • Detection along axis of incident light in the forward direction.
  • 16.
    Total blood counting •Larger and more granular granulocyte cells produce a large population with high SS and FS. • Monocytes are large cells, but not so granular, so these produce a separate population with high FS but lower SS. • Smaller lymphocytes and lymphoblasts produce a separate population with less FS. They are not granular cells, so also have low SS. • Therefore, these cells can be separated into different populations based on their FS and SS alone.
  • 17.
    Figure: Dot plotof FS versus SS. Each dot represents a single cell analyzed by the flow cytometer. The characteristic position of different cell populations is determined by differences in cell size and granularity.
  • 18.
    Measurement of scatteredlight and fluorescence • As well as separating cells based on FS and SS, cells can also be separated by whether they express a particular protein. • In this case, a fluorochrome is often used to stain the protein of interest. • Fluorochromes used for the detection of target proteins emit light when excited by a laser with the corresponding excitation wavelength. • These fluorescent stained cells or particles can be detected individually.
  • 19.
    Flow cytometers and fluorecent probes •Modern flow cytometers use many laser wavelengths and corresponding fluorescent probes for simultaneous analysis of 20 or more cell characteristics. • Advanced instruments will usually be equipped with: 1. a cyan laser 488 nm , 2. a red laser diode ~640 nm 3. a green, green-yellow, or yellow diode-pumped solid-state (DPSS ) laser ( 532 , 552 , ro 561 nm • These lasers all excite a variety of fluorochromes.
  • 21.
    Flow cytometry application In Clinical Laboratories: 1.Immunophenotyping. 2. CD4 absolute counts. 3. Cell cycle. 4. Residual white blood cell detection.
  • 22.
    Flow cytometry application In Research Laboratories 1.Immune function studies. 2. Hematopoietic stem cells. 3. Multi-drug resistance studies (cancer). 4. Kinetics studies (cell function) Platelet analysis (coronary disease). 5. Environmental sample analysis.
  • 24.
    Result Flow cytometry methodfor quantitation of T cell and monocyte activation status. Representative dot plots from analysis of patient samples are shown. CD4+ T cells and CD8+ T cells gated on CD3+ CD4+ (A,C,E) and CD3+ CD8+ (B,D,F) lymphocytes from (A-B), a healthy control; (C- D), tuberculosis; (E-F), influenza; the inserted percentages indicate the fraction of HLA-DR+ cells. Monocyte plots gated on CD3- CD14+ monocytes from (G), a healthy control; (H), tuberculosis; (I), influenza; mfi = mean fluorescence intensity.
  • 25.
  • 26.
    References • Robinson, R.K. (2014). Encyclopedia of food microbiology. Academic press. • McKinnon K. M. (2018). Flow Cytometry: An Overview. Current protocols in immunology, 120, 5.1.1–5.1.11. https://doi.org/10.1002/cpim.40 • Chantzoura, E., & Kaji, K. (2017). Flow Cytometry. In Basic Science Methods for Clinical Researchers (pp. 173-189). Academic Press. • O'Leary TJ. Flow cytometry in diagnostic cytology. Diagn Cytopathol. 1998 Jan;18(1):41-6. doi: 10.1002/(sici)1097-0339(199801)18:1<41::aid-dc7>3.0.co;2-x. PMID: 9451557. • https://www.labome.com/method/Flow-Cytometry-A-Survey-and-the-Basics.html • https://www.laserfocusworld.com/lasers-sources/article/16548156/lasers-for-the-biosciences-novel-ultraviolet-320-nm-laser-source-enhances-flow-cytometry

Editor's Notes

  • #24 Whole blood from patients with gram-negative bacteraemia, neuroborreliosis, tuberculosis, acute mononucleosis, influenza or a mixed connective tissue disorders, as diagnosed. routine culture and serology techniques was analysed for lymphocyte and monocyte cell surface markers using a no-wash, no-lyse protocol for multi-colour flow cytometry method. The immunophenotyping included the activation markers HLA-DR and CD40.
  • #25 The immunophenotyping included the activation markers HLA-DR and CD40. An informative pattern was obtained by combining two of the analysed parameters: (i), the fractions of HLA- DR-expressing CD4+ T cells and CD8+ T cells, respectively, and (ii), the level of CD40 on CD14+ CD16- monocytes. Patients infected with gram-negative bacteria or EBV showed a marked increase in monocyte CD40, while this effect was less pronounced for tuberculosis, borrelia and influenza. The bacterial agents could be distinguished from the viral agents by the T cell result; CD4+ T cells reacting in bacterial infection, and the CD8+ T cells dominating for the viruses. Patients with mixed connective tissue disorders also showed increased activation, but with similar engagement of CD4+ and CD8+ T cells. Analysis of soluble TNF alpha receptors was less informative due to a large inter-individual variation.