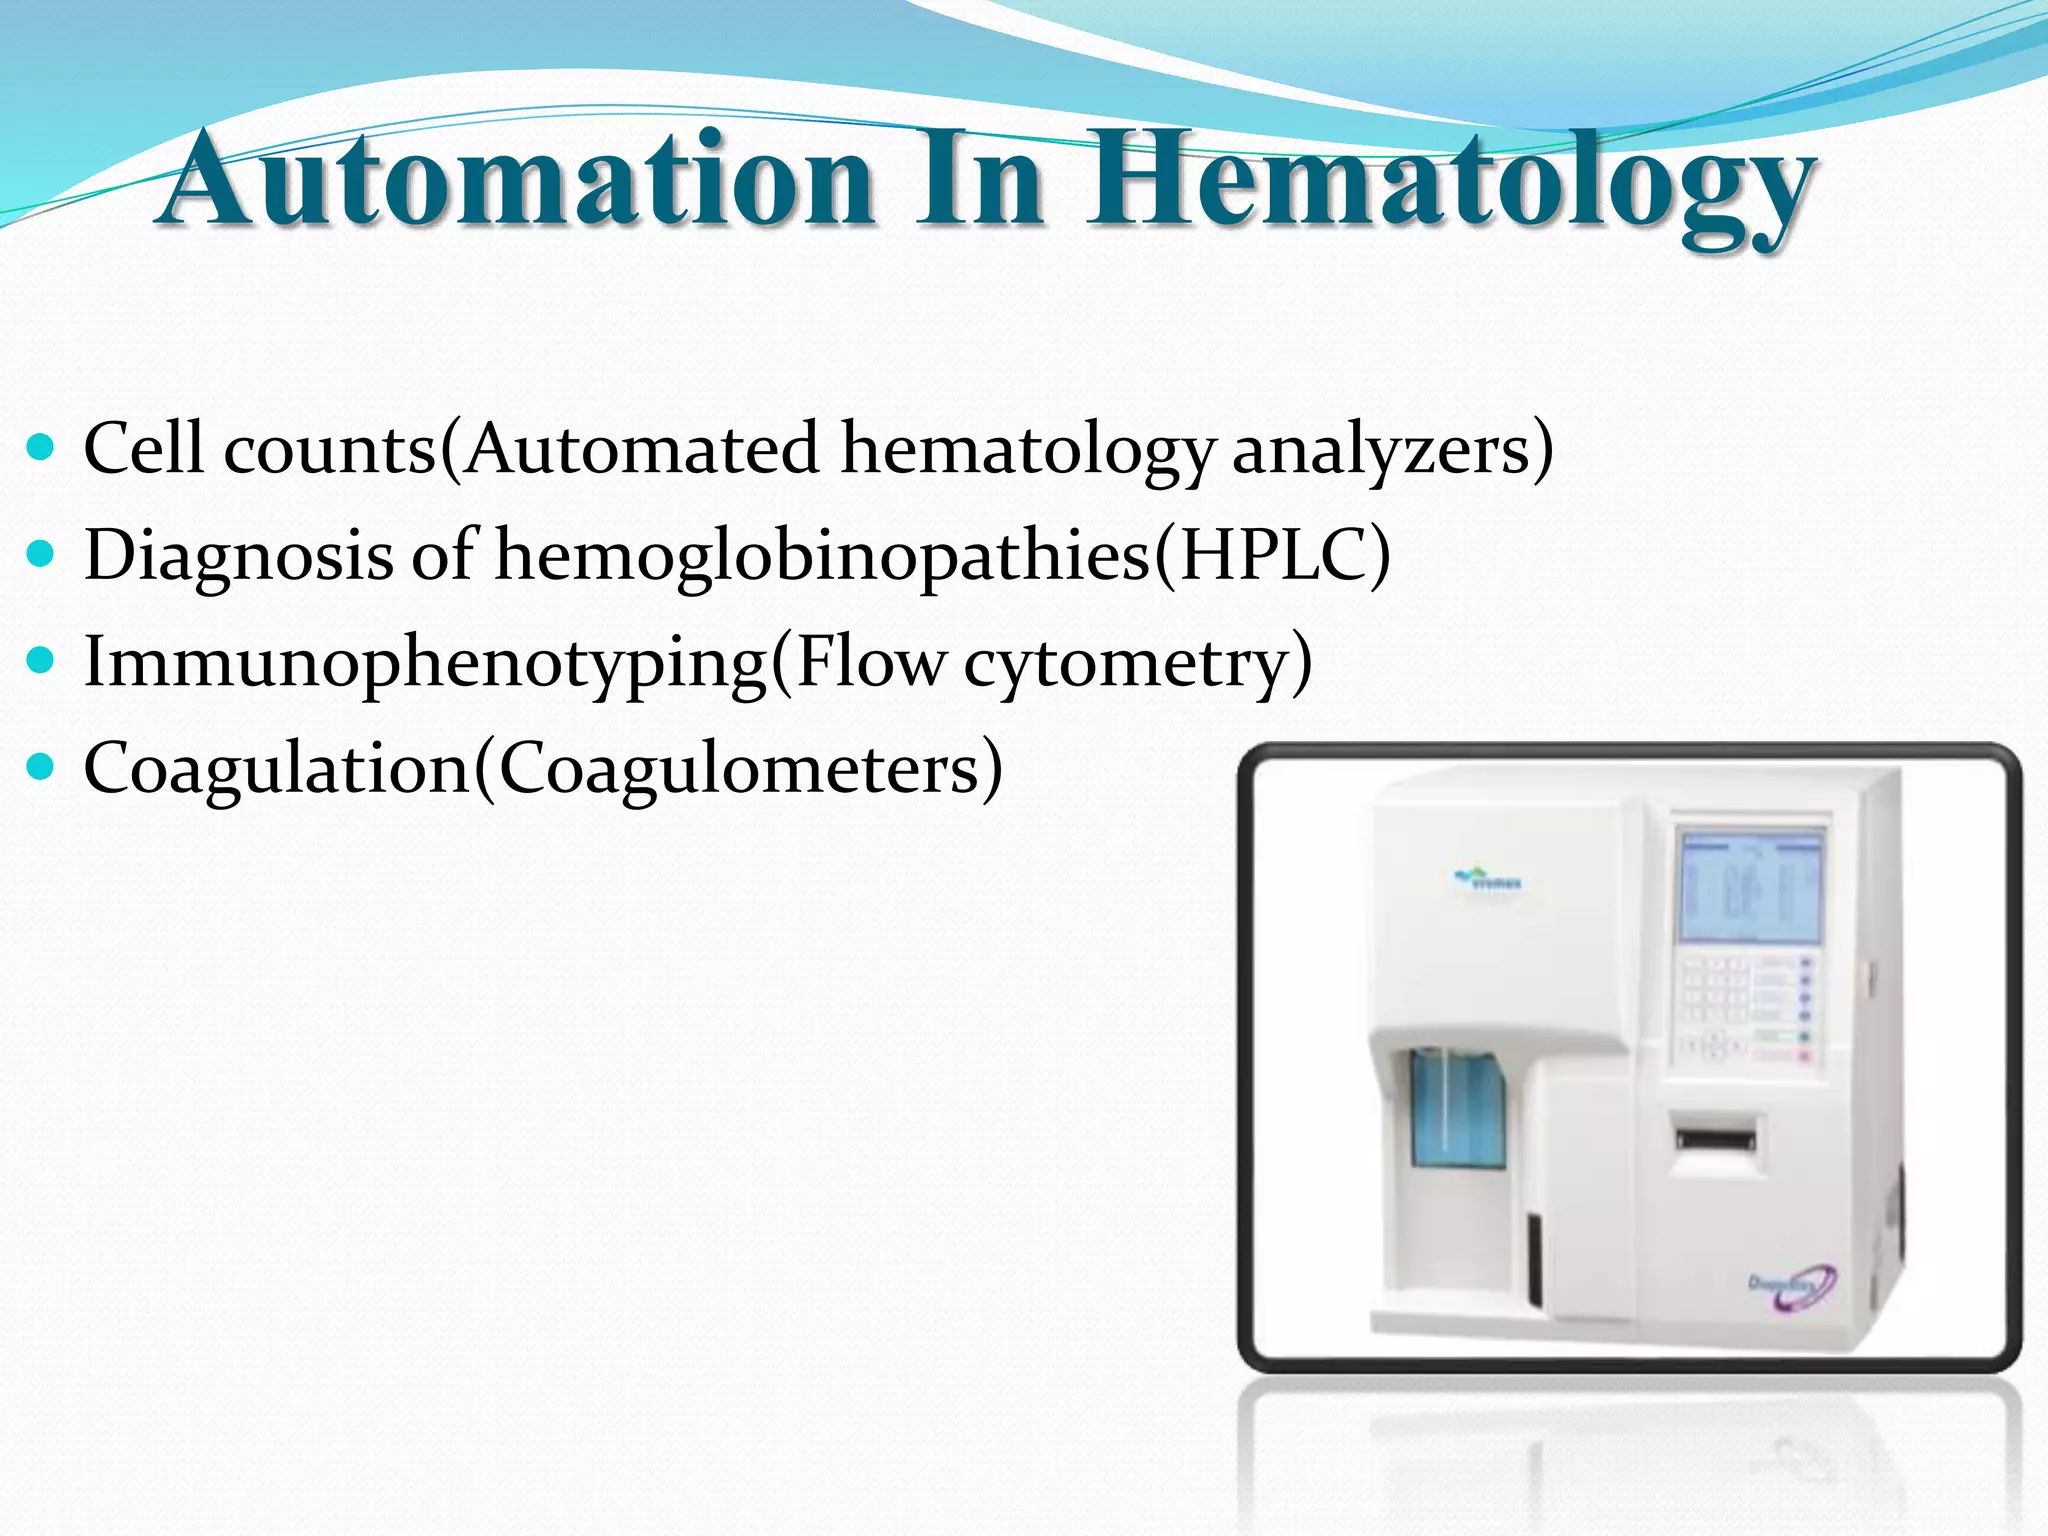
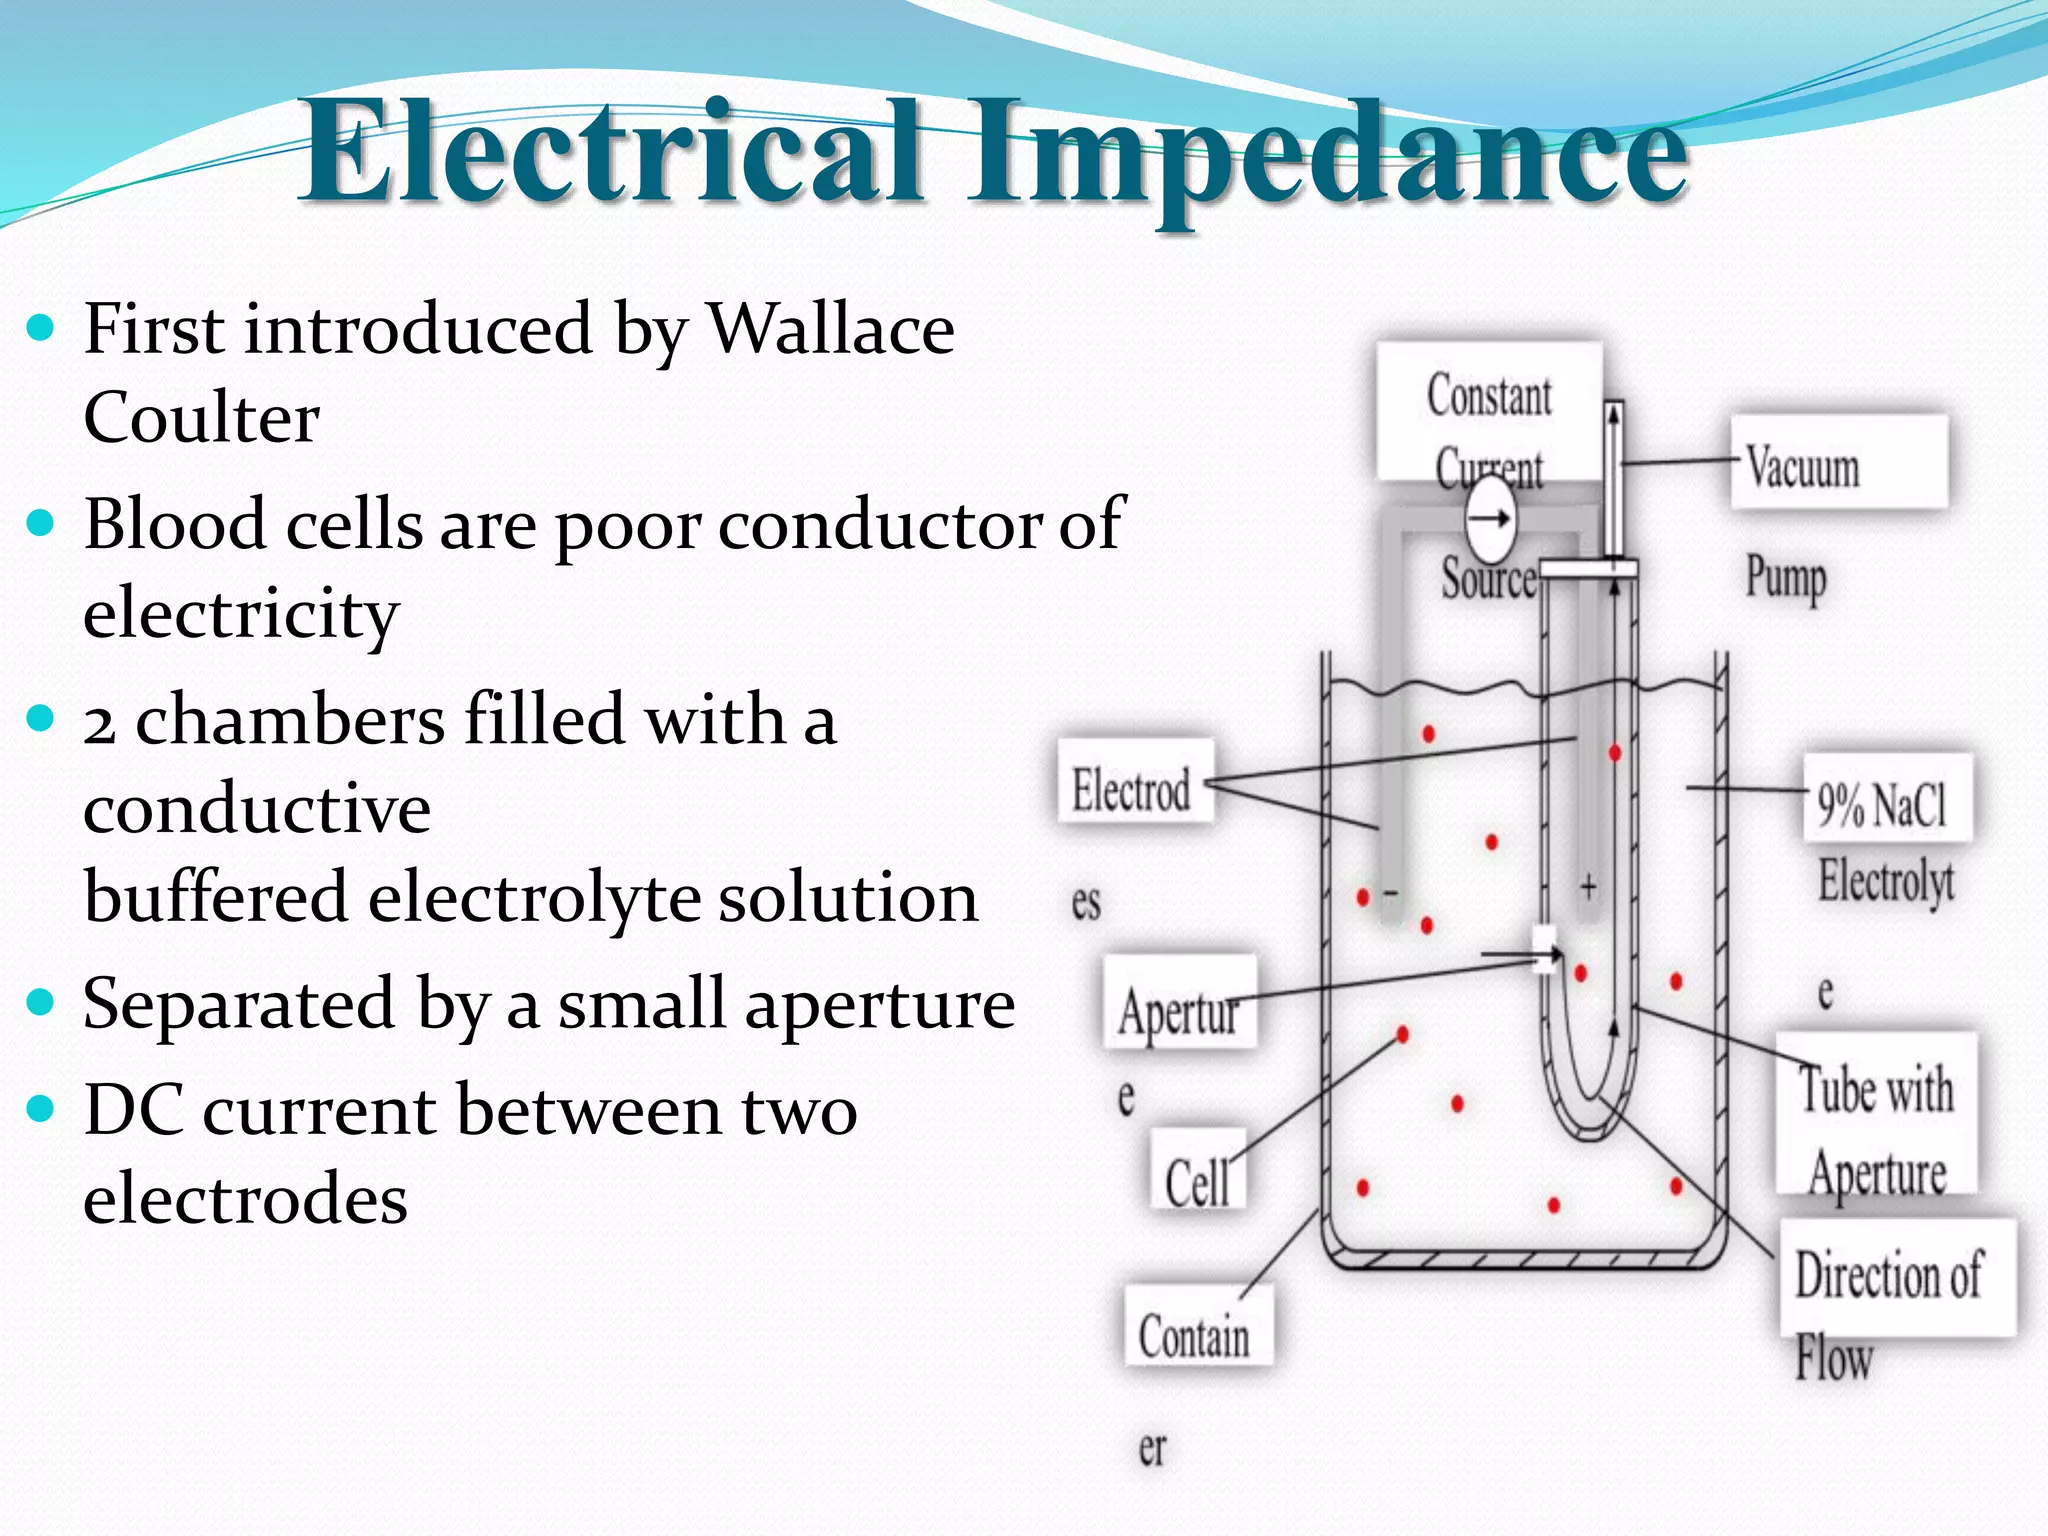
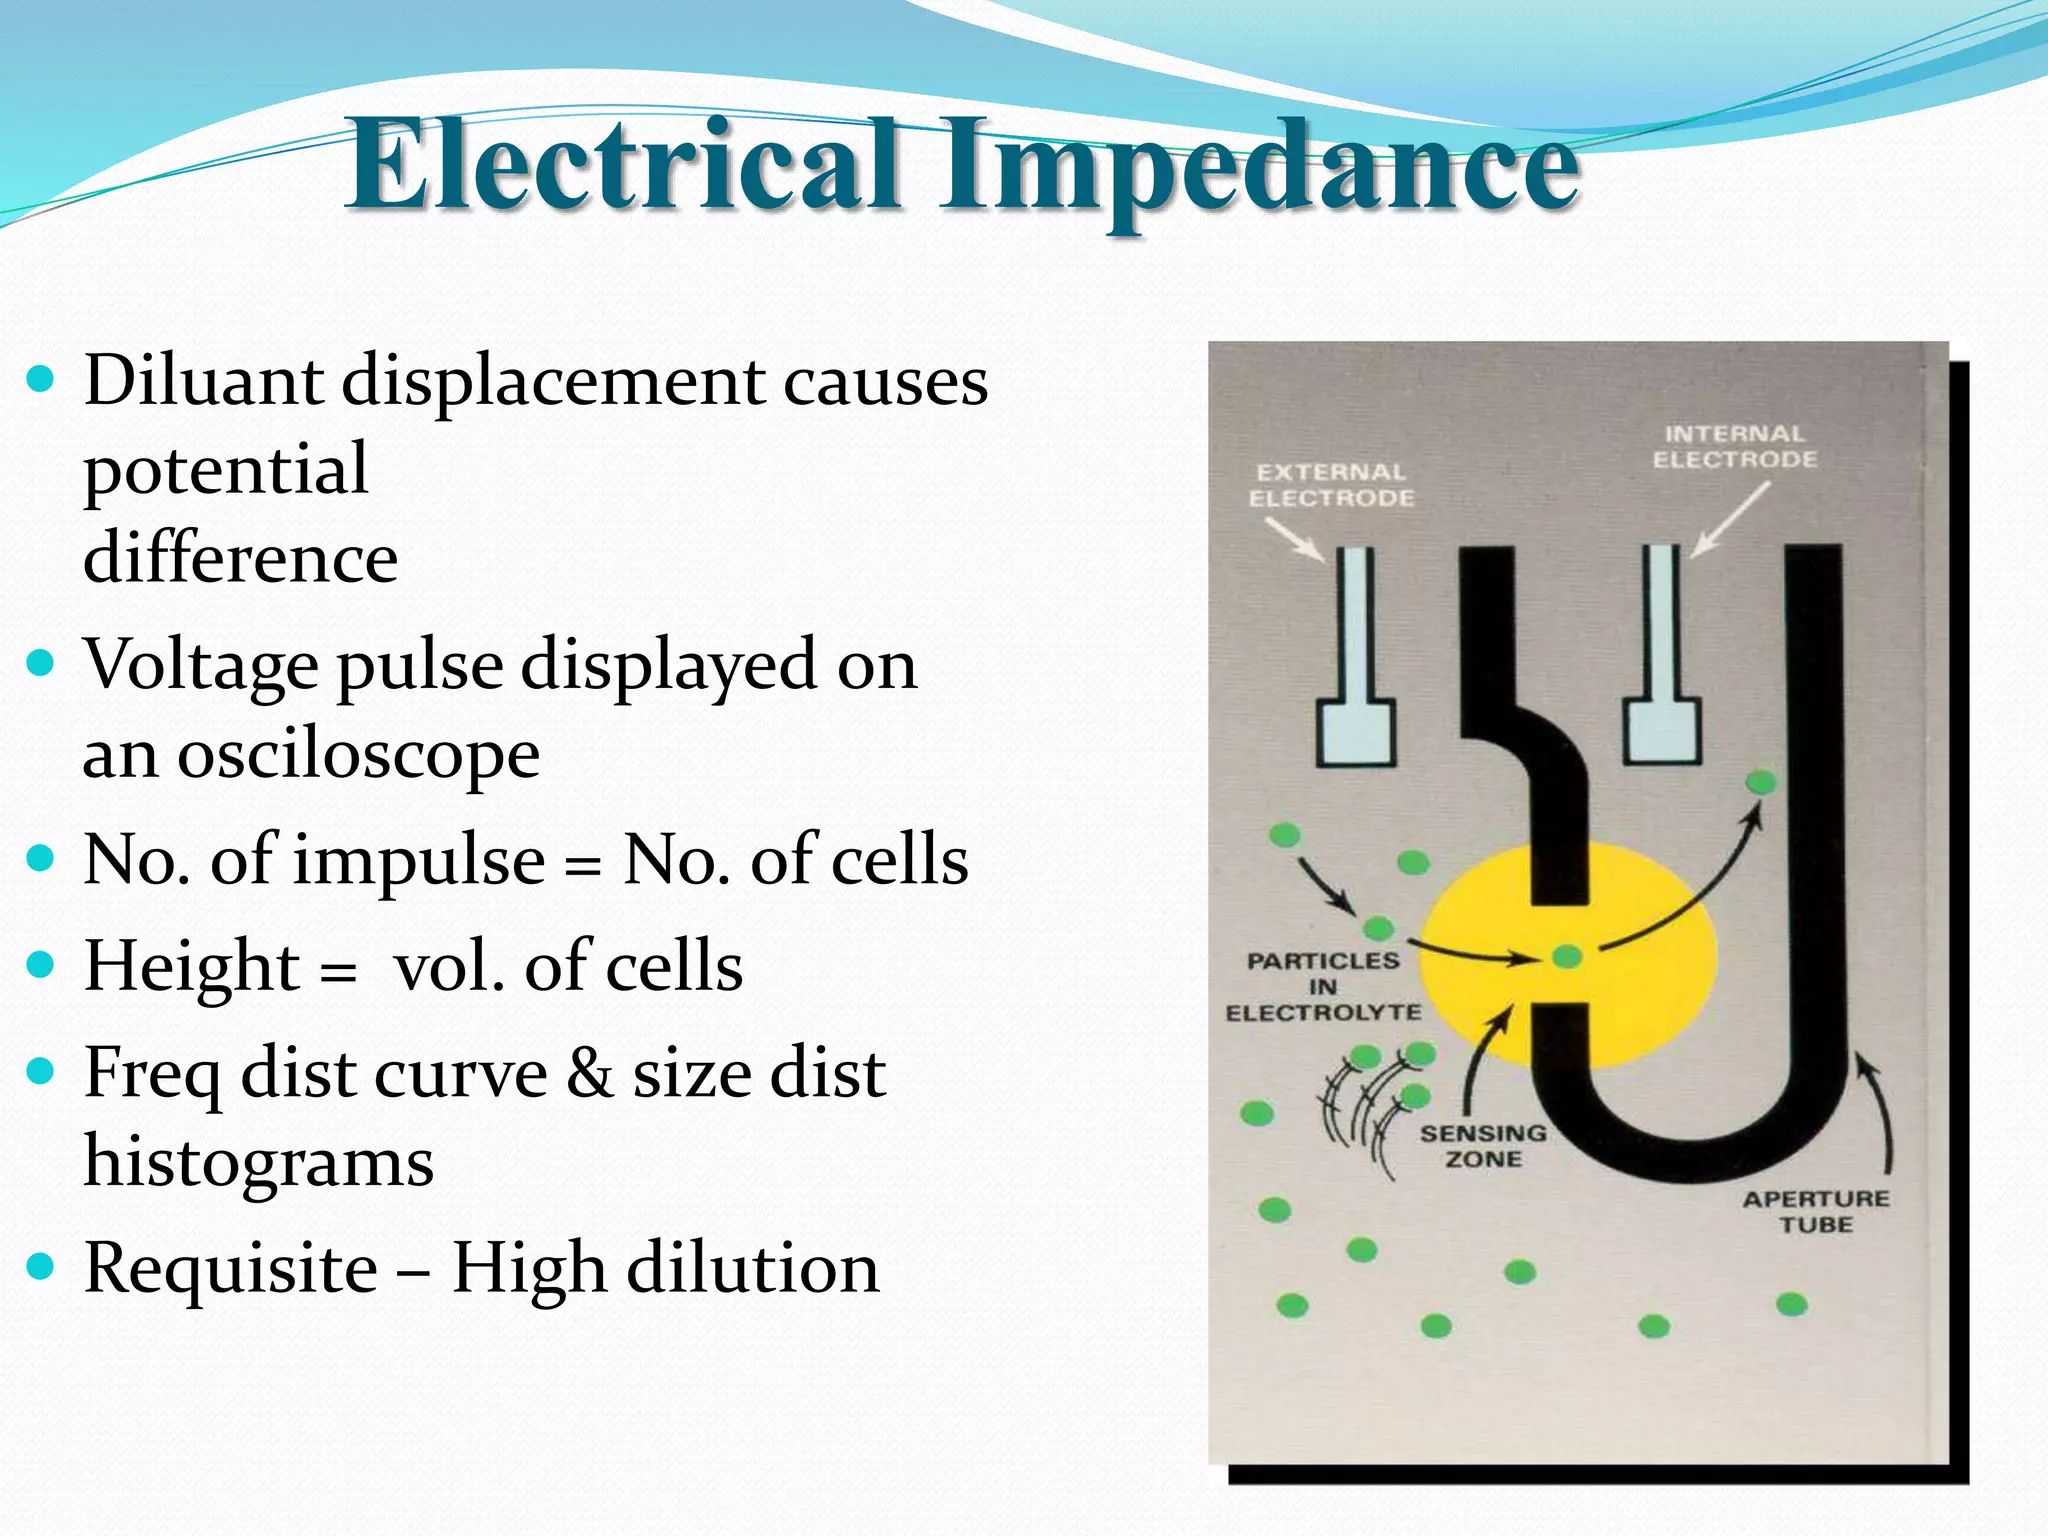
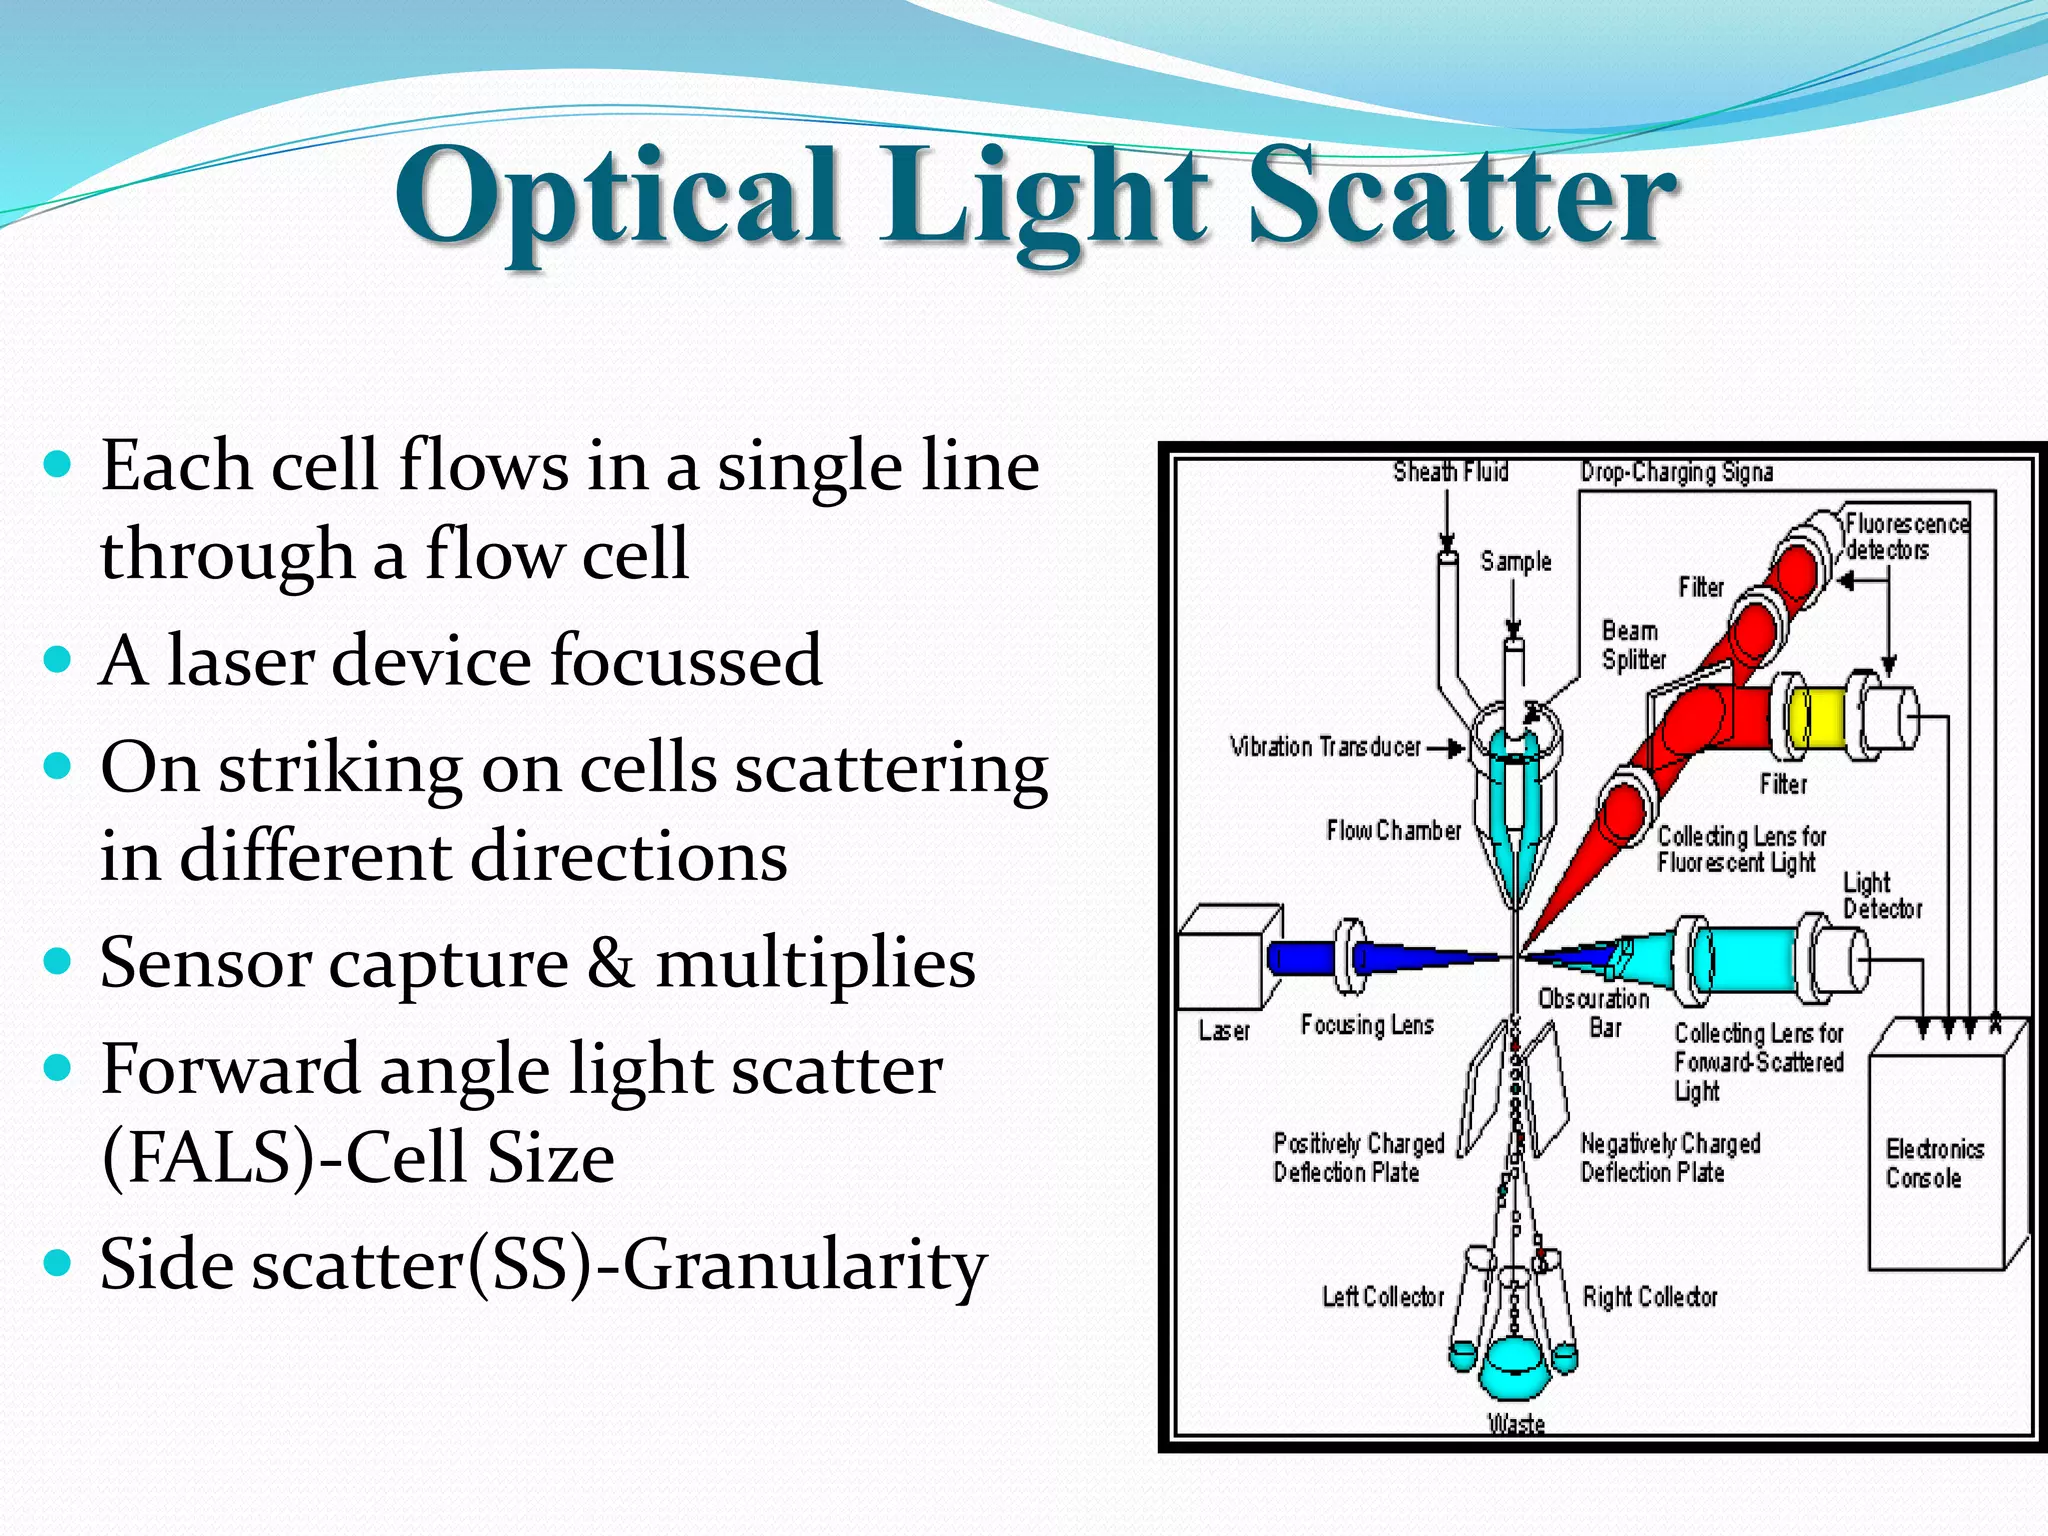
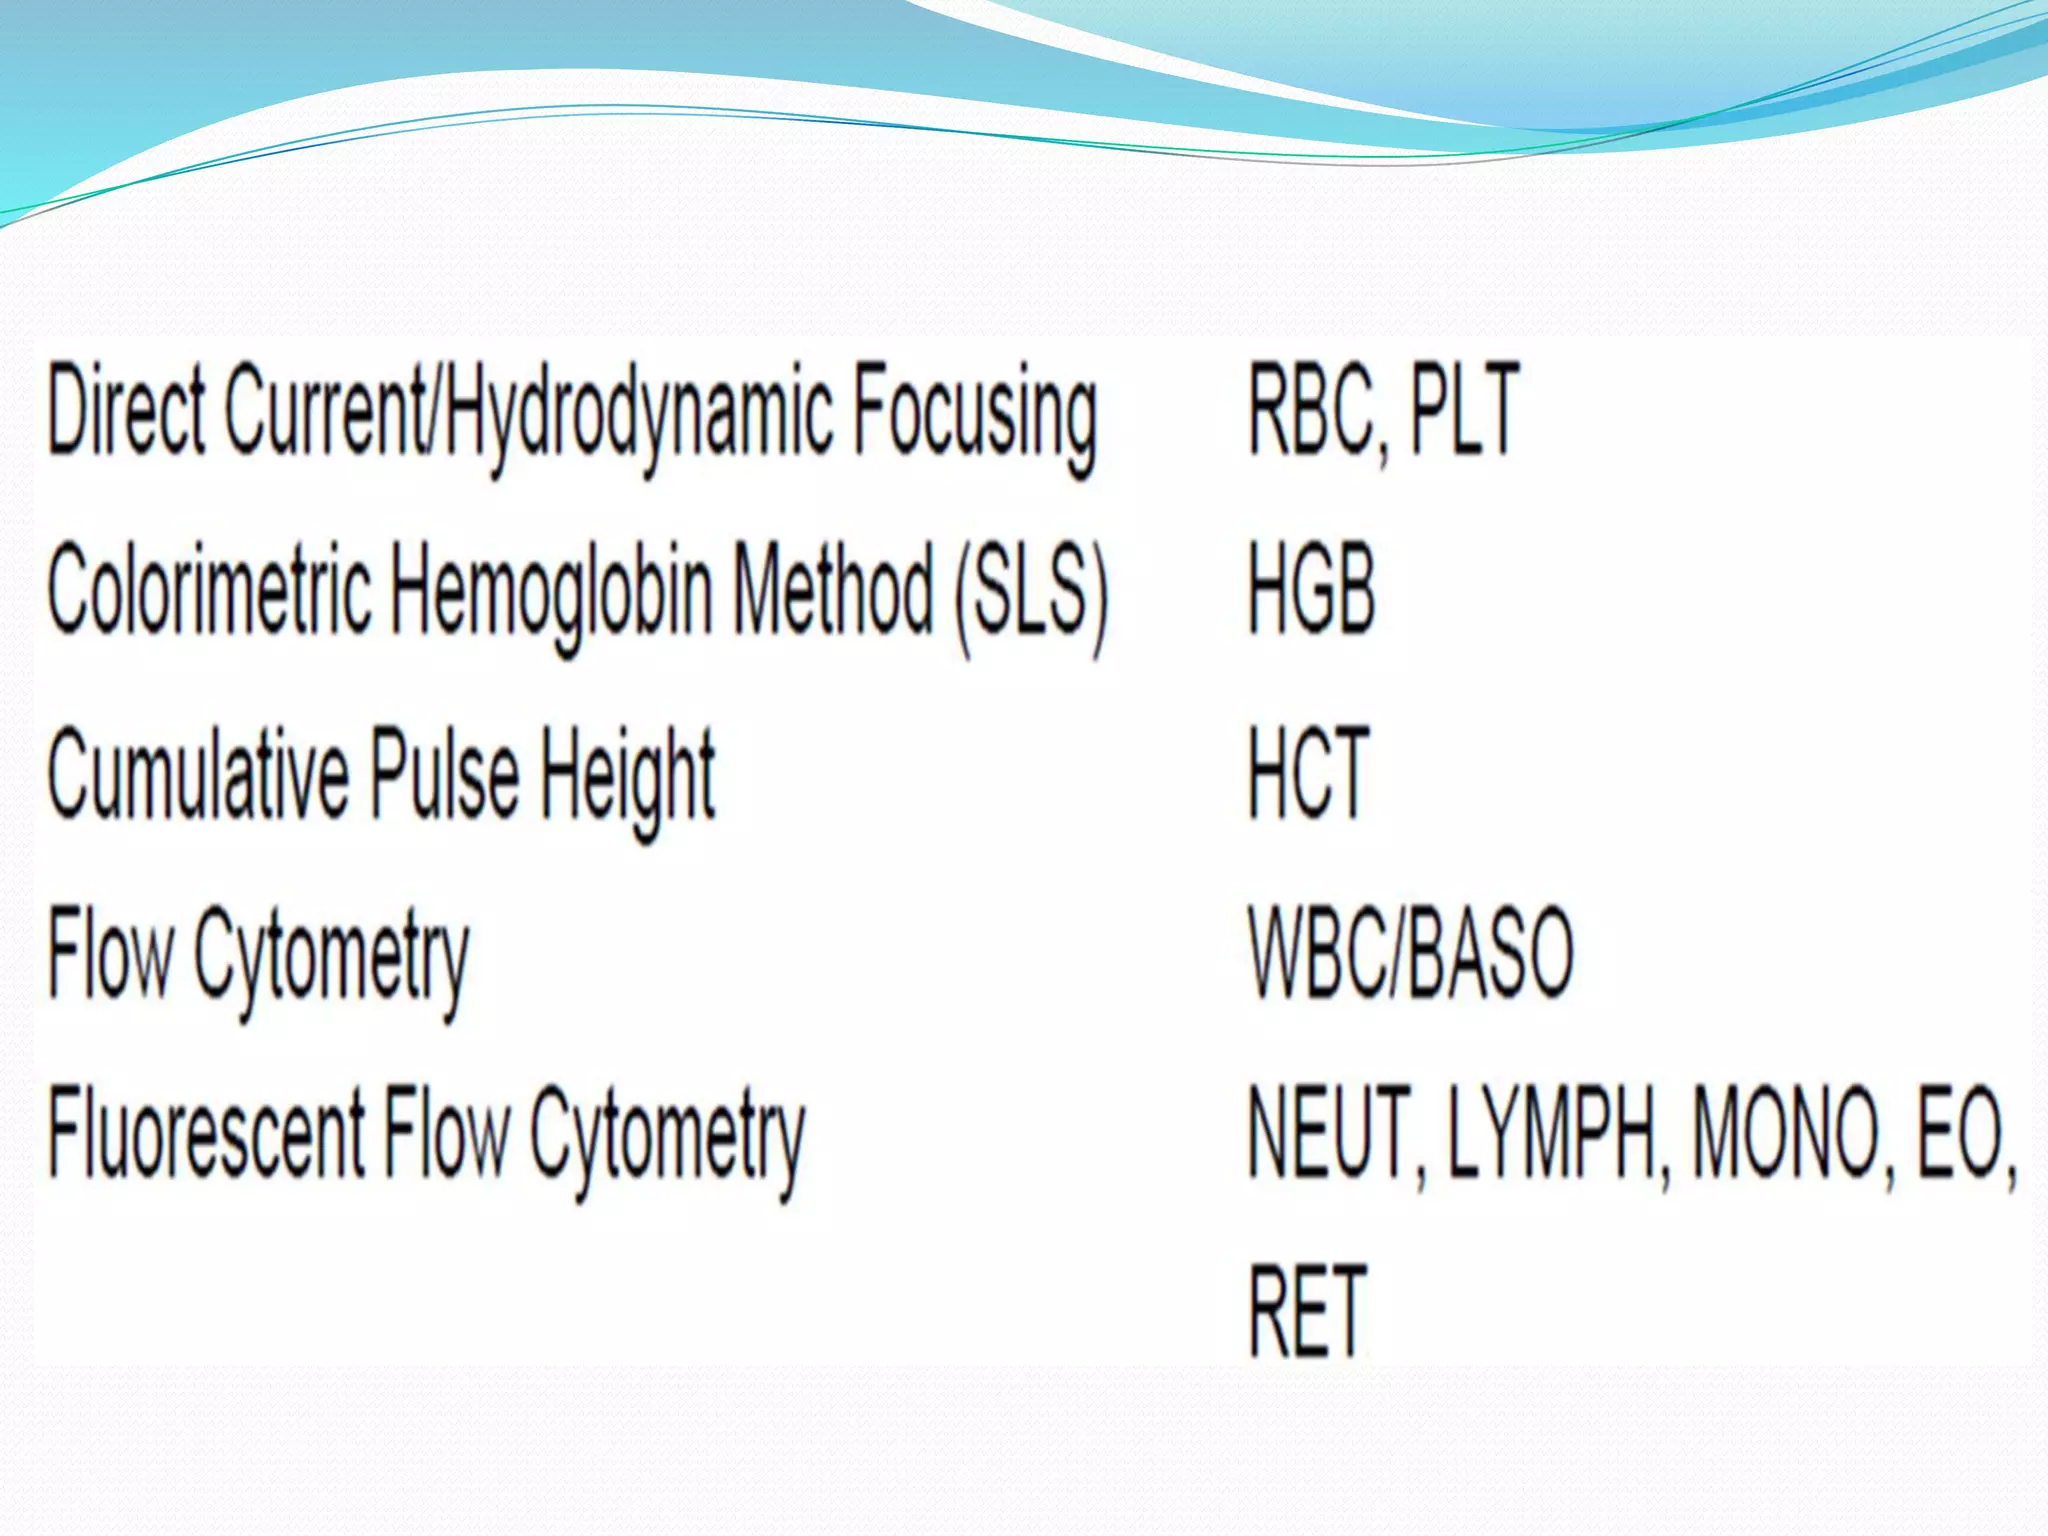
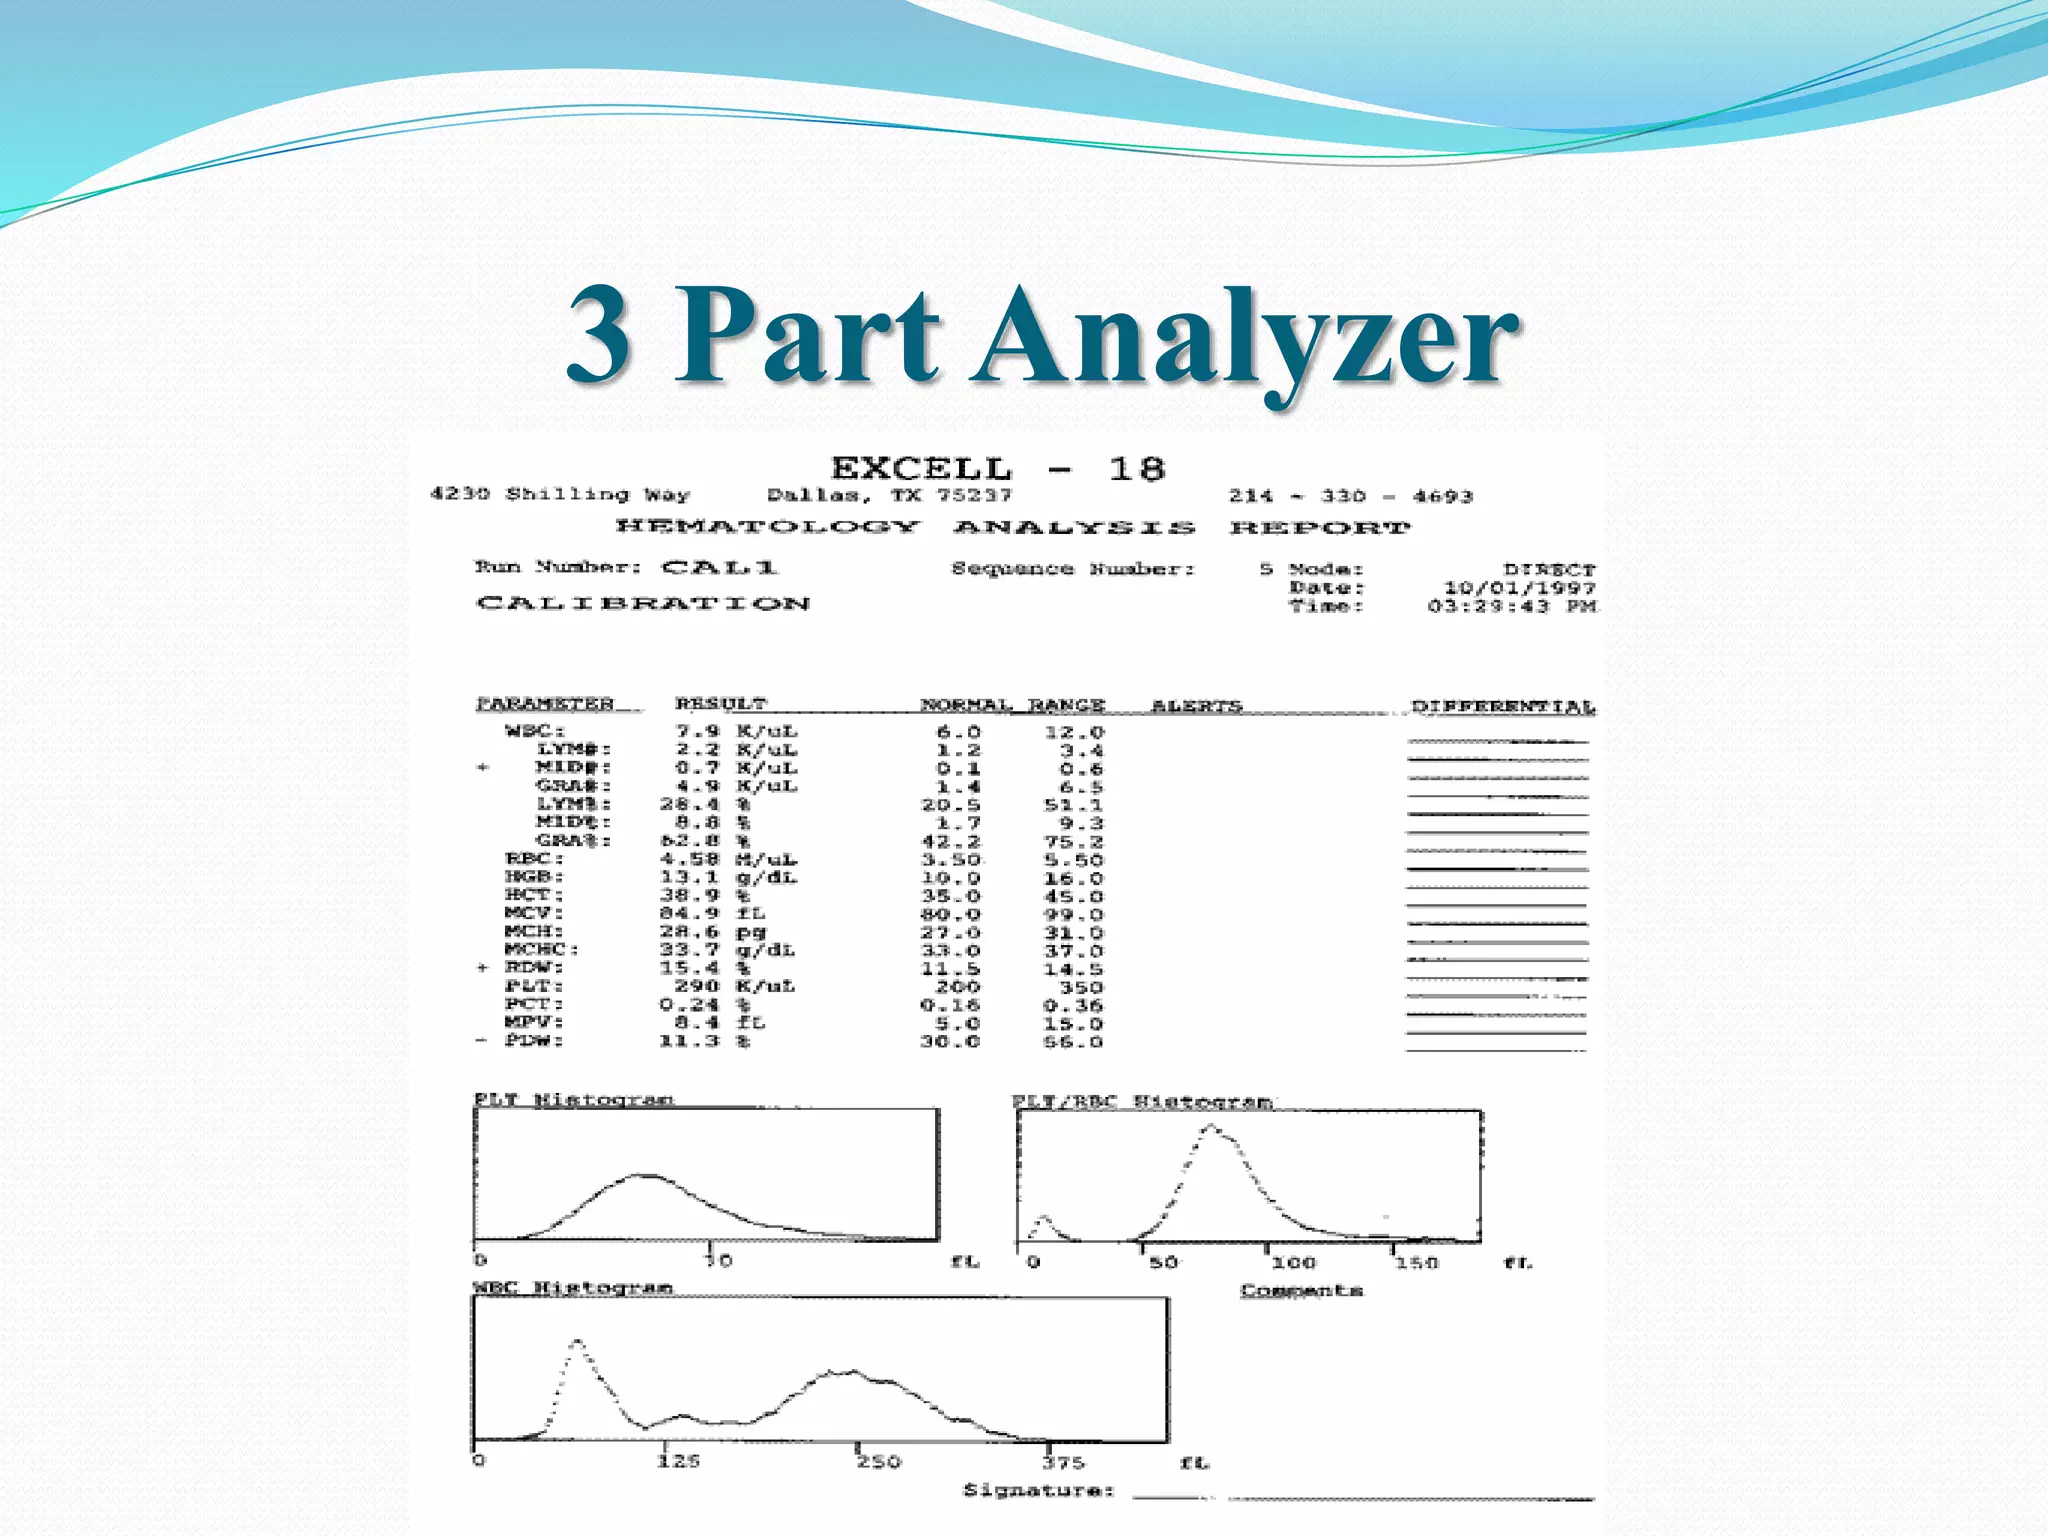
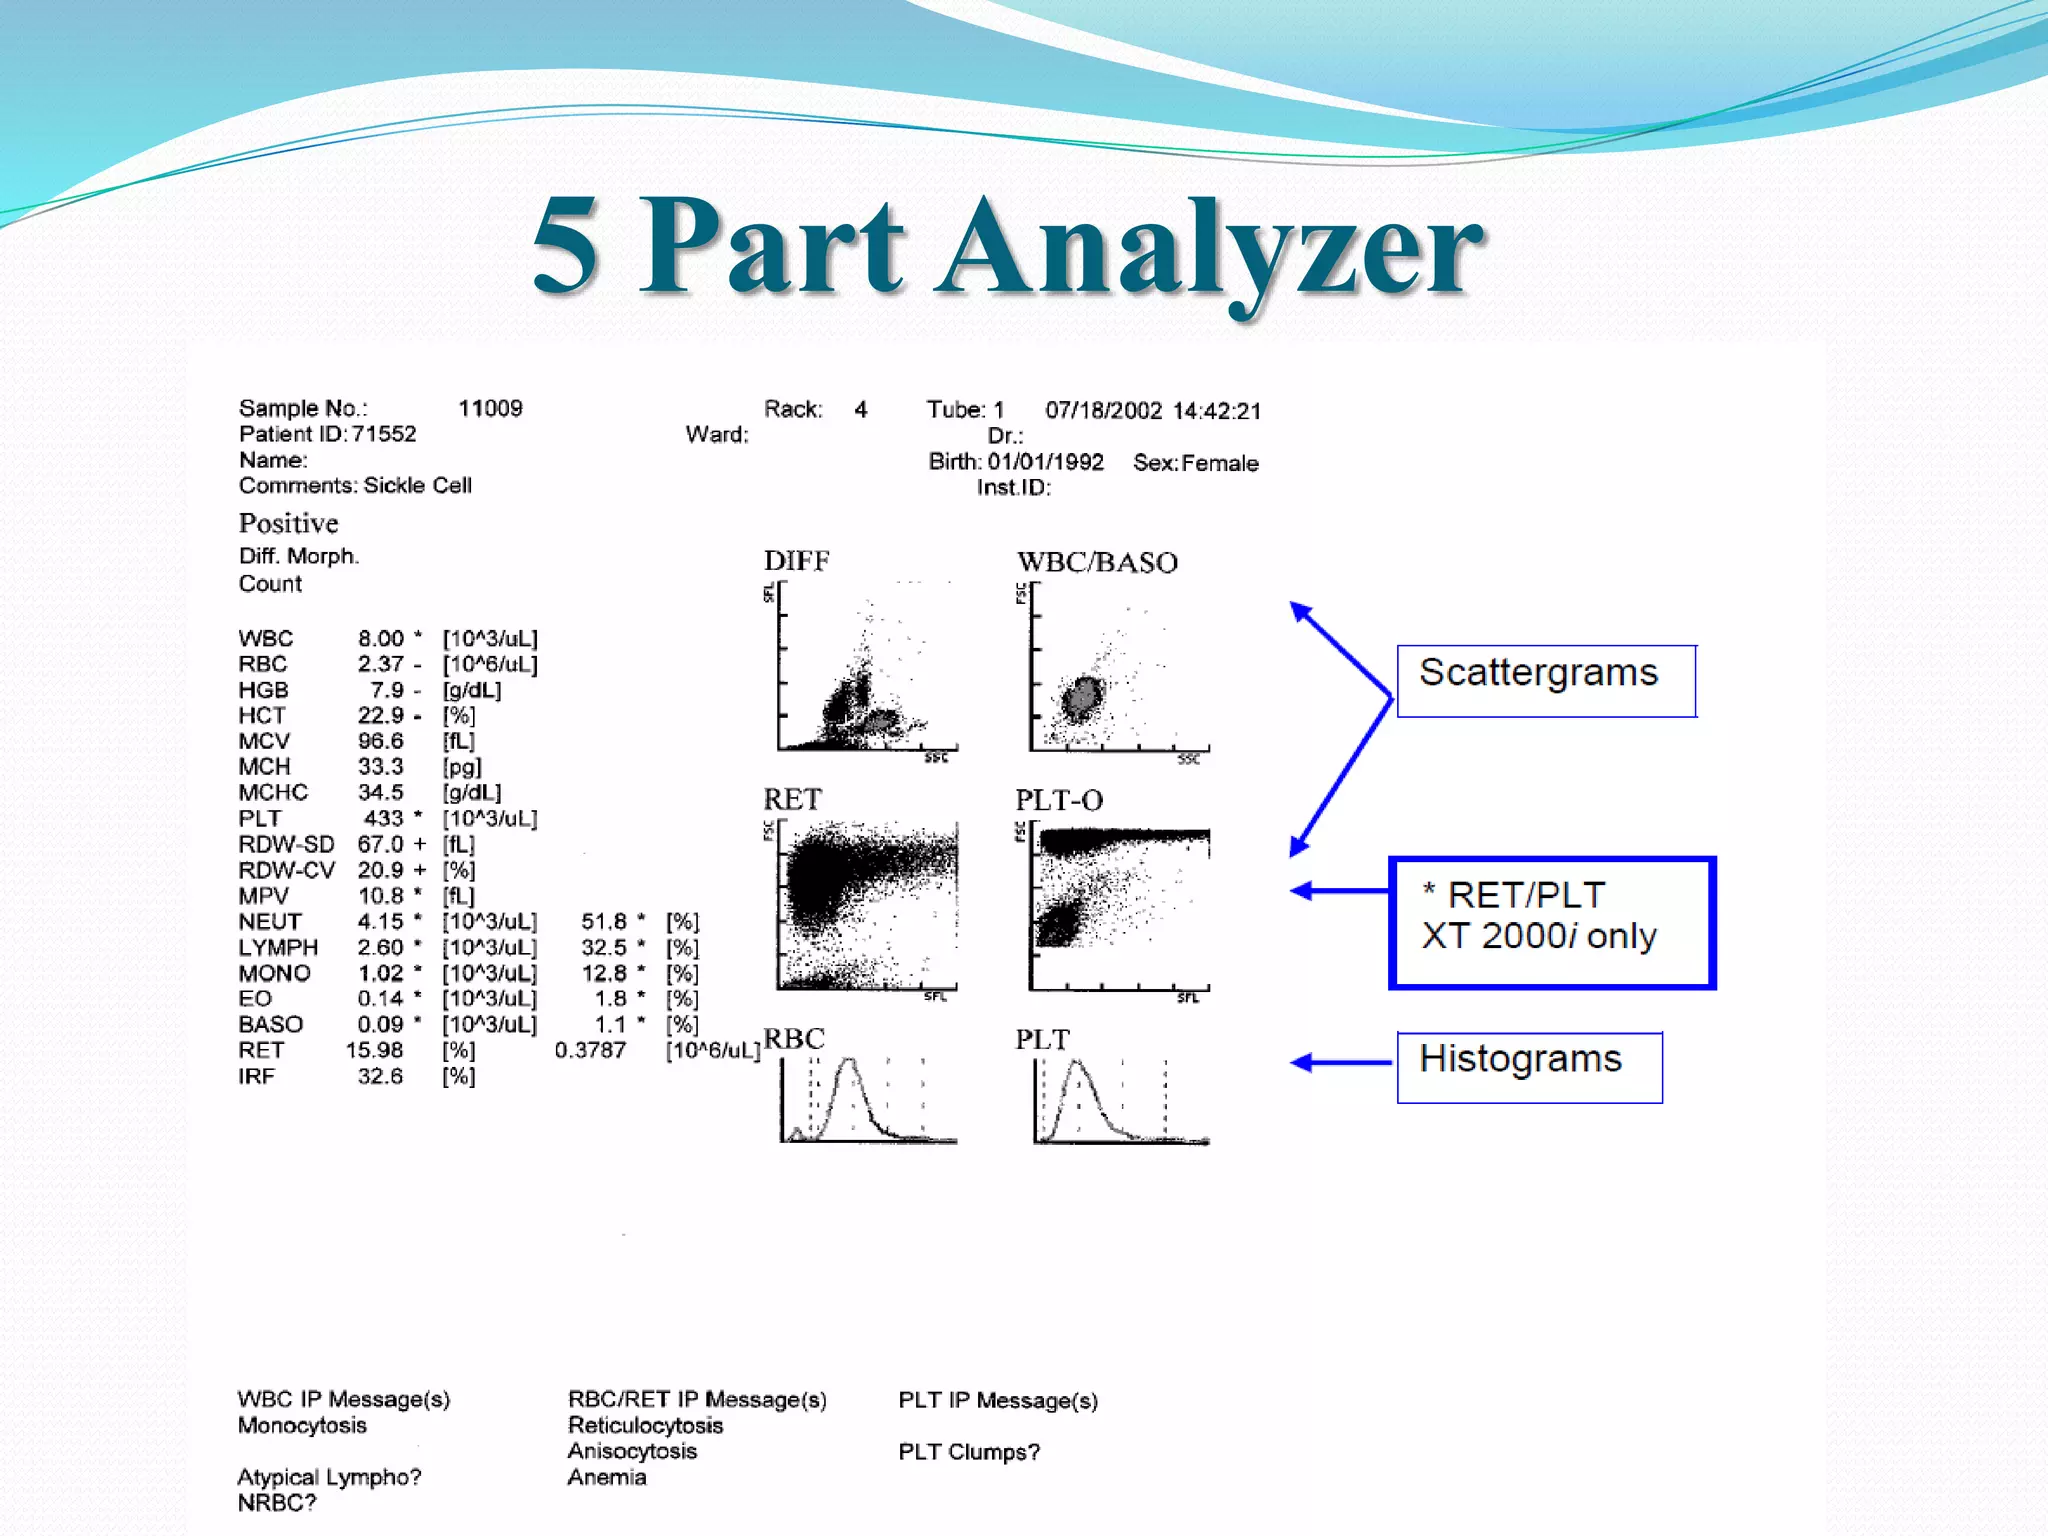
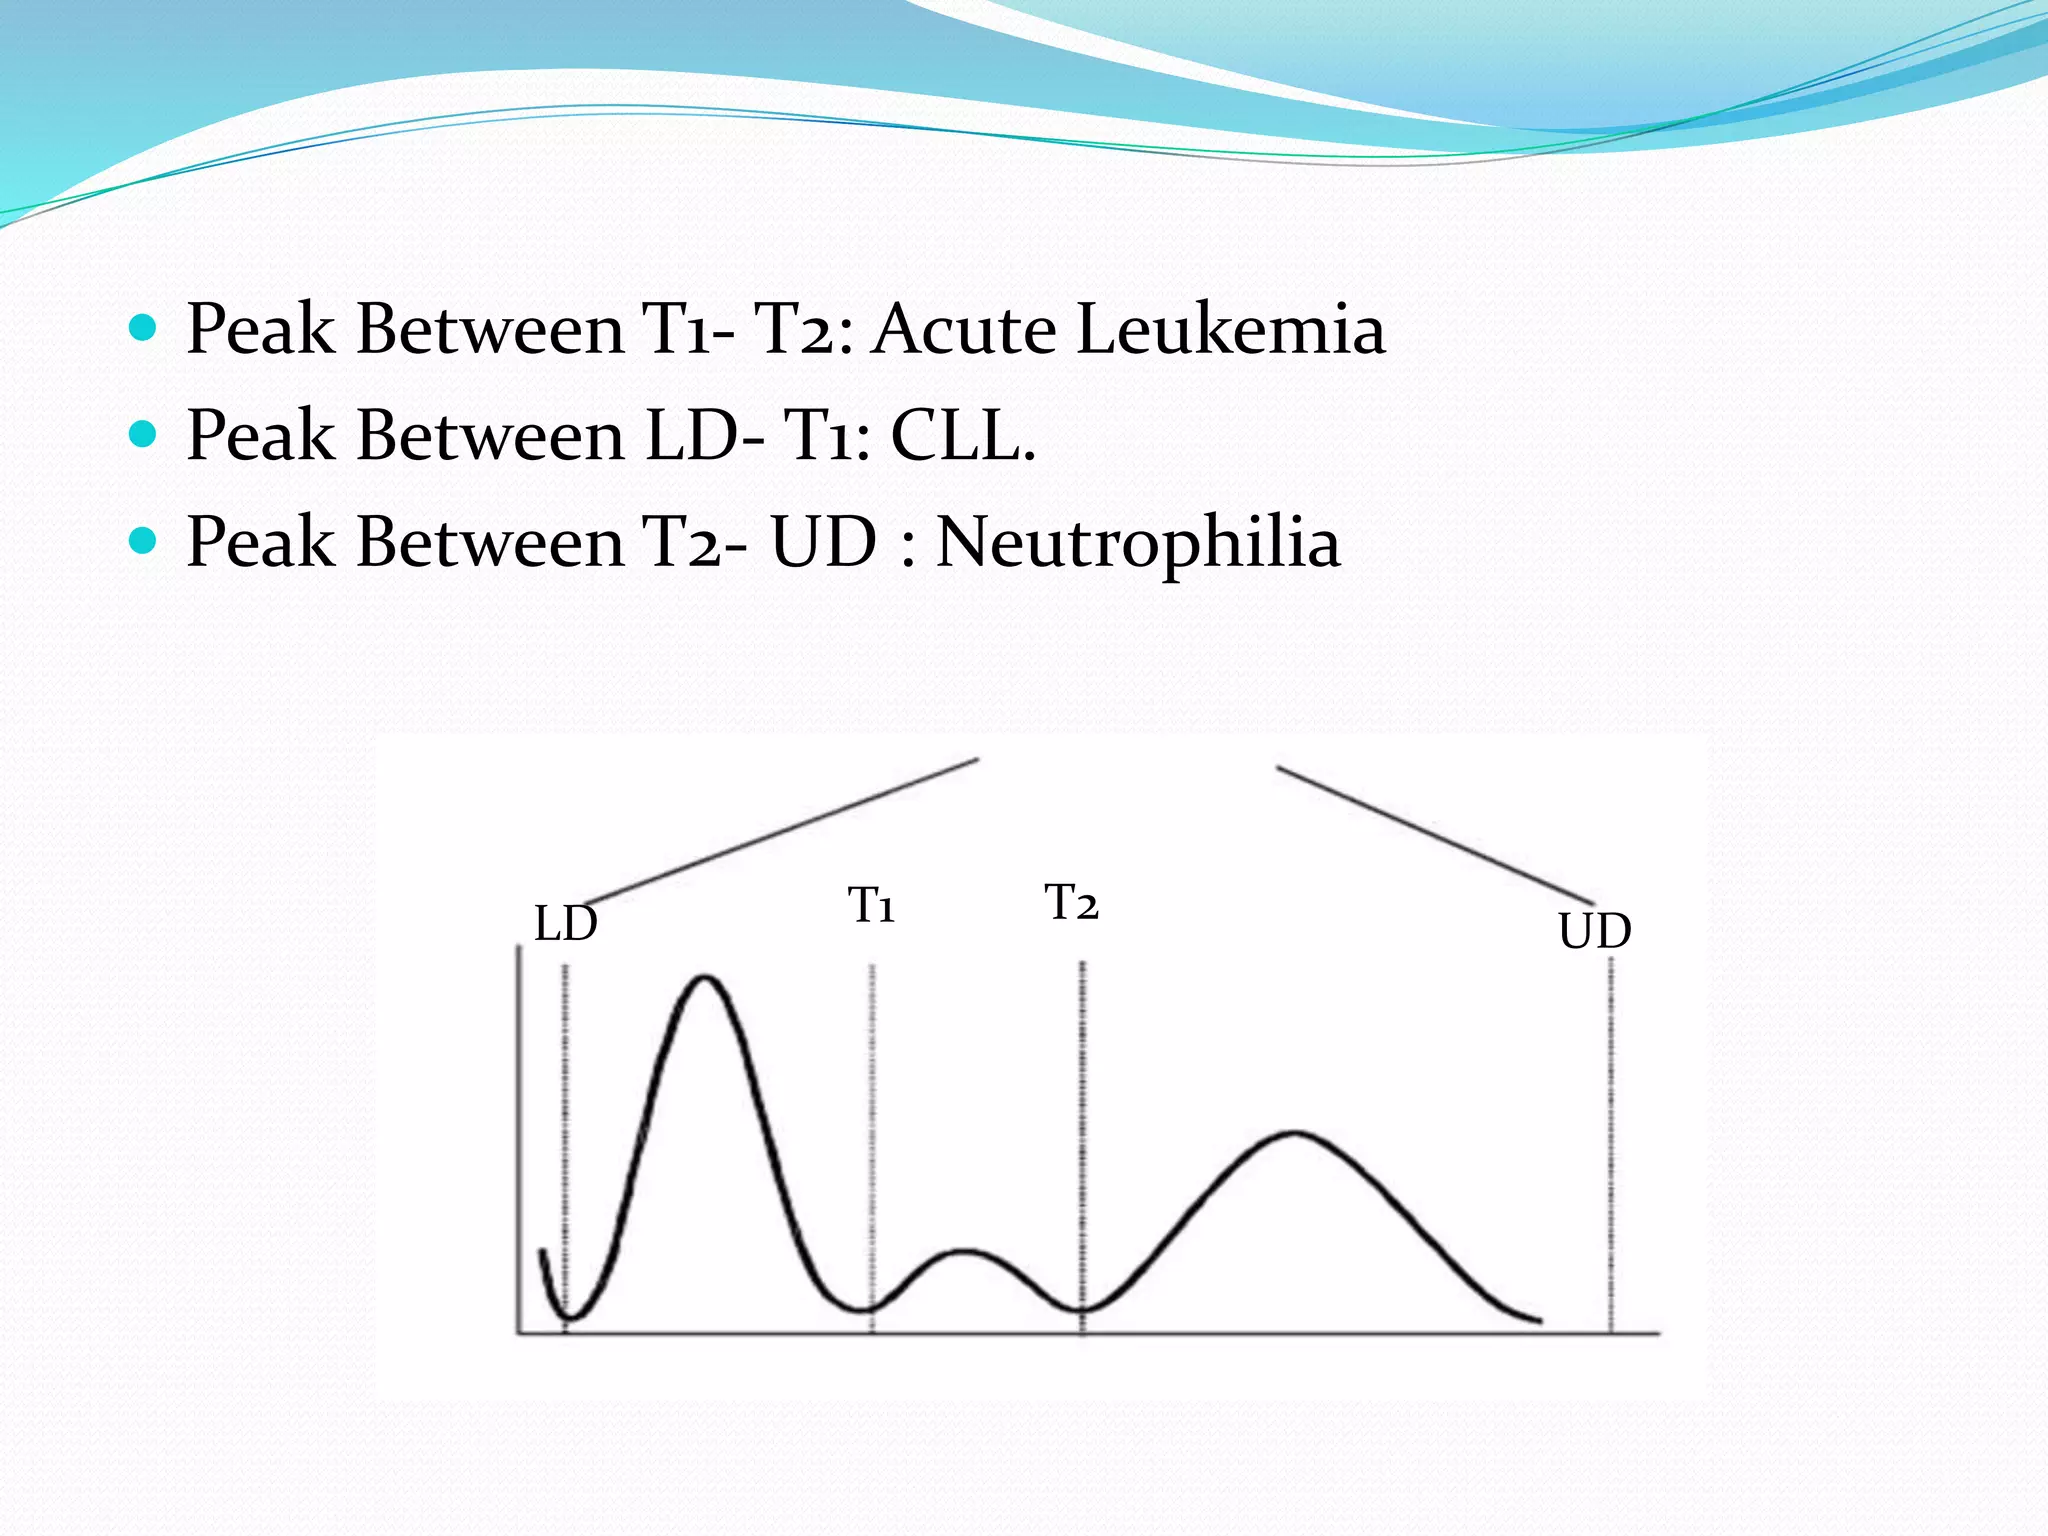
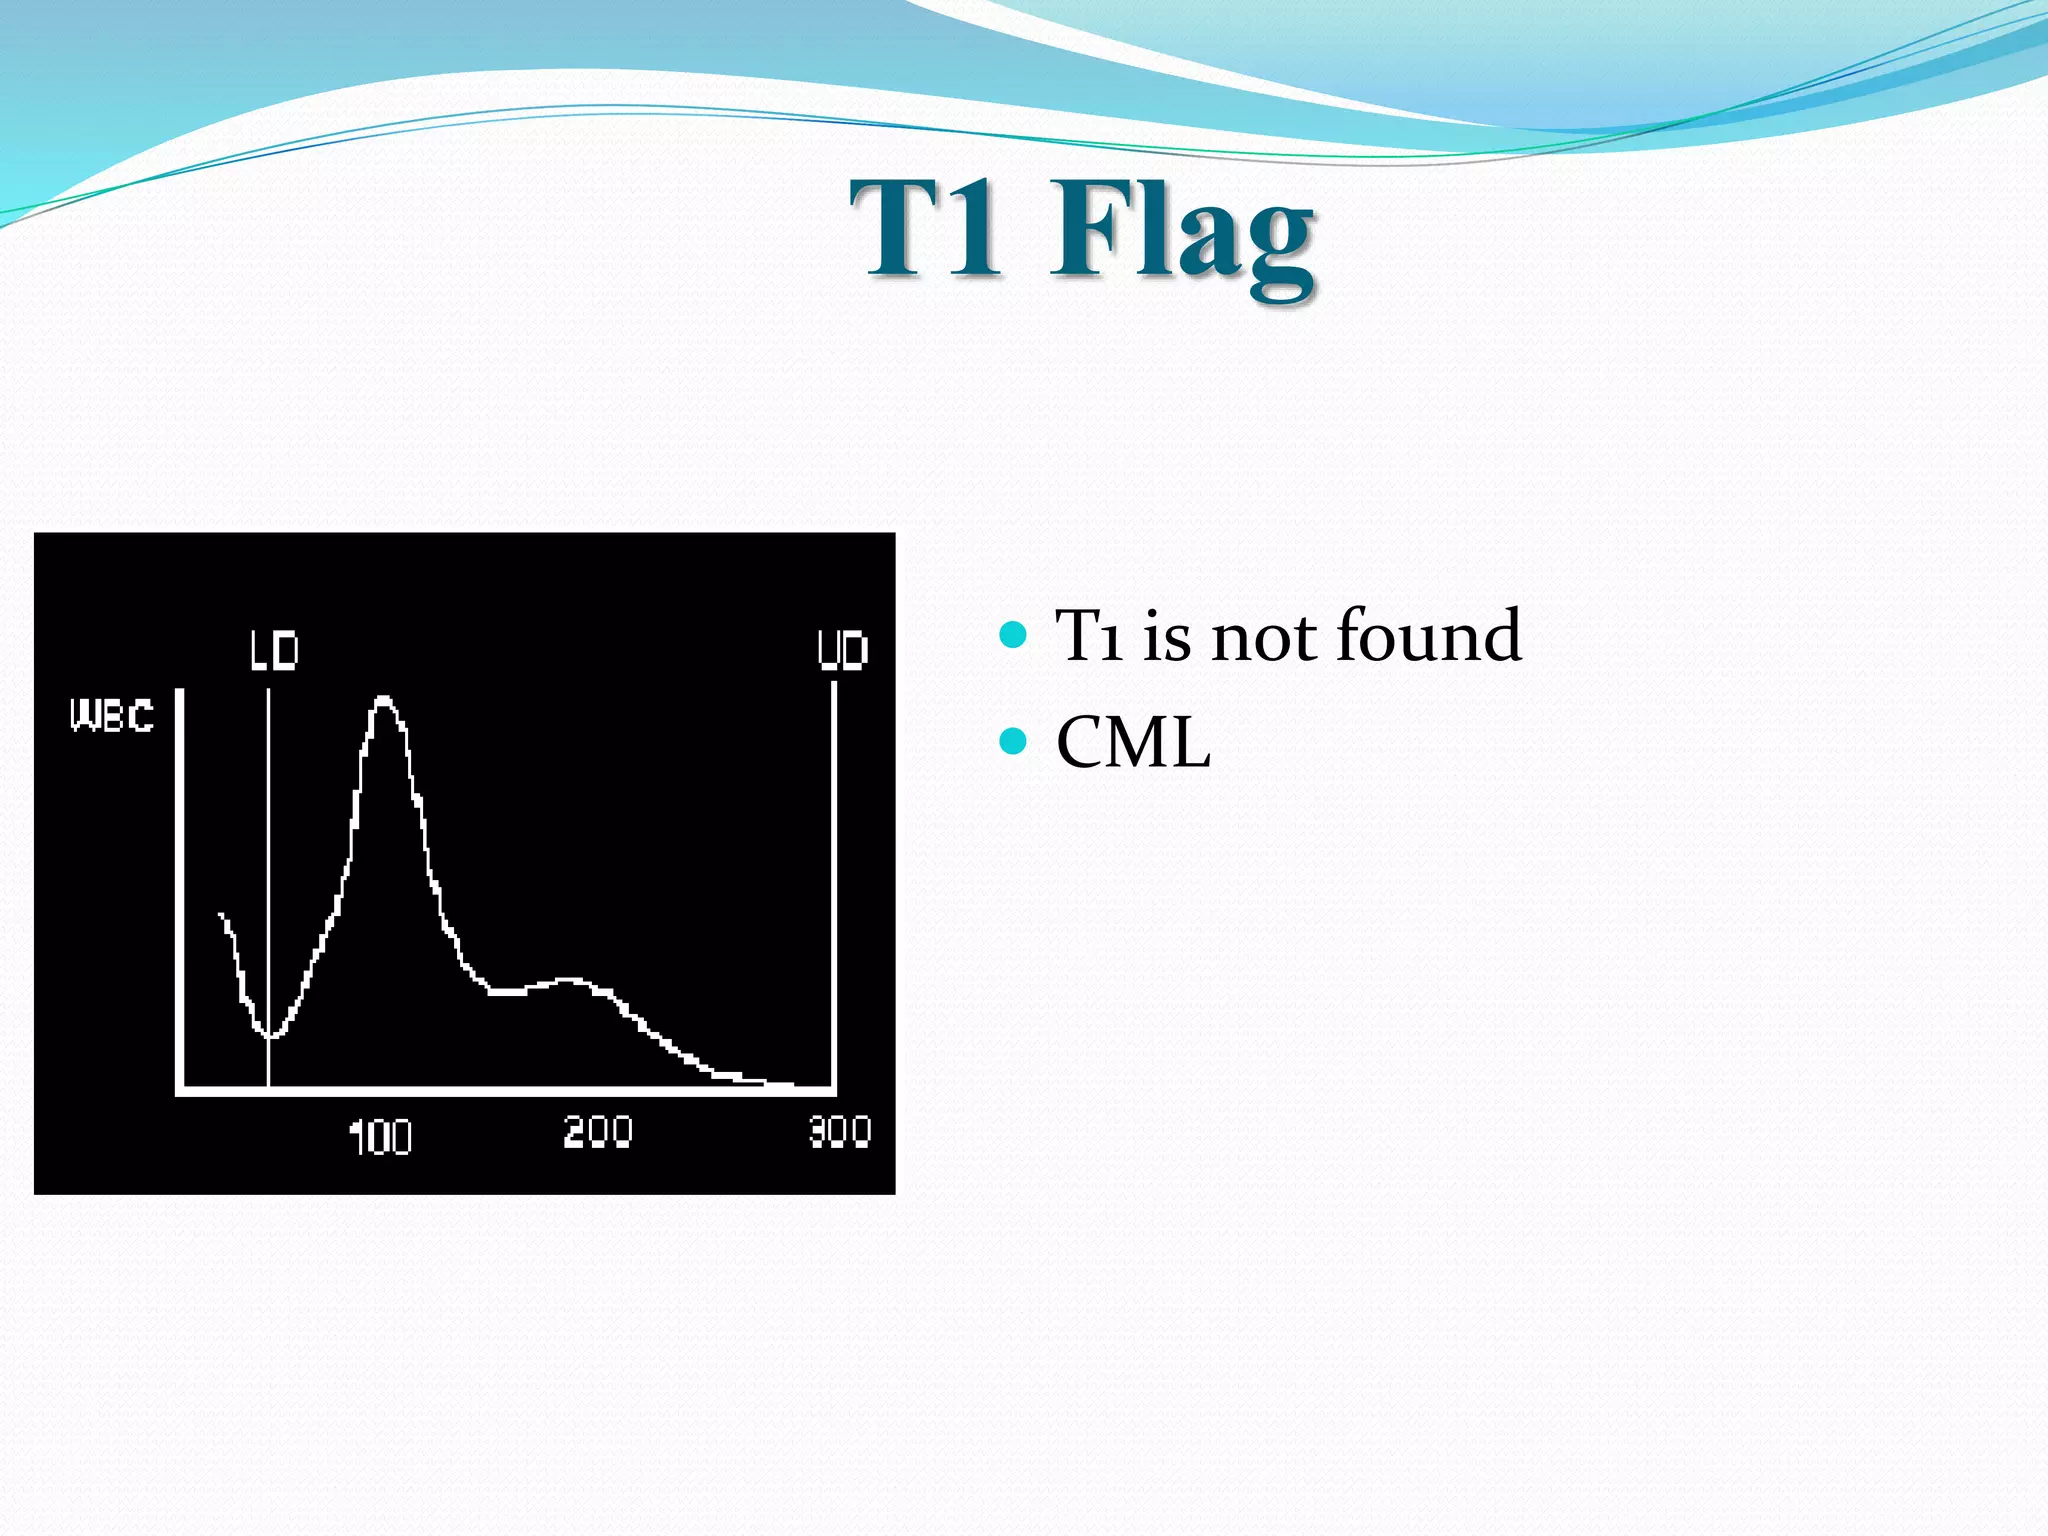
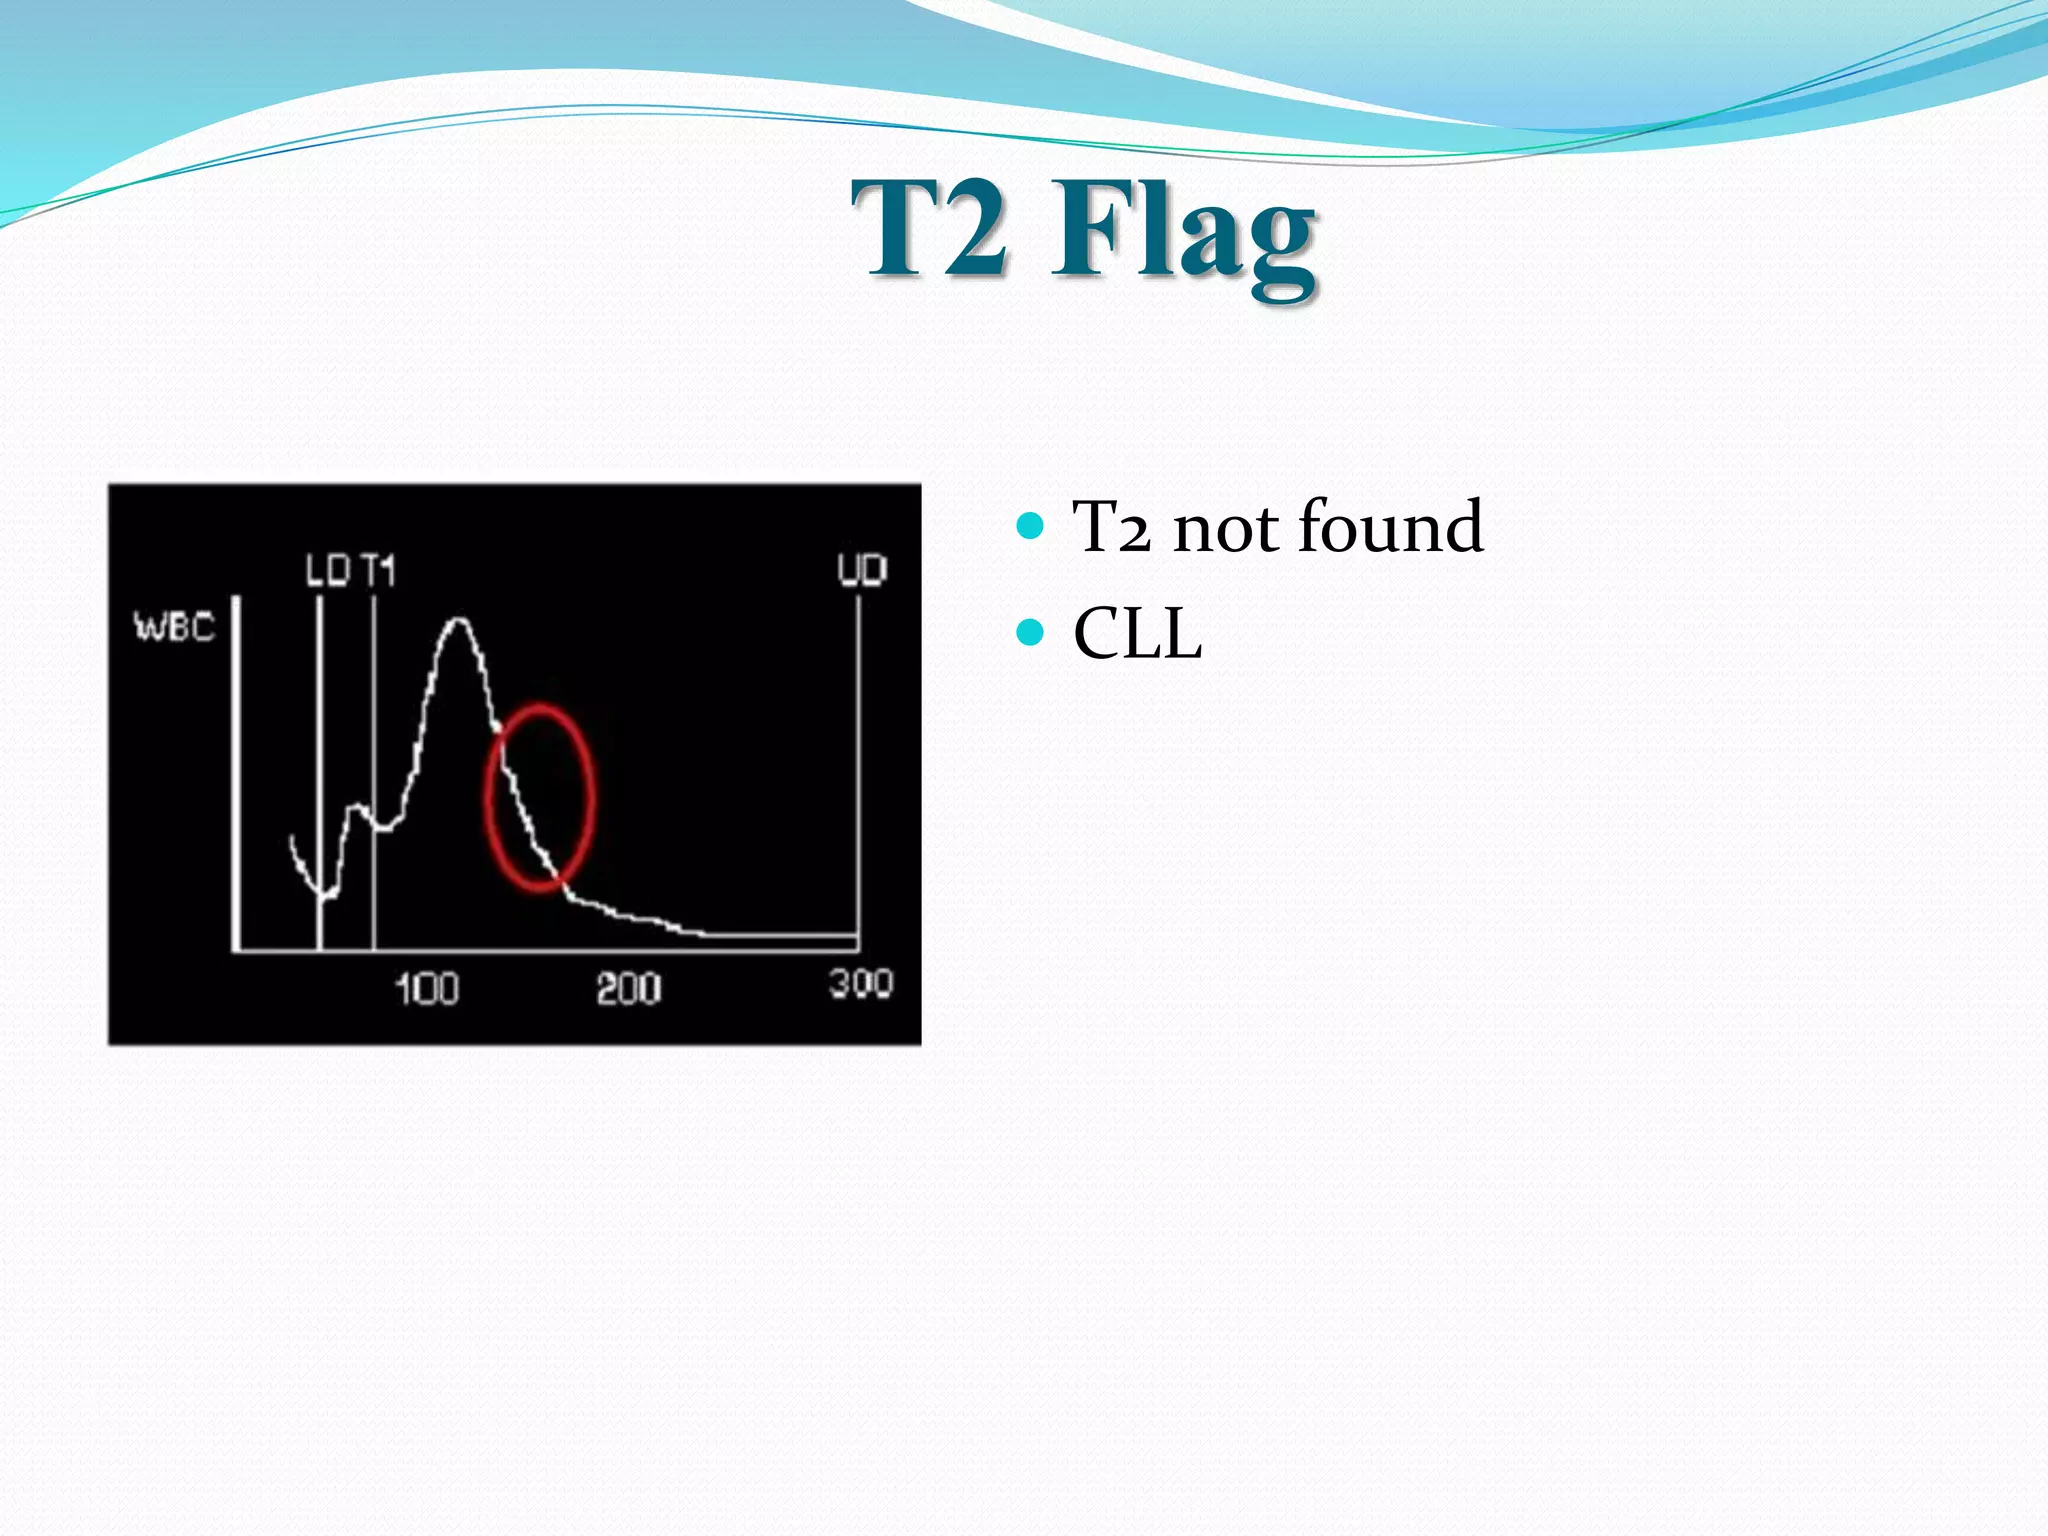
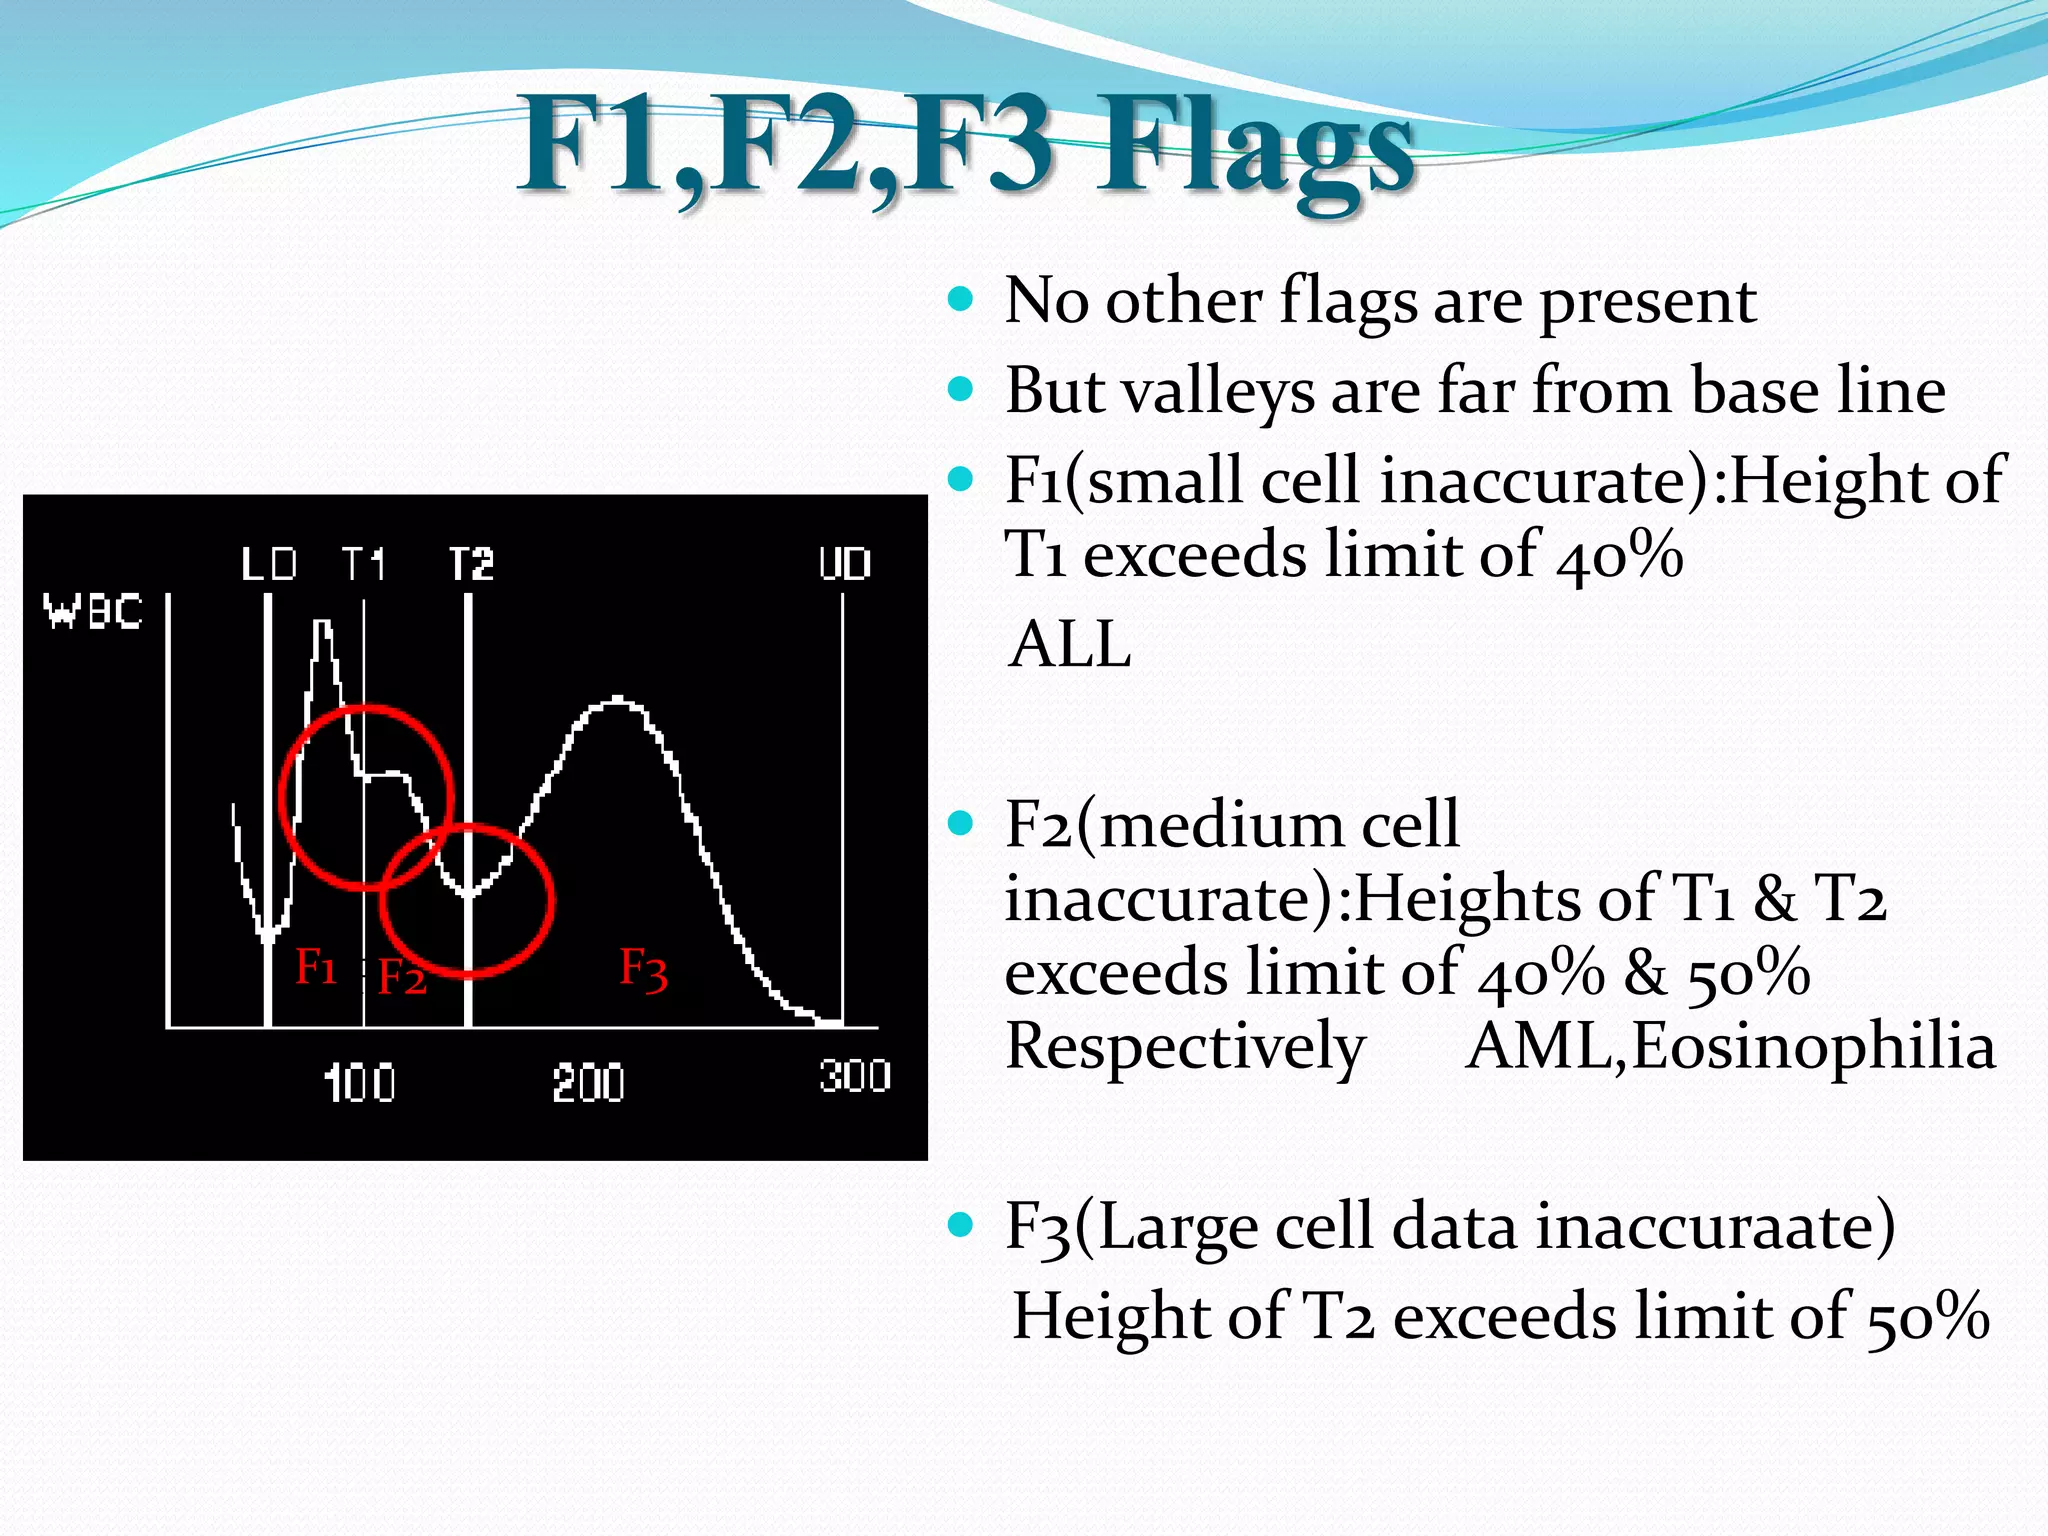
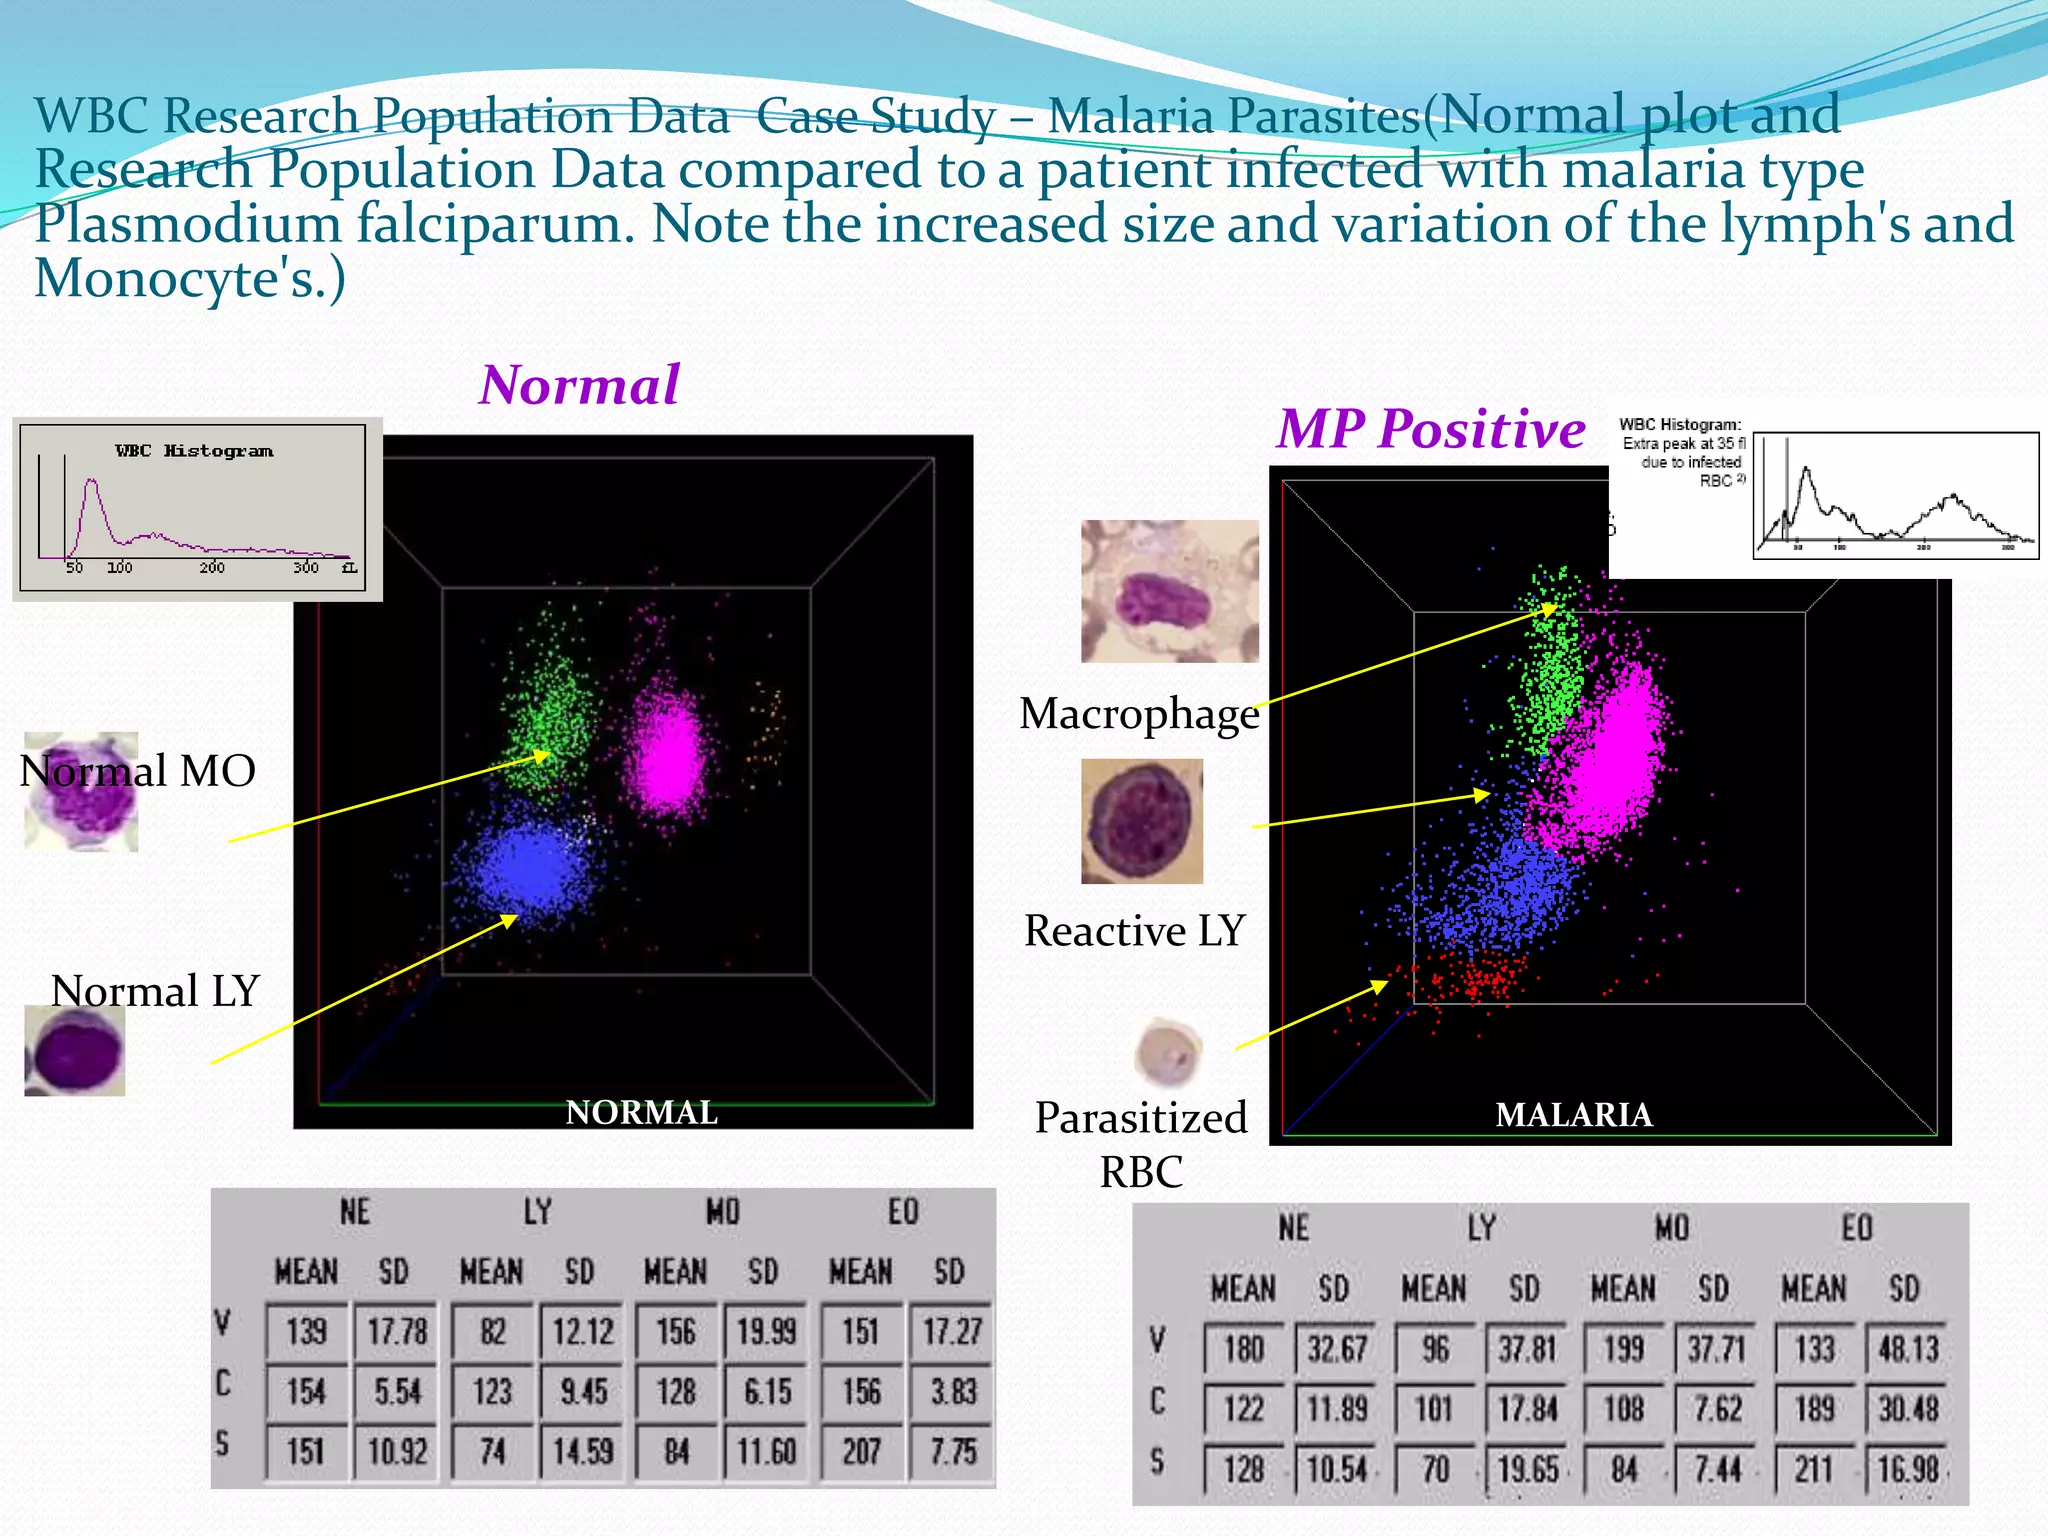
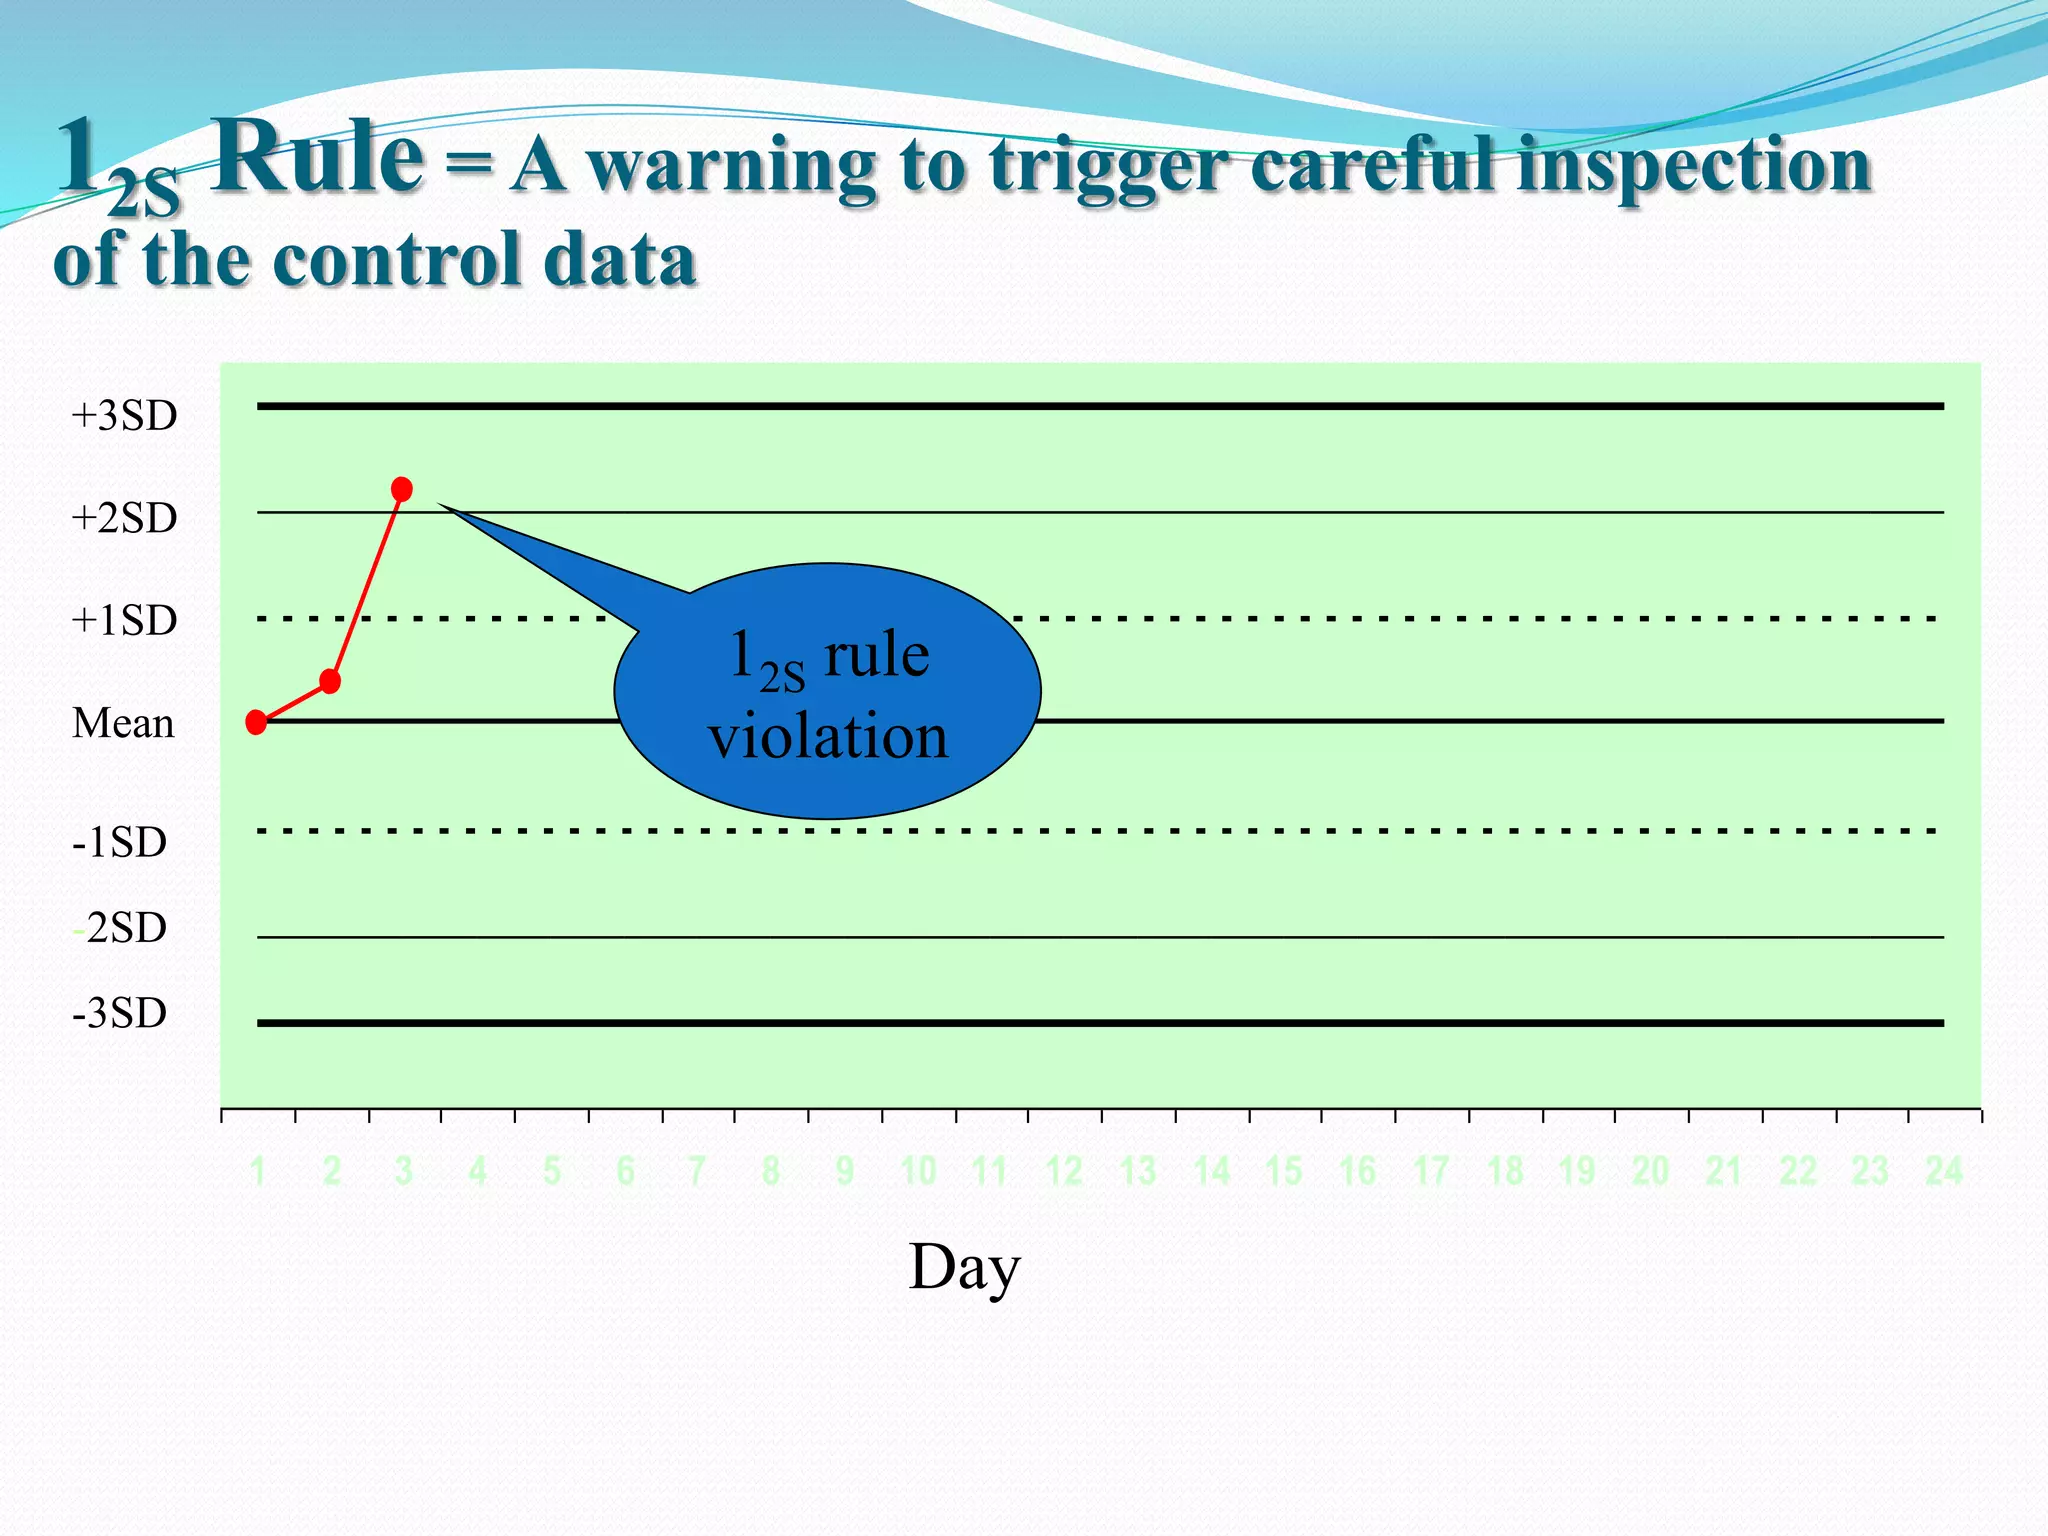
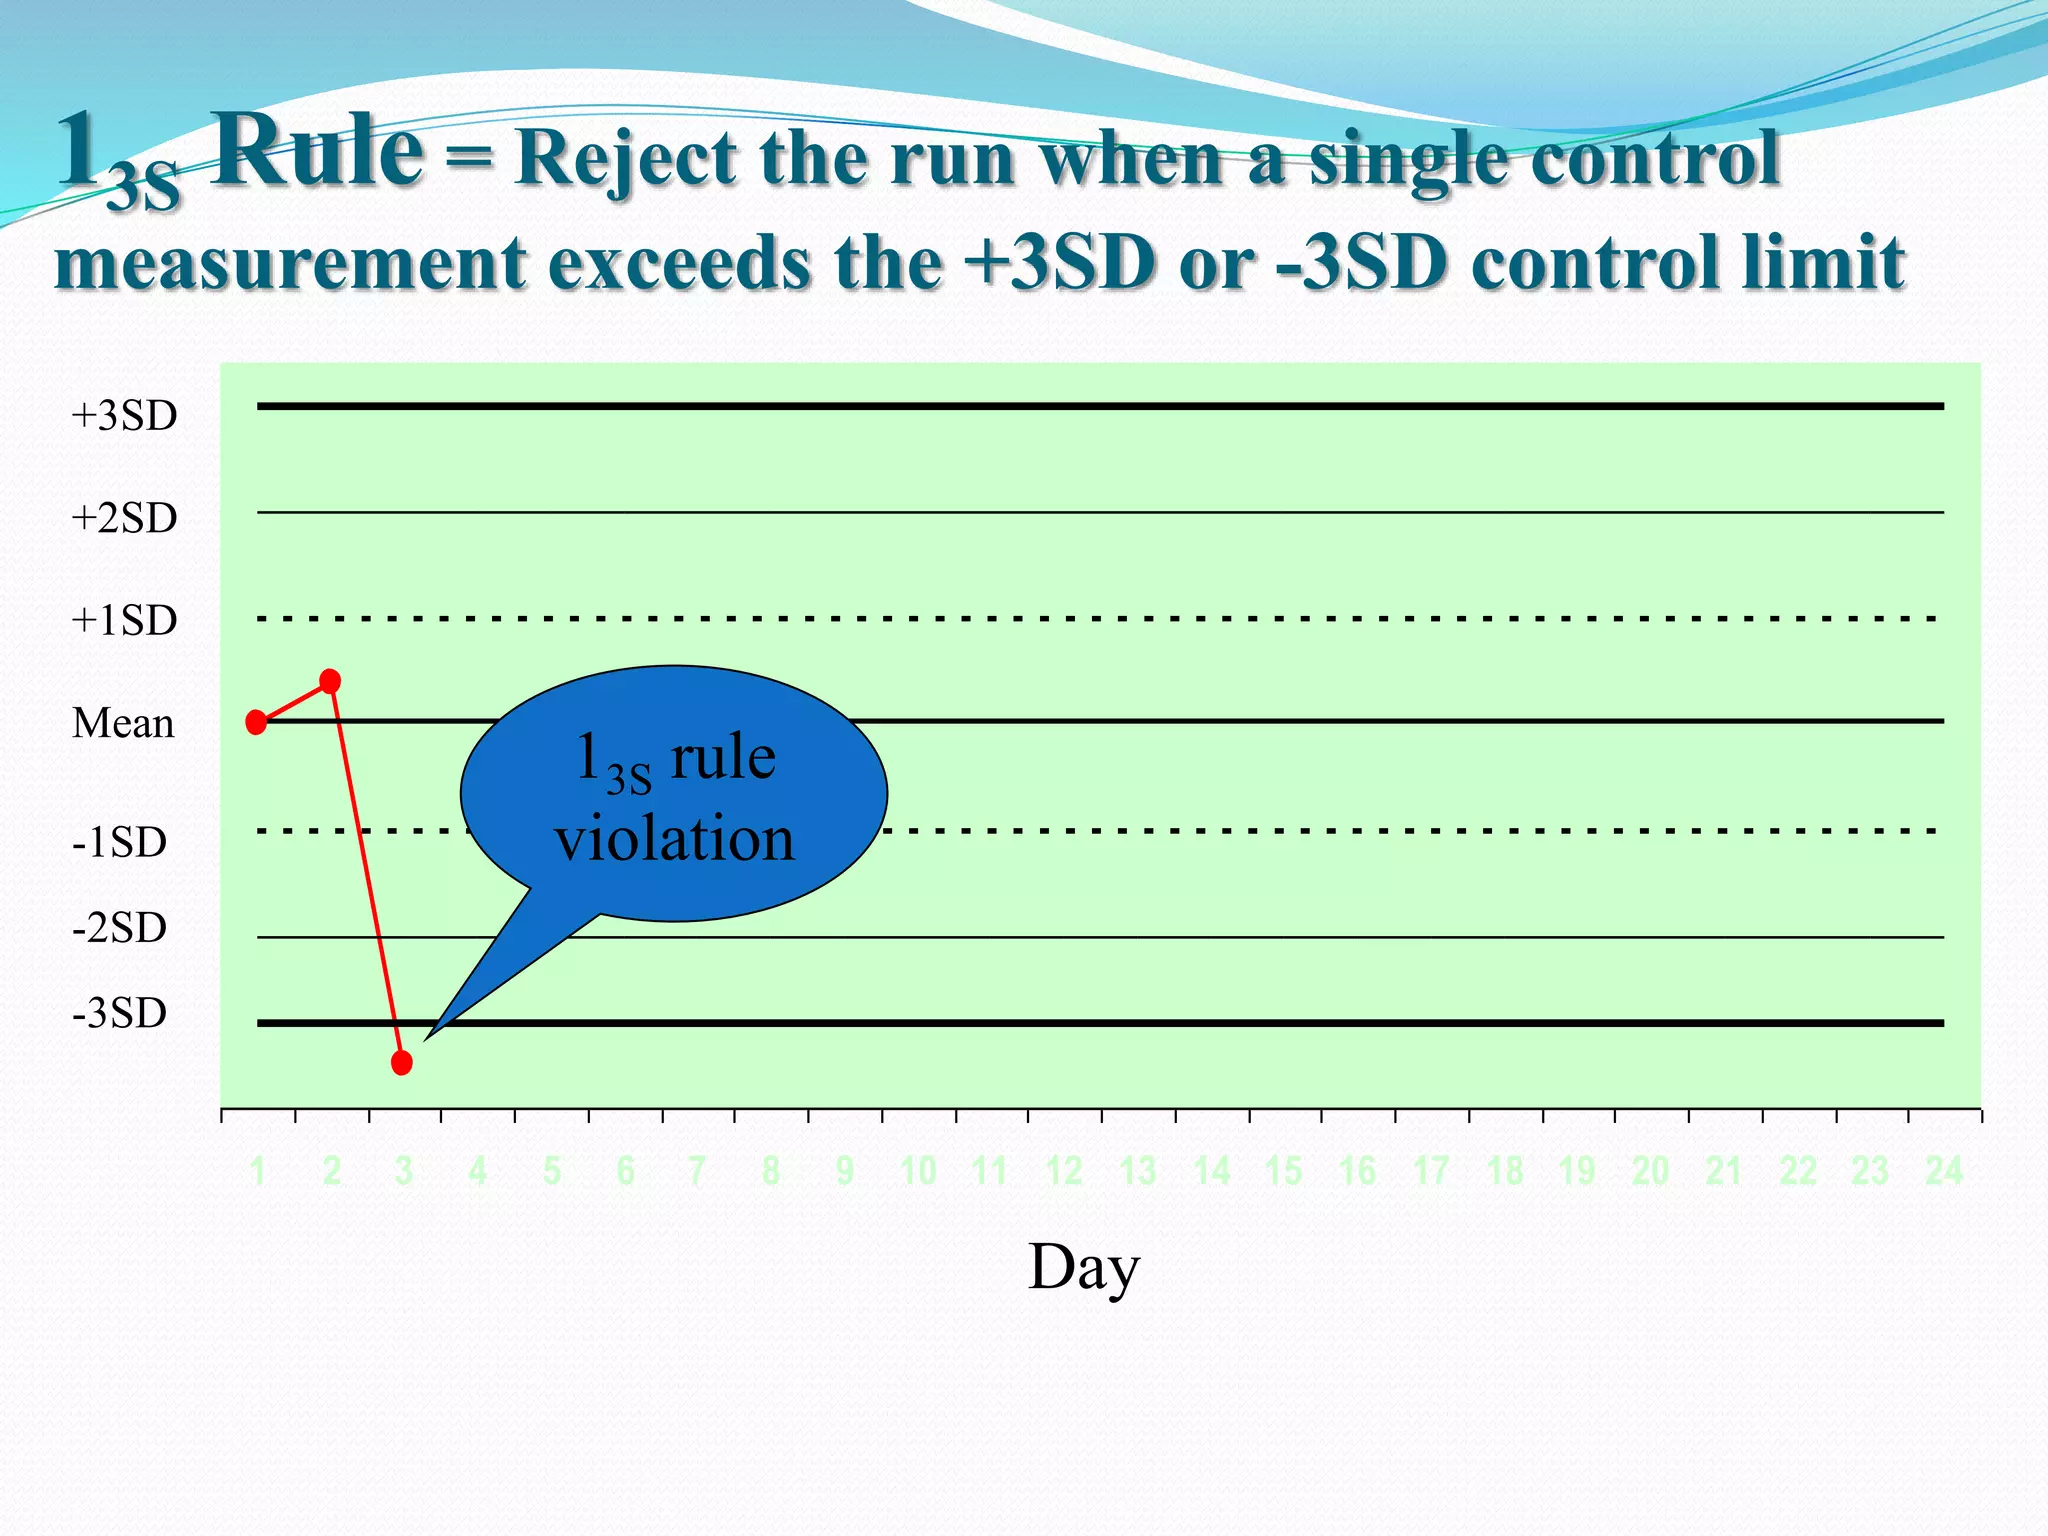
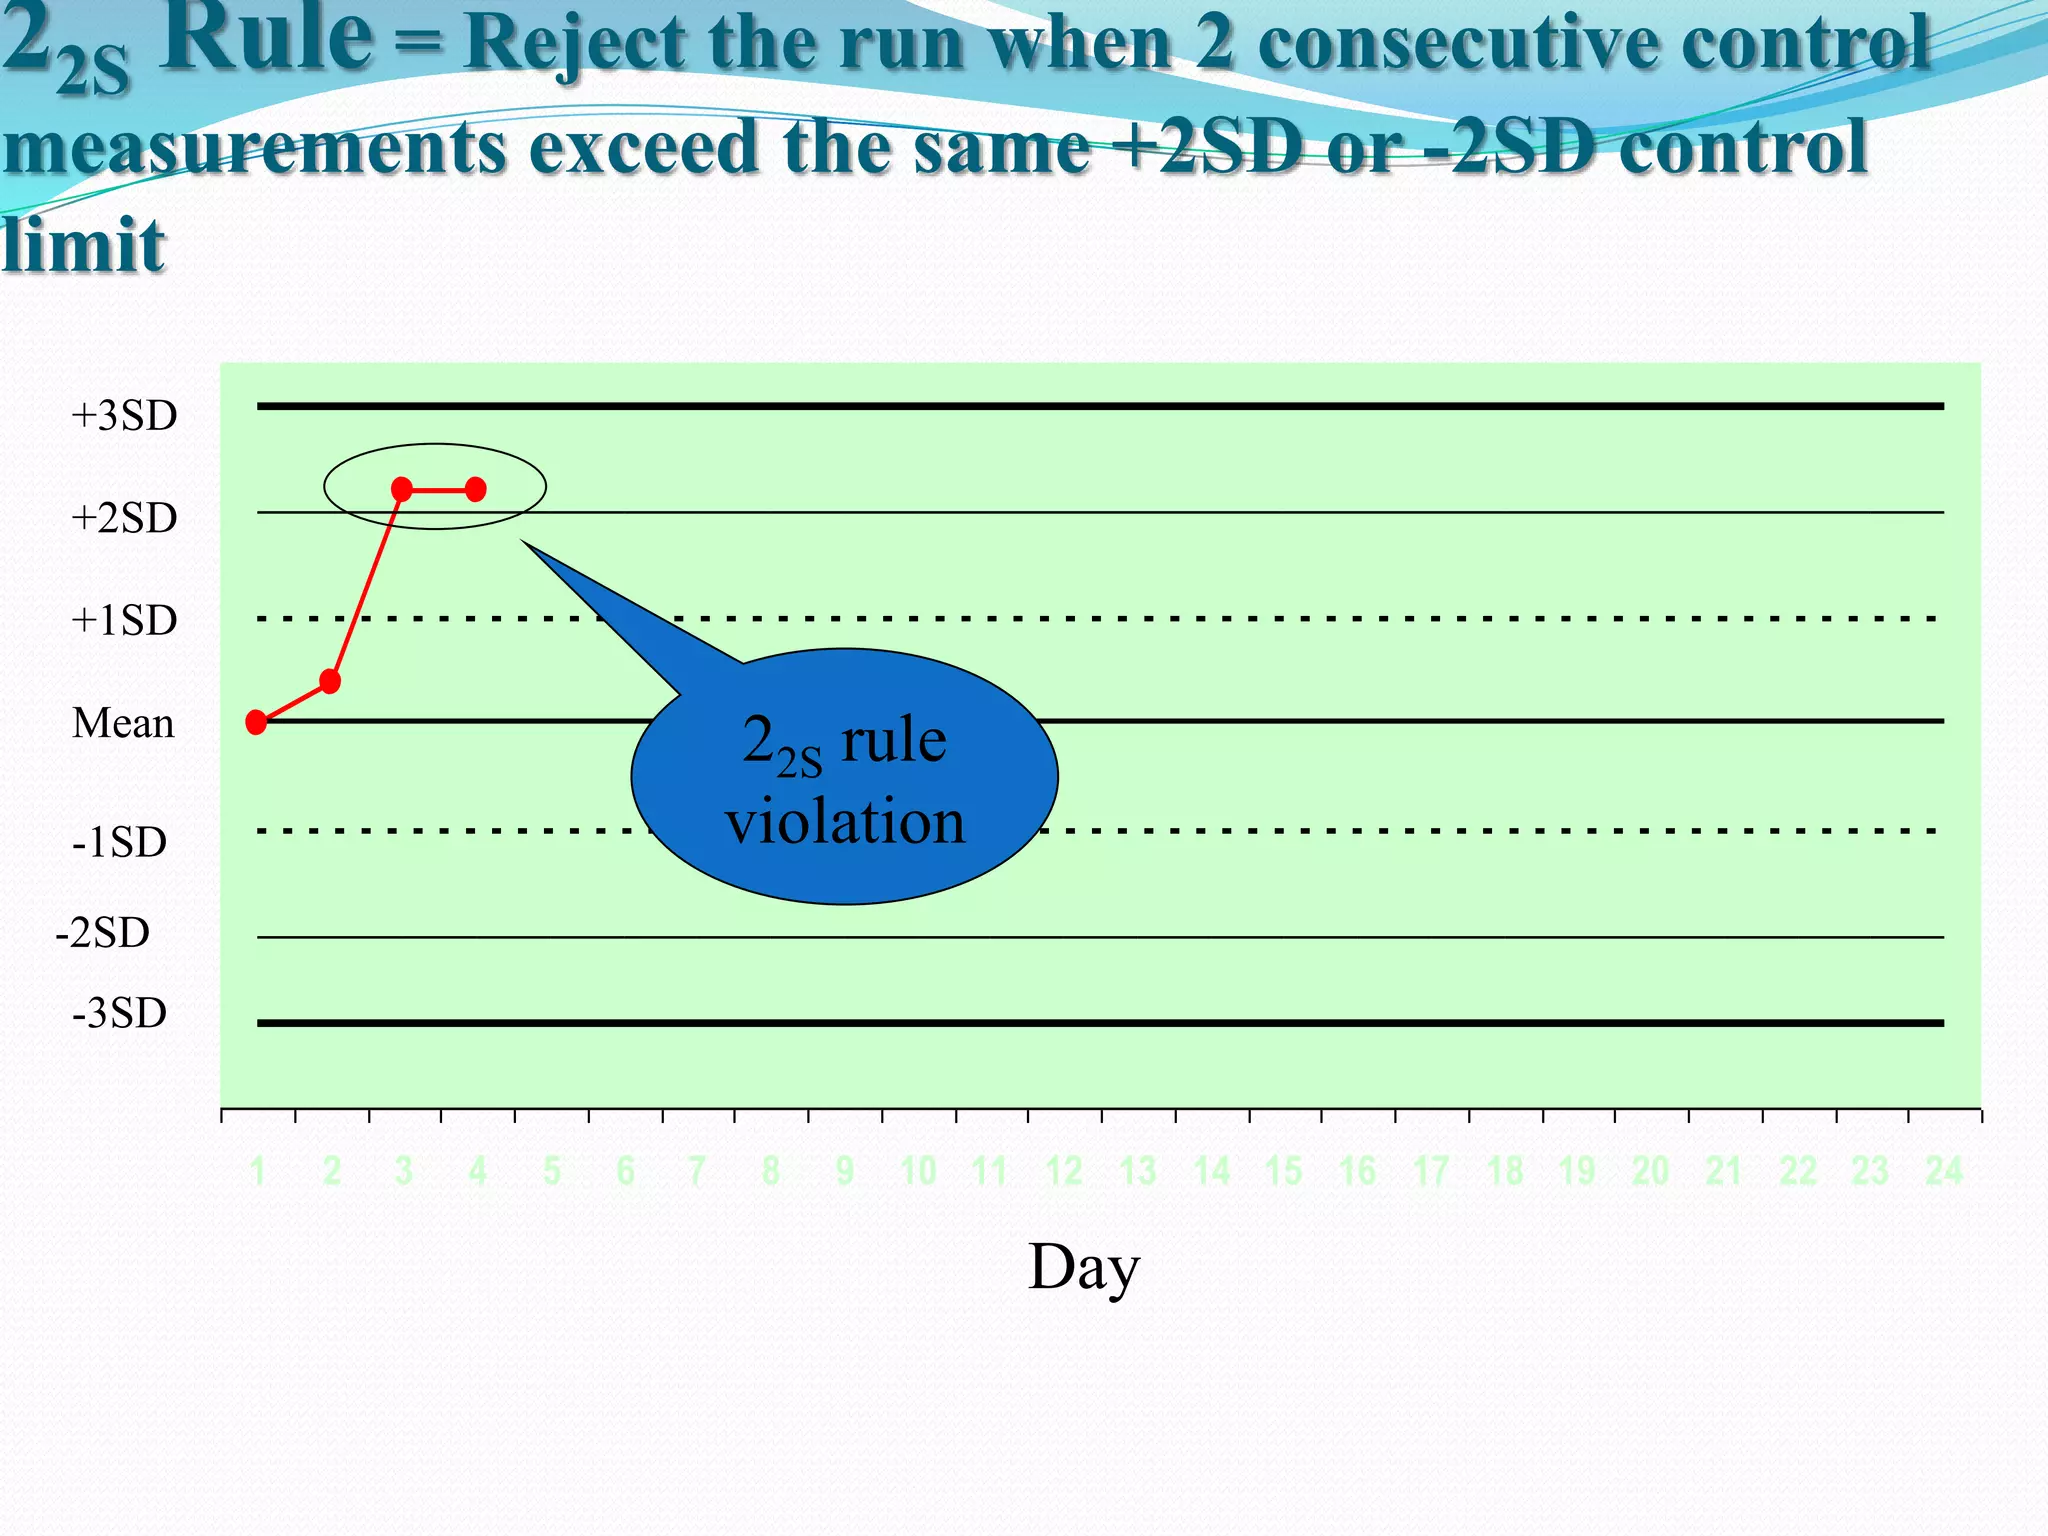
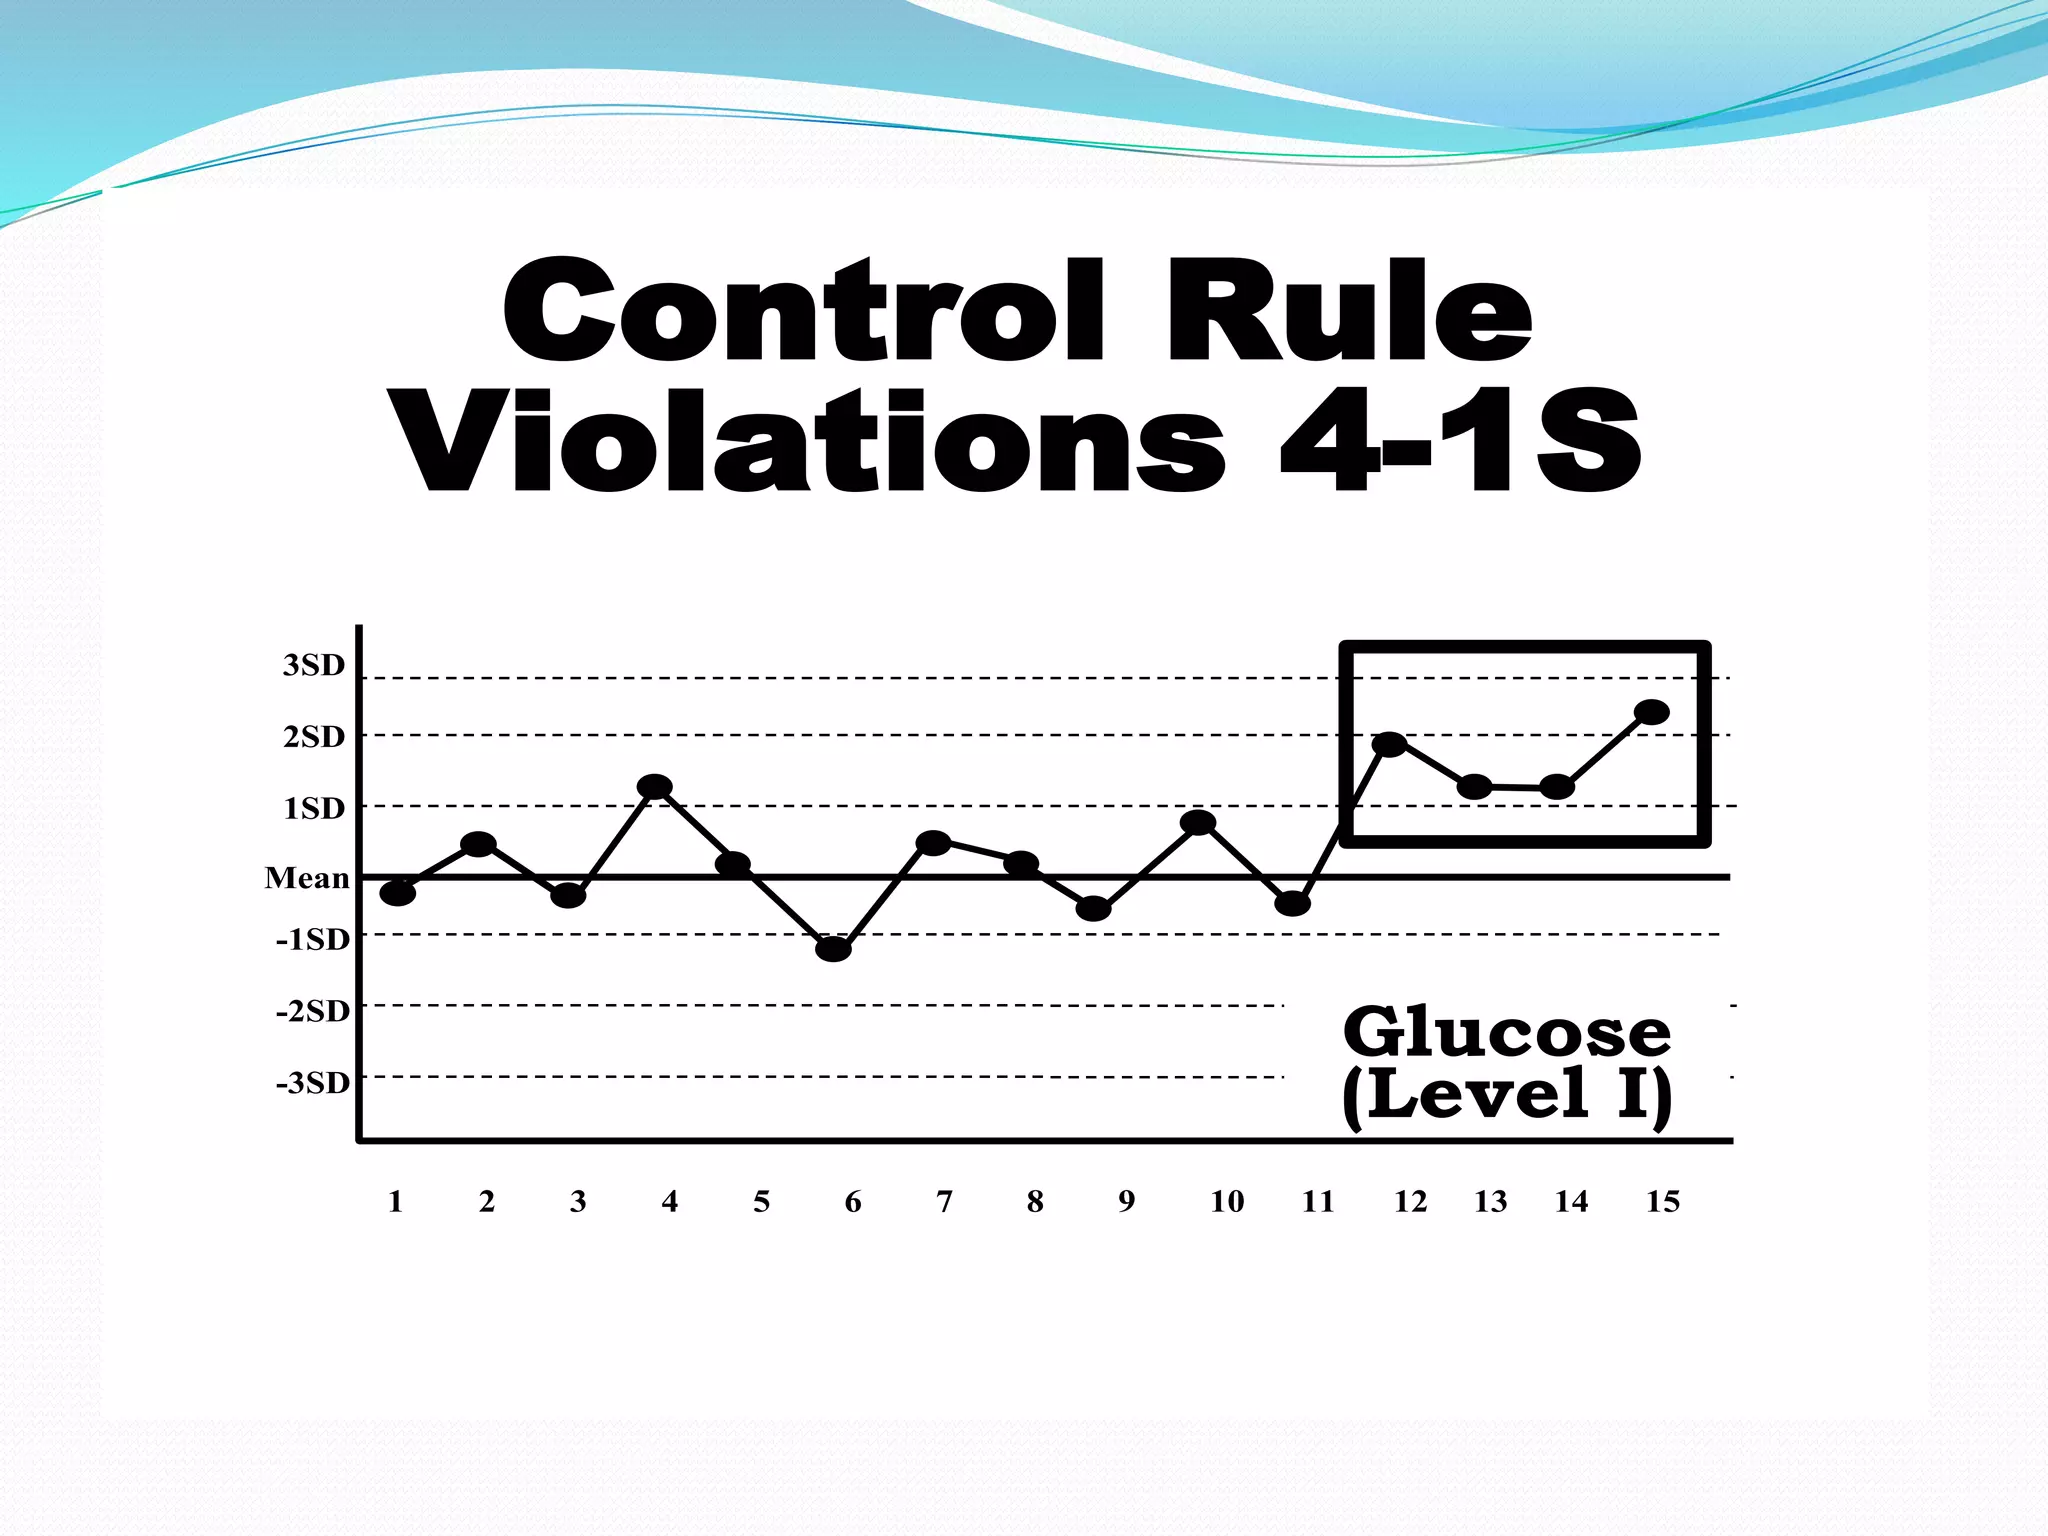
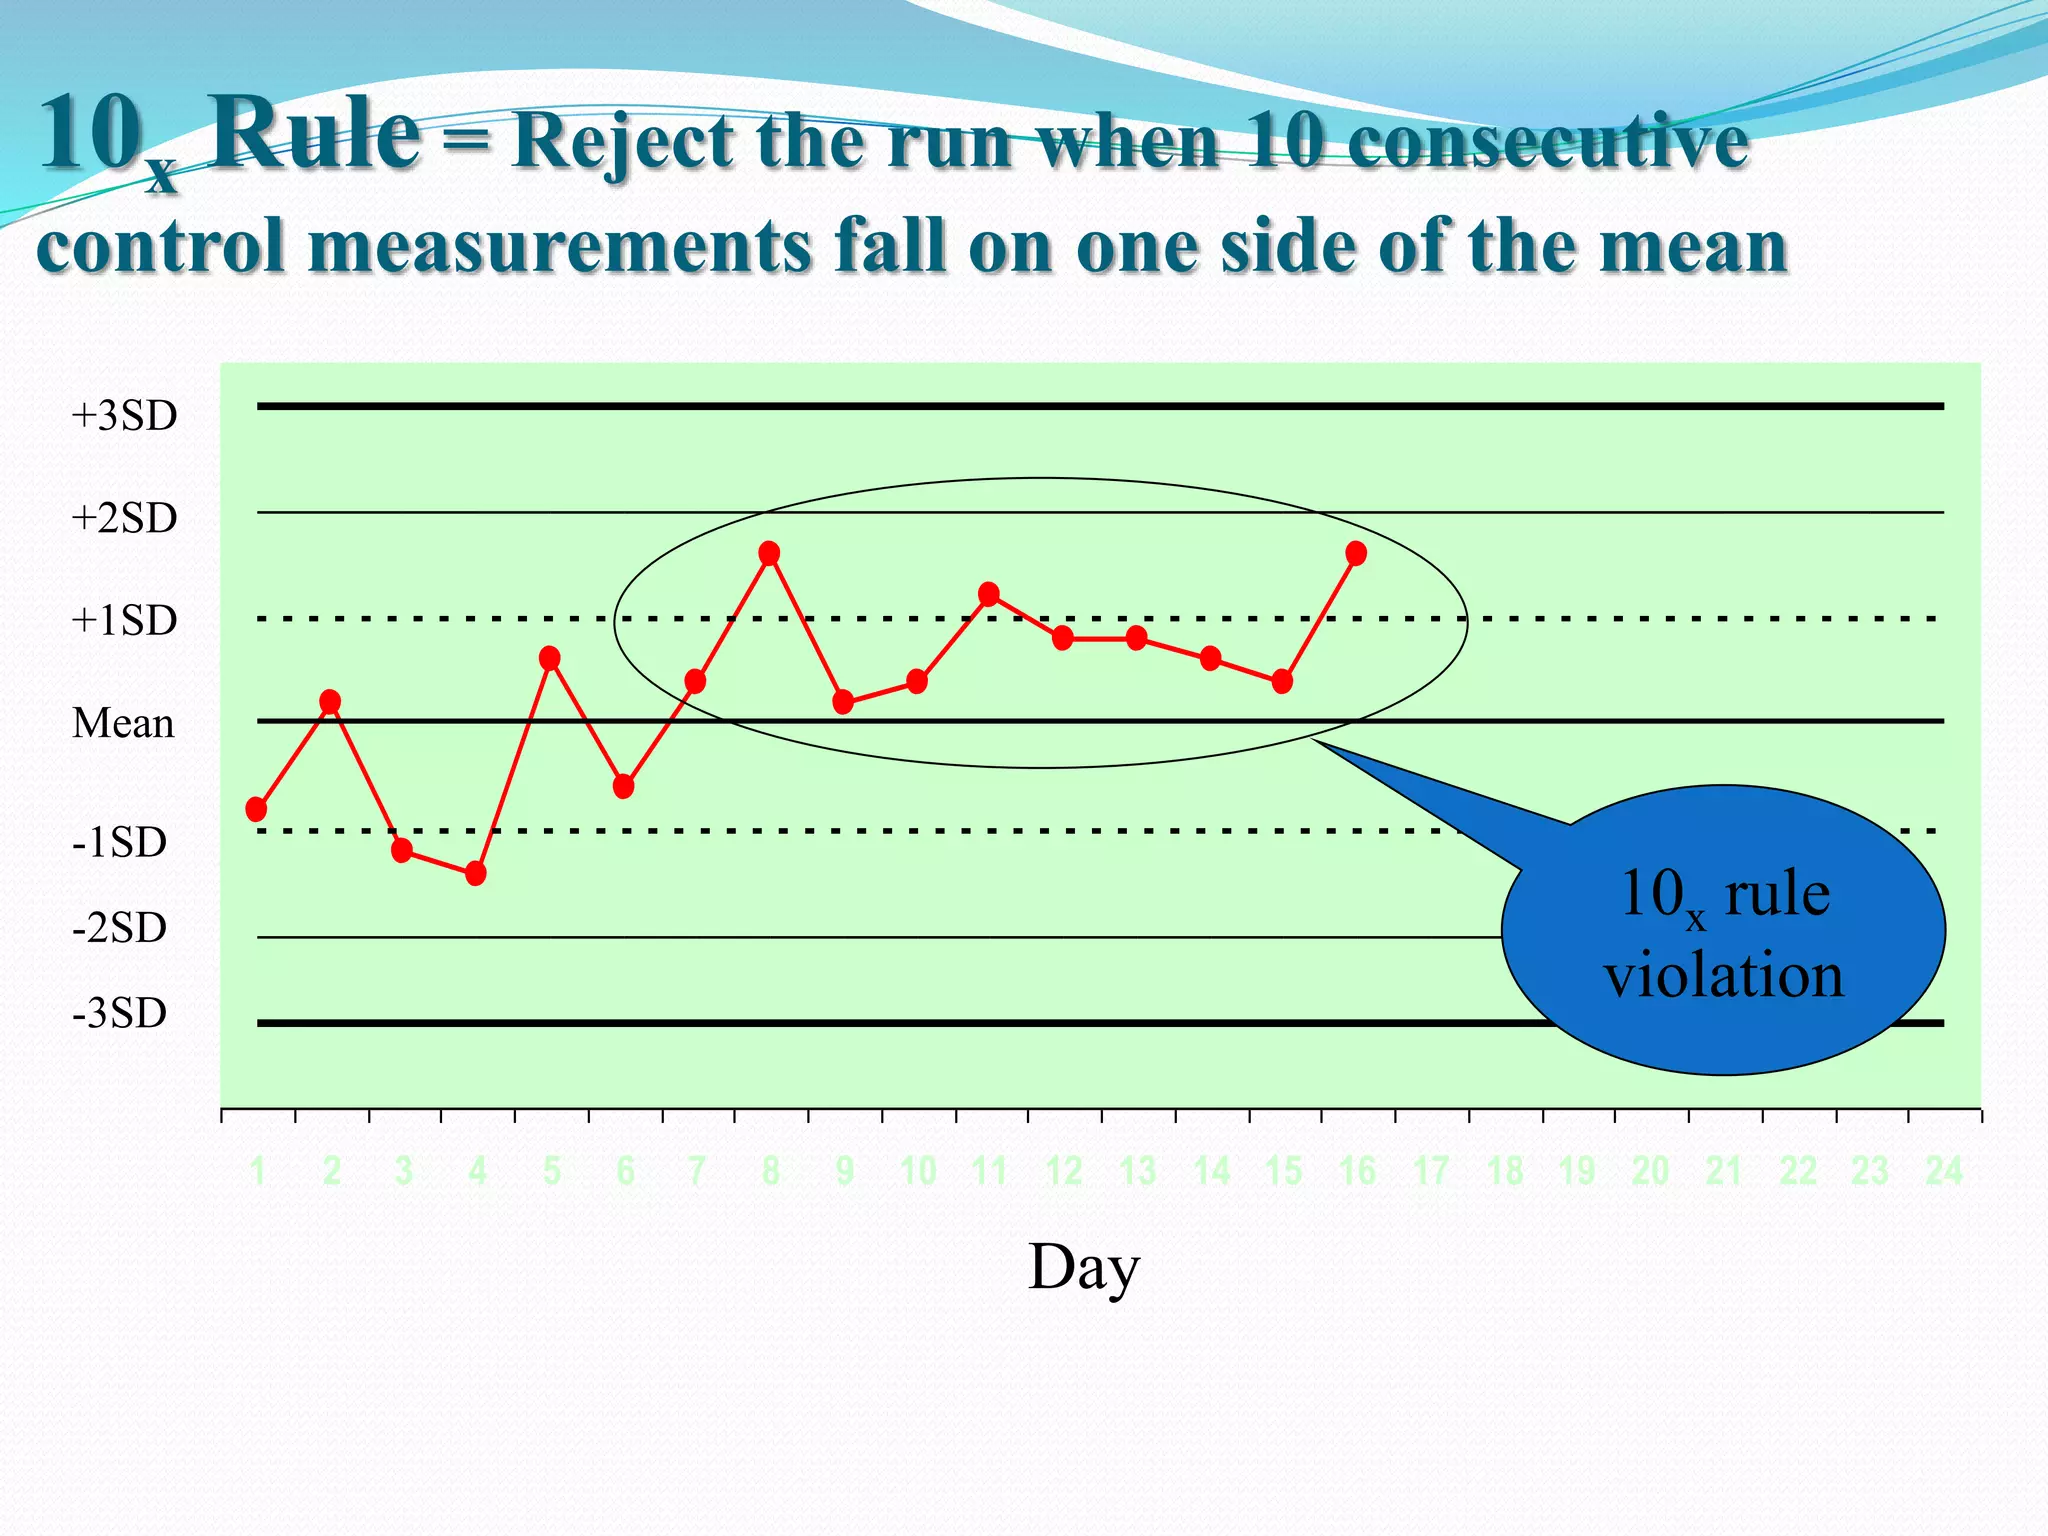
Speaker :-Dr Saikat Mandal
Moderator :-DrSupriyo Roy Choudhury
World Of Automation
History
Antonie van Leeuwenhoek
Invented Microscope
The world of cells was colorless
until Paul Ehrlich stained blood cells
Wallace Coulter :First automated analyzer for
counting and sizing cells and presented it in 1956
Automation In Hematology
 Cell counts(Automated hematology analyzers)
 Diagnosis of hemoglobinopathies(HPLC)
 Immunophenotyping(Flow cytometry)
 Coagulation(Coagulometers)
Automated Hematology
Analyzers
Hemogram-Backbone of any lab evaluation
As a routine investigation
Including anaemia, polycythemia,
infection, inflammation,
allergy, drug toxicity, malignancy,
bleeding tendency etc
Aim-to study RBC, WBC series and platelets
Advantages
 Speed with efficient handling of large number of samples
 Accuracy and precision in
quantitative blood tests
 Ability to perform multiple
tests on a single platform
 Significant reduction of labor
requirements
 Invaluable for accurate determination
of red cell indices
Disadvantages
 Flagging of a laboratory test result demands labour intensive
manual examination of a blood smear
 Comments on red cell morphology
cannot be generated
 Platelet Clumps are counted as single.
so low count.
 Erroneously increased or decreased
results due to interfering factors
 Expensive with high running costs
Types of counters
 Semi automated :
Some steps carried out manually like dilution of blood
Measures only a few parameters
 Fully automated:
Require only anticoagulated blood samples.
Measures multiple parameters
Components of a cell counter
3 Basic components
Hydraulics:
Includes aspirating unit, dispencers,diluters,mixing
chambers, aperture baths &
hemoglobinometer
Pneumatics :
Vacuums & pressure for
operating valves
Electronics :
Analyzer &computing circuit
Principles of Working
 Electrical Impedance
 Optical Light Scatter
 Fluorescence
 Light absorption
 Electrical conductivity
?!!@#@#
Electrical Impedance
 First introduced by Wallace
Coulter
 Blood cells are poor conductor of
electricity
 2 chambers filled with a
conductive
buffered electrolyte solution
 Separated by a small aperture
 DC current between two
electrodes
Electrical Impedance
 Diluant displacement causes
potential
difference
 Voltage pulse displayed on
an osciloscope
 No. of impulse = No. of cells
 Height = vol. of cells
 Freq dist curve & size dist
histograms
 Requisite – High dilution
Optical Light Scatter
 Each cell flows in a single line
through a flow cell
 A laser device focussed
 On striking on cells scattering
in different directions
 Sensor capture & multiplies
 Forward angle light scatter
(FALS)-Cell Size
 Side scatter(SS)-Granularity
Other Methods
 Peroxide based counters:
MPO is used to count neutrophils.Lymphocytes not stained
 Fluroscence based:
Retic and platelet count.Immature pltlets detected best
 Immunological based:
Accurate platelet count using CD41/CD61 antibodies
INTERPRETATION
3 Part Analyzer
5 Part Analyzer
IP Messages
 Interpretive messages
 Assist the laboratory in
screening for abnormal
samples that may need
verification
 Seen at the bottom end of
hemogram
Indicators that may appear after the
data
 @ : Data is outside the linearity limit
 * : Data is doubtful
 + or – :Data is outside the reference limits.
 ---- : Data doesn’t appear due to analysis error or
abnormal sample
 ++++ : Data exceeds display limit.
Discrimination Thresholds
 WBC Discriminator
WBC LOWER discriminator-the optimum position in 30 - 60 fL .WBC
is calculated from the particle counts more than this LOWER
discriminator.
 RBC Discriminator
RBC LOWER discriminator- optimum position in 25 -75 fL and UPPER
discriminator, 200 - 250 fL,.
RBC is calculated from the particle counts between this LOWER
discriminator and UPPER discriminator.
 PLATELET Discriminator
PLT LOWER discriminator, the optimum position in 2 – 6 fL and and
UPPER discriminator- 12 - 30 fL,
Histograms
These are the graphical presentation
of numerical datas of different cell
populations in a cell counter.On the
X-axis is the cell size and on the Y-
axis is the number of cells.
Used to determine:
The average size
Distribution of size
Detect subpopulation
Flagging System
 Whenever any significant
abnormalities of any cell
present , signalled by
certain ‘asteriks’ on the
report.
 Every instrument has its
own flagging system.
Parameters Measured
Directly Measured Derived From Histograms Calculated
1.RBC Count
2.WBC Count
3.Platlet count
4.Hemoglobin
5.Reticulocyte
Count
1.MCV
2.RDW
3.DLC
4.PDW
1.Hematorit
( MCV/RBC
Count)
2.MCH
(Hb/RBC Count)
3.MCHC
(Hb/Hct)
RBC Histogram
 Gaussian(Bell Shaped)curve
 Peak ideally within 80-100 fl
 2 flexible discriminator
LD (25-75fl)
UD(200-250fl)
RU-Flag
 Normoblasts
 Cold agglutinins
 ALL- L1
RL- Flag
 Large platelets
 Fragmented RBCs
 Platelet aggregation
MP-Flag
 Blood transfusion
 Dimorphic anaemia
 Treated IDA
Red Cell Distribution Width
RDW-SD- 20% height on y
axis.
 Normal-35-45 fl
RDW-CV- SD/MCV X 100
 Normal- 11.5-14.5 %
WBC HISTOGRAM
 LD(30-60fl)
 Flexible UD at 300 fl
 2 Troughs
T1(78-114fl)
T2(<150fl)
WL-Flag
 Curve does not start at
base line
 Platelet aggregation
 Lyse resistant RBCs
 Cold agglutinins
 nRBCs.
 Giant platelets
WU- Flag
 Curve does not end at
baseline
 Immature WBCs
 Hyperleucocytosis
 Peak Between T1- T2: Acute Leukemia
 Peak Between LD- T1: CLL.
 Peak Between T2- UD : Neutrophilia
LD UD
T1 T2
T1 Flag
 T1 is not found
 CML
T2 Flag
 T2 not found
 CLL
F1,F2,F3 Flags
 No other flags are present
 But valleys are far from base line
 F1(small cell inaccurate):Height of
T1 exceeds limit of 40%
ALL
 F2(medium cell
inaccurate):Heights of T1 & T2
exceeds limit of 40% & 50%
Respectively AML,Eosinophilia
 F3(Large cell data inaccuraate)
Height of T2 exceeds limit of 50%
F1 FF2 F3
Platelet Histograms
 Between 2 descriminators
 Touch baseline
 LD(2-6fl)
 UD(12-30fl)
 3 types of curve-A,B,C
 MPV= Platelet index
 8-12fl
 PDW: 9-14fl.
PDW
20
100
PL-Flag
 Cell Fragments
 Contamination
 Bacteria
PU-Flag
 Clotted Blood
 Fragmented RBCs
 Pseudo-thrombocytosis
 Large platelets
MP-Flag
 Anisocytosis
 Aggregation
 Recovery after chemo
Flowcytometry- Principle
Scattergram
VCS Technology
Volume
As opposed to using 0ø light loss to estimate cell
size,VCS utilizes the Coulter Principle of (DC)
Impedance to physically measure the volume that
the entire cell displaces in an isotonic diluent.
This method accurately sizes all cell types
regardless of their orientation in the light path.
Conductivity
Alternating current in the radio frequency (RF)
range short circuits the bipolar lipid layer of a
cell's membrane allowing the energy to
penetrate the cell. This powerful
probe is used to collect information about cell
size and internal structure, including chemical
composition and nuclear volume.
Scatter
When a cell is struck by the coherent light of a
LASER beam, the scattered light spreads out in
all directions.Using a proprietary new detector,
median angle light scatter (MALS) signals, are
collected to obtain information about cellular
granularity, nuclear lobularity and cell surface
structure
Newer Parameters
Red cell Parameters White Cell Parameters Platelet Parameters
 Nucleated red cell
 IRF
 CHCM
 Retic Hb content
 Fragmented Red Cells
 Immature Granulocytes
 Abnormal Lymphocytes
 Hematopoietic Stem Cells
 Malaria Discriminant
Factor
 Immature Platelet
Fraction
Newer Parameters(contd..)
 Cellular Hb Concentration Mean(CHCM):
Uses Light scatter technology.
True estimate of hypochromia in IDA.
 Hb Distribution Width:
Degree of variation in red cell hemoglobinization.
Range-1.82 to 2.64.
 Nucleated Red Cells:
nRBCs identified,separated & corrected count obtained.
WBCs have high fluorescence & forward scatter.
Newer Parameters(contd..)
 Reticuloctes:
Various dyes & flurochromes bind with RNA
RNA content- 3 Maturation stages; LFR,MFR & HFR
Immature reticulocyte Fraction(IRF):
Sum of MFR & HFR.
Early and sensitive index for erythropoisis.
Reticulocyte Hb Equivalent(RET-He):
Hb content of freshly prepared RBCs.
Real time information on Fe supply to erythropoiesis.
Early detection of Fe deficiency.
Differentiate IDA & ACD.
Monitoring of erythropoietin & Fe therapy.
Newer Parameters(contd..)
 P-LCR(Platelet Large Cell Ratio):
% of platelets with a vol >12fl.
Due to platelet aggregates,microerythrocytes,giant platelets.
 Reticulated Platelets /Immature Platelet Fraction(IPF):
Newly produced platelets that have remains of RNA in their
cytoplasm.
Reflects rate of thrombopoiesis.
WBC Research Population Data Case Study – Malaria Parasites(Normal plot and
Research Population Data compared to a patient infected with malaria type
Plasmodium falciparum. Note the increased size and variation of the lymph's and
Monocyte's.)
NORMAL
Normal
Normal MO
Normal LY
Macrophage
Parasitized
RBC
MALARIA
MP Positive
Reactive LY
Quality Control
Terminologies
 Quality Assessment:
Adequate control of the pre & post analytical from
sample collection to report dispatch.
 Quality Control:
Measures that must be included during each assay
run to verify the test working properly.
 Proficiency Testing:
Determines the quality of results generated by lab.
 Internal Quality control:
Continuous evaluation of the
reliability of the daily works of
the lab with validation of tests.
 External Quality Control:
Evaluation by an outside agency
of between-laboratory &
between-method comparability.
Accuracy & Precision
 Accuracy:
Refers to closeness to the true
value
 Precision:
Refers to reproducibility of
test
1 2
3 4
Controls & Calibrators
 Controls:
Substances used to check the precision .
Analyzed either daily or along each batch.
Should have same test properties as blood
samples.
Stabilized anticoagulated whole blood or
pooled red cells.
3 conc.-high,normal ,low
 Calibrators:
Check the accuracy.
Value assigned to them by a reliable ref.
center.
precision
Use of controls:
Most convenient & accurate procedure.
Prepared in house or obtained commercially.
10 consecutive values of control recorded and Mean & SD
calculated.
3 conc of control to be analyzed.
Plotted in Levey-Jennings Chart.
Levey-Jennings Chart
Mean
1 SD
2 SD
3 SD
1 SD
2 SD
3 SD
Control Values and Decision
 Consider using Westgard Control Rules
 Use premise that 95.5% of control values should fall
within ±2SD
 Commonly applied when two levels of control are used
 Use in a sequential fashion
Westgard Rules
 1 2s rule
 1 3s rule
 2 2s rule
 R-4s rule
 4 1s rule
 10x rule
12S Rule = A warning to trigger careful inspection
of the control data
1 2 3 4 5 6 7 8 9 10 11 12 13 14 15 16 17 18 19 20 21 22 23 24
Mean
Day
+1SD
+2SD
+3SD
-1SD
-2SD
-3SD
12S rule
violation
13S Rule = Reject the run when a single control
measurement exceeds the +3SD or -3SD control limit
1 2 3 4 5 6 7 8 9 10 11 12 13 14 15 16 17 18 19 20 21 22 23 24
Mean
Day
+1SD
+2SD
+3SD
-1SD
-2SD
-3SD
13S rule
violation
22S Rule = Reject the run when 2 consecutive control
measurements exceed the same +2SD or -2SD control
limit
1 2 3 4 5 6 7 8 9 10 11 12 13 14 15 16 17 18 19 20 21 22 23 24
Mean
Day
+1SD
+2SD
+3SD
-1SD
-2SD
-3SD
22S rule
violation
Control Rule
Violations 4-1S
1 2 3 4 5 6 7 8 9 10 11 12 13 14 15
Mean
-1SD
-2SD
-3SD
3SD
2SD
1SD
Glucose
(Level I)
10x Rule = Reject the run when 10 consecutive
control measurements fall on one side of the mean
1 2 3 4 5 6 7 8 9 10 11 12 13 14 15 16 17 18 19 20 21 22 23 24
Mean
Day
+1SD
+2SD
+3SD
-1SD
-2SD
-3SD
10x rule
violation
What to do when Control Value is
out of limit?
 “out of control”
 Stop testing
 Identify and correct problem
 Repeat testing on patient samples and
controls
 Do not report patient results until
problem is solved and controls indicate
proper performance
Accreditation
 Certification by a duly recognized authority of
facilities, capability, objectivity, competence and
integrity of an agency.
Take home message
Automation is a supplement
and not
a substitute to manual methods
Thank You

Automated cell counter & its quality control

  • 1.
    Speaker :-Dr SaikatMandal Moderator :-DrSupriyo Roy Choudhury
  • 2.
  • 3.
    History Antonie van Leeuwenhoek InventedMicroscope The world of cells was colorless until Paul Ehrlich stained blood cells Wallace Coulter :First automated analyzer for counting and sizing cells and presented it in 1956
  • 4.
    Automation In Hematology Cell counts(Automated hematology analyzers)  Diagnosis of hemoglobinopathies(HPLC)  Immunophenotyping(Flow cytometry)  Coagulation(Coagulometers)
  • 5.
    Automated Hematology Analyzers Hemogram-Backbone ofany lab evaluation As a routine investigation Including anaemia, polycythemia, infection, inflammation, allergy, drug toxicity, malignancy, bleeding tendency etc Aim-to study RBC, WBC series and platelets
  • 6.
    Advantages  Speed withefficient handling of large number of samples  Accuracy and precision in quantitative blood tests  Ability to perform multiple tests on a single platform  Significant reduction of labor requirements  Invaluable for accurate determination of red cell indices
  • 7.
    Disadvantages  Flagging ofa laboratory test result demands labour intensive manual examination of a blood smear  Comments on red cell morphology cannot be generated  Platelet Clumps are counted as single. so low count.  Erroneously increased or decreased results due to interfering factors  Expensive with high running costs
  • 8.
    Types of counters Semi automated : Some steps carried out manually like dilution of blood Measures only a few parameters  Fully automated: Require only anticoagulated blood samples. Measures multiple parameters
  • 10.
    Components of acell counter 3 Basic components Hydraulics: Includes aspirating unit, dispencers,diluters,mixing chambers, aperture baths & hemoglobinometer Pneumatics : Vacuums & pressure for operating valves Electronics : Analyzer &computing circuit
  • 11.
    Principles of Working Electrical Impedance  Optical Light Scatter  Fluorescence  Light absorption  Electrical conductivity ?!!@#@#
  • 12.
    Electrical Impedance  Firstintroduced by Wallace Coulter  Blood cells are poor conductor of electricity  2 chambers filled with a conductive buffered electrolyte solution  Separated by a small aperture  DC current between two electrodes
  • 13.
    Electrical Impedance  Diluantdisplacement causes potential difference  Voltage pulse displayed on an osciloscope  No. of impulse = No. of cells  Height = vol. of cells  Freq dist curve & size dist histograms  Requisite – High dilution
  • 14.
    Optical Light Scatter Each cell flows in a single line through a flow cell  A laser device focussed  On striking on cells scattering in different directions  Sensor capture & multiplies  Forward angle light scatter (FALS)-Cell Size  Side scatter(SS)-Granularity
  • 15.
    Other Methods  Peroxidebased counters: MPO is used to count neutrophils.Lymphocytes not stained  Fluroscence based: Retic and platelet count.Immature pltlets detected best  Immunological based: Accurate platelet count using CD41/CD61 antibodies
  • 17.
  • 18.
  • 19.
  • 20.
    IP Messages  Interpretivemessages  Assist the laboratory in screening for abnormal samples that may need verification  Seen at the bottom end of hemogram
  • 21.
    Indicators that mayappear after the data  @ : Data is outside the linearity limit  * : Data is doubtful  + or – :Data is outside the reference limits.  ---- : Data doesn’t appear due to analysis error or abnormal sample  ++++ : Data exceeds display limit.
  • 22.
    Discrimination Thresholds  WBCDiscriminator WBC LOWER discriminator-the optimum position in 30 - 60 fL .WBC is calculated from the particle counts more than this LOWER discriminator.  RBC Discriminator RBC LOWER discriminator- optimum position in 25 -75 fL and UPPER discriminator, 200 - 250 fL,. RBC is calculated from the particle counts between this LOWER discriminator and UPPER discriminator.  PLATELET Discriminator PLT LOWER discriminator, the optimum position in 2 – 6 fL and and UPPER discriminator- 12 - 30 fL,
  • 23.
    Histograms These are thegraphical presentation of numerical datas of different cell populations in a cell counter.On the X-axis is the cell size and on the Y- axis is the number of cells. Used to determine: The average size Distribution of size Detect subpopulation
  • 24.
    Flagging System  Wheneverany significant abnormalities of any cell present , signalled by certain ‘asteriks’ on the report.  Every instrument has its own flagging system.
  • 25.
    Parameters Measured Directly MeasuredDerived From Histograms Calculated 1.RBC Count 2.WBC Count 3.Platlet count 4.Hemoglobin 5.Reticulocyte Count 1.MCV 2.RDW 3.DLC 4.PDW 1.Hematorit ( MCV/RBC Count) 2.MCH (Hb/RBC Count) 3.MCHC (Hb/Hct)
  • 26.
    RBC Histogram  Gaussian(BellShaped)curve  Peak ideally within 80-100 fl  2 flexible discriminator LD (25-75fl) UD(200-250fl)
  • 27.
    RU-Flag  Normoblasts  Coldagglutinins  ALL- L1
  • 28.
    RL- Flag  Largeplatelets  Fragmented RBCs  Platelet aggregation
  • 29.
    MP-Flag  Blood transfusion Dimorphic anaemia  Treated IDA
  • 30.
    Red Cell DistributionWidth RDW-SD- 20% height on y axis.  Normal-35-45 fl RDW-CV- SD/MCV X 100  Normal- 11.5-14.5 %
  • 31.
    WBC HISTOGRAM  LD(30-60fl) Flexible UD at 300 fl  2 Troughs T1(78-114fl) T2(<150fl)
  • 32.
    WL-Flag  Curve doesnot start at base line  Platelet aggregation  Lyse resistant RBCs  Cold agglutinins  nRBCs.  Giant platelets
  • 33.
    WU- Flag  Curvedoes not end at baseline  Immature WBCs  Hyperleucocytosis
  • 34.
     Peak BetweenT1- T2: Acute Leukemia  Peak Between LD- T1: CLL.  Peak Between T2- UD : Neutrophilia LD UD T1 T2
  • 35.
    T1 Flag  T1is not found  CML
  • 36.
    T2 Flag  T2not found  CLL
  • 37.
    F1,F2,F3 Flags  Noother flags are present  But valleys are far from base line  F1(small cell inaccurate):Height of T1 exceeds limit of 40% ALL  F2(medium cell inaccurate):Heights of T1 & T2 exceeds limit of 40% & 50% Respectively AML,Eosinophilia  F3(Large cell data inaccuraate) Height of T2 exceeds limit of 50% F1 FF2 F3
  • 38.
    Platelet Histograms  Between2 descriminators  Touch baseline  LD(2-6fl)  UD(12-30fl)  3 types of curve-A,B,C
  • 39.
     MPV= Plateletindex  8-12fl  PDW: 9-14fl. PDW 20 100
  • 40.
    PL-Flag  Cell Fragments Contamination  Bacteria
  • 41.
    PU-Flag  Clotted Blood Fragmented RBCs  Pseudo-thrombocytosis  Large platelets
  • 42.
  • 43.
  • 44.
  • 45.
  • 46.
    Volume As opposed tousing 0ø light loss to estimate cell size,VCS utilizes the Coulter Principle of (DC) Impedance to physically measure the volume that the entire cell displaces in an isotonic diluent. This method accurately sizes all cell types regardless of their orientation in the light path. Conductivity Alternating current in the radio frequency (RF) range short circuits the bipolar lipid layer of a cell's membrane allowing the energy to penetrate the cell. This powerful probe is used to collect information about cell size and internal structure, including chemical composition and nuclear volume. Scatter When a cell is struck by the coherent light of a LASER beam, the scattered light spreads out in all directions.Using a proprietary new detector, median angle light scatter (MALS) signals, are collected to obtain information about cellular granularity, nuclear lobularity and cell surface structure
  • 47.
    Newer Parameters Red cellParameters White Cell Parameters Platelet Parameters  Nucleated red cell  IRF  CHCM  Retic Hb content  Fragmented Red Cells  Immature Granulocytes  Abnormal Lymphocytes  Hematopoietic Stem Cells  Malaria Discriminant Factor  Immature Platelet Fraction
  • 48.
    Newer Parameters(contd..)  CellularHb Concentration Mean(CHCM): Uses Light scatter technology. True estimate of hypochromia in IDA.  Hb Distribution Width: Degree of variation in red cell hemoglobinization. Range-1.82 to 2.64.  Nucleated Red Cells: nRBCs identified,separated & corrected count obtained. WBCs have high fluorescence & forward scatter.
  • 49.
    Newer Parameters(contd..)  Reticuloctes: Variousdyes & flurochromes bind with RNA RNA content- 3 Maturation stages; LFR,MFR & HFR Immature reticulocyte Fraction(IRF): Sum of MFR & HFR. Early and sensitive index for erythropoisis. Reticulocyte Hb Equivalent(RET-He): Hb content of freshly prepared RBCs. Real time information on Fe supply to erythropoiesis. Early detection of Fe deficiency. Differentiate IDA & ACD. Monitoring of erythropoietin & Fe therapy.
  • 50.
    Newer Parameters(contd..)  P-LCR(PlateletLarge Cell Ratio): % of platelets with a vol >12fl. Due to platelet aggregates,microerythrocytes,giant platelets.  Reticulated Platelets /Immature Platelet Fraction(IPF): Newly produced platelets that have remains of RNA in their cytoplasm. Reflects rate of thrombopoiesis.
  • 51.
    WBC Research PopulationData Case Study – Malaria Parasites(Normal plot and Research Population Data compared to a patient infected with malaria type Plasmodium falciparum. Note the increased size and variation of the lymph's and Monocyte's.) NORMAL Normal Normal MO Normal LY Macrophage Parasitized RBC MALARIA MP Positive Reactive LY
  • 52.
  • 53.
    Terminologies  Quality Assessment: Adequatecontrol of the pre & post analytical from sample collection to report dispatch.  Quality Control: Measures that must be included during each assay run to verify the test working properly.  Proficiency Testing: Determines the quality of results generated by lab.
  • 54.
     Internal Qualitycontrol: Continuous evaluation of the reliability of the daily works of the lab with validation of tests.  External Quality Control: Evaluation by an outside agency of between-laboratory & between-method comparability.
  • 55.
    Accuracy & Precision Accuracy: Refers to closeness to the true value  Precision: Refers to reproducibility of test 1 2 3 4
  • 56.
    Controls & Calibrators Controls: Substances used to check the precision . Analyzed either daily or along each batch. Should have same test properties as blood samples. Stabilized anticoagulated whole blood or pooled red cells. 3 conc.-high,normal ,low  Calibrators: Check the accuracy. Value assigned to them by a reliable ref. center.
  • 57.
    precision Use of controls: Mostconvenient & accurate procedure. Prepared in house or obtained commercially. 10 consecutive values of control recorded and Mean & SD calculated. 3 conc of control to be analyzed. Plotted in Levey-Jennings Chart.
  • 58.
    Levey-Jennings Chart Mean 1 SD 2SD 3 SD 1 SD 2 SD 3 SD
  • 59.
    Control Values andDecision  Consider using Westgard Control Rules  Use premise that 95.5% of control values should fall within ±2SD  Commonly applied when two levels of control are used  Use in a sequential fashion
  • 60.
    Westgard Rules  12s rule  1 3s rule  2 2s rule  R-4s rule  4 1s rule  10x rule
  • 61.
    12S Rule =A warning to trigger careful inspection of the control data 1 2 3 4 5 6 7 8 9 10 11 12 13 14 15 16 17 18 19 20 21 22 23 24 Mean Day +1SD +2SD +3SD -1SD -2SD -3SD 12S rule violation
  • 62.
    13S Rule =Reject the run when a single control measurement exceeds the +3SD or -3SD control limit 1 2 3 4 5 6 7 8 9 10 11 12 13 14 15 16 17 18 19 20 21 22 23 24 Mean Day +1SD +2SD +3SD -1SD -2SD -3SD 13S rule violation
  • 63.
    22S Rule =Reject the run when 2 consecutive control measurements exceed the same +2SD or -2SD control limit 1 2 3 4 5 6 7 8 9 10 11 12 13 14 15 16 17 18 19 20 21 22 23 24 Mean Day +1SD +2SD +3SD -1SD -2SD -3SD 22S rule violation
  • 64.
    Control Rule Violations 4-1S 12 3 4 5 6 7 8 9 10 11 12 13 14 15 Mean -1SD -2SD -3SD 3SD 2SD 1SD Glucose (Level I)
  • 65.
    10x Rule =Reject the run when 10 consecutive control measurements fall on one side of the mean 1 2 3 4 5 6 7 8 9 10 11 12 13 14 15 16 17 18 19 20 21 22 23 24 Mean Day +1SD +2SD +3SD -1SD -2SD -3SD 10x rule violation
  • 66.
    What to dowhen Control Value is out of limit?  “out of control”  Stop testing  Identify and correct problem  Repeat testing on patient samples and controls  Do not report patient results until problem is solved and controls indicate proper performance
  • 67.
    Accreditation  Certification bya duly recognized authority of facilities, capability, objectivity, competence and integrity of an agency.
  • 69.
    Take home message Automationis a supplement and not a substitute to manual methods
  • 70.