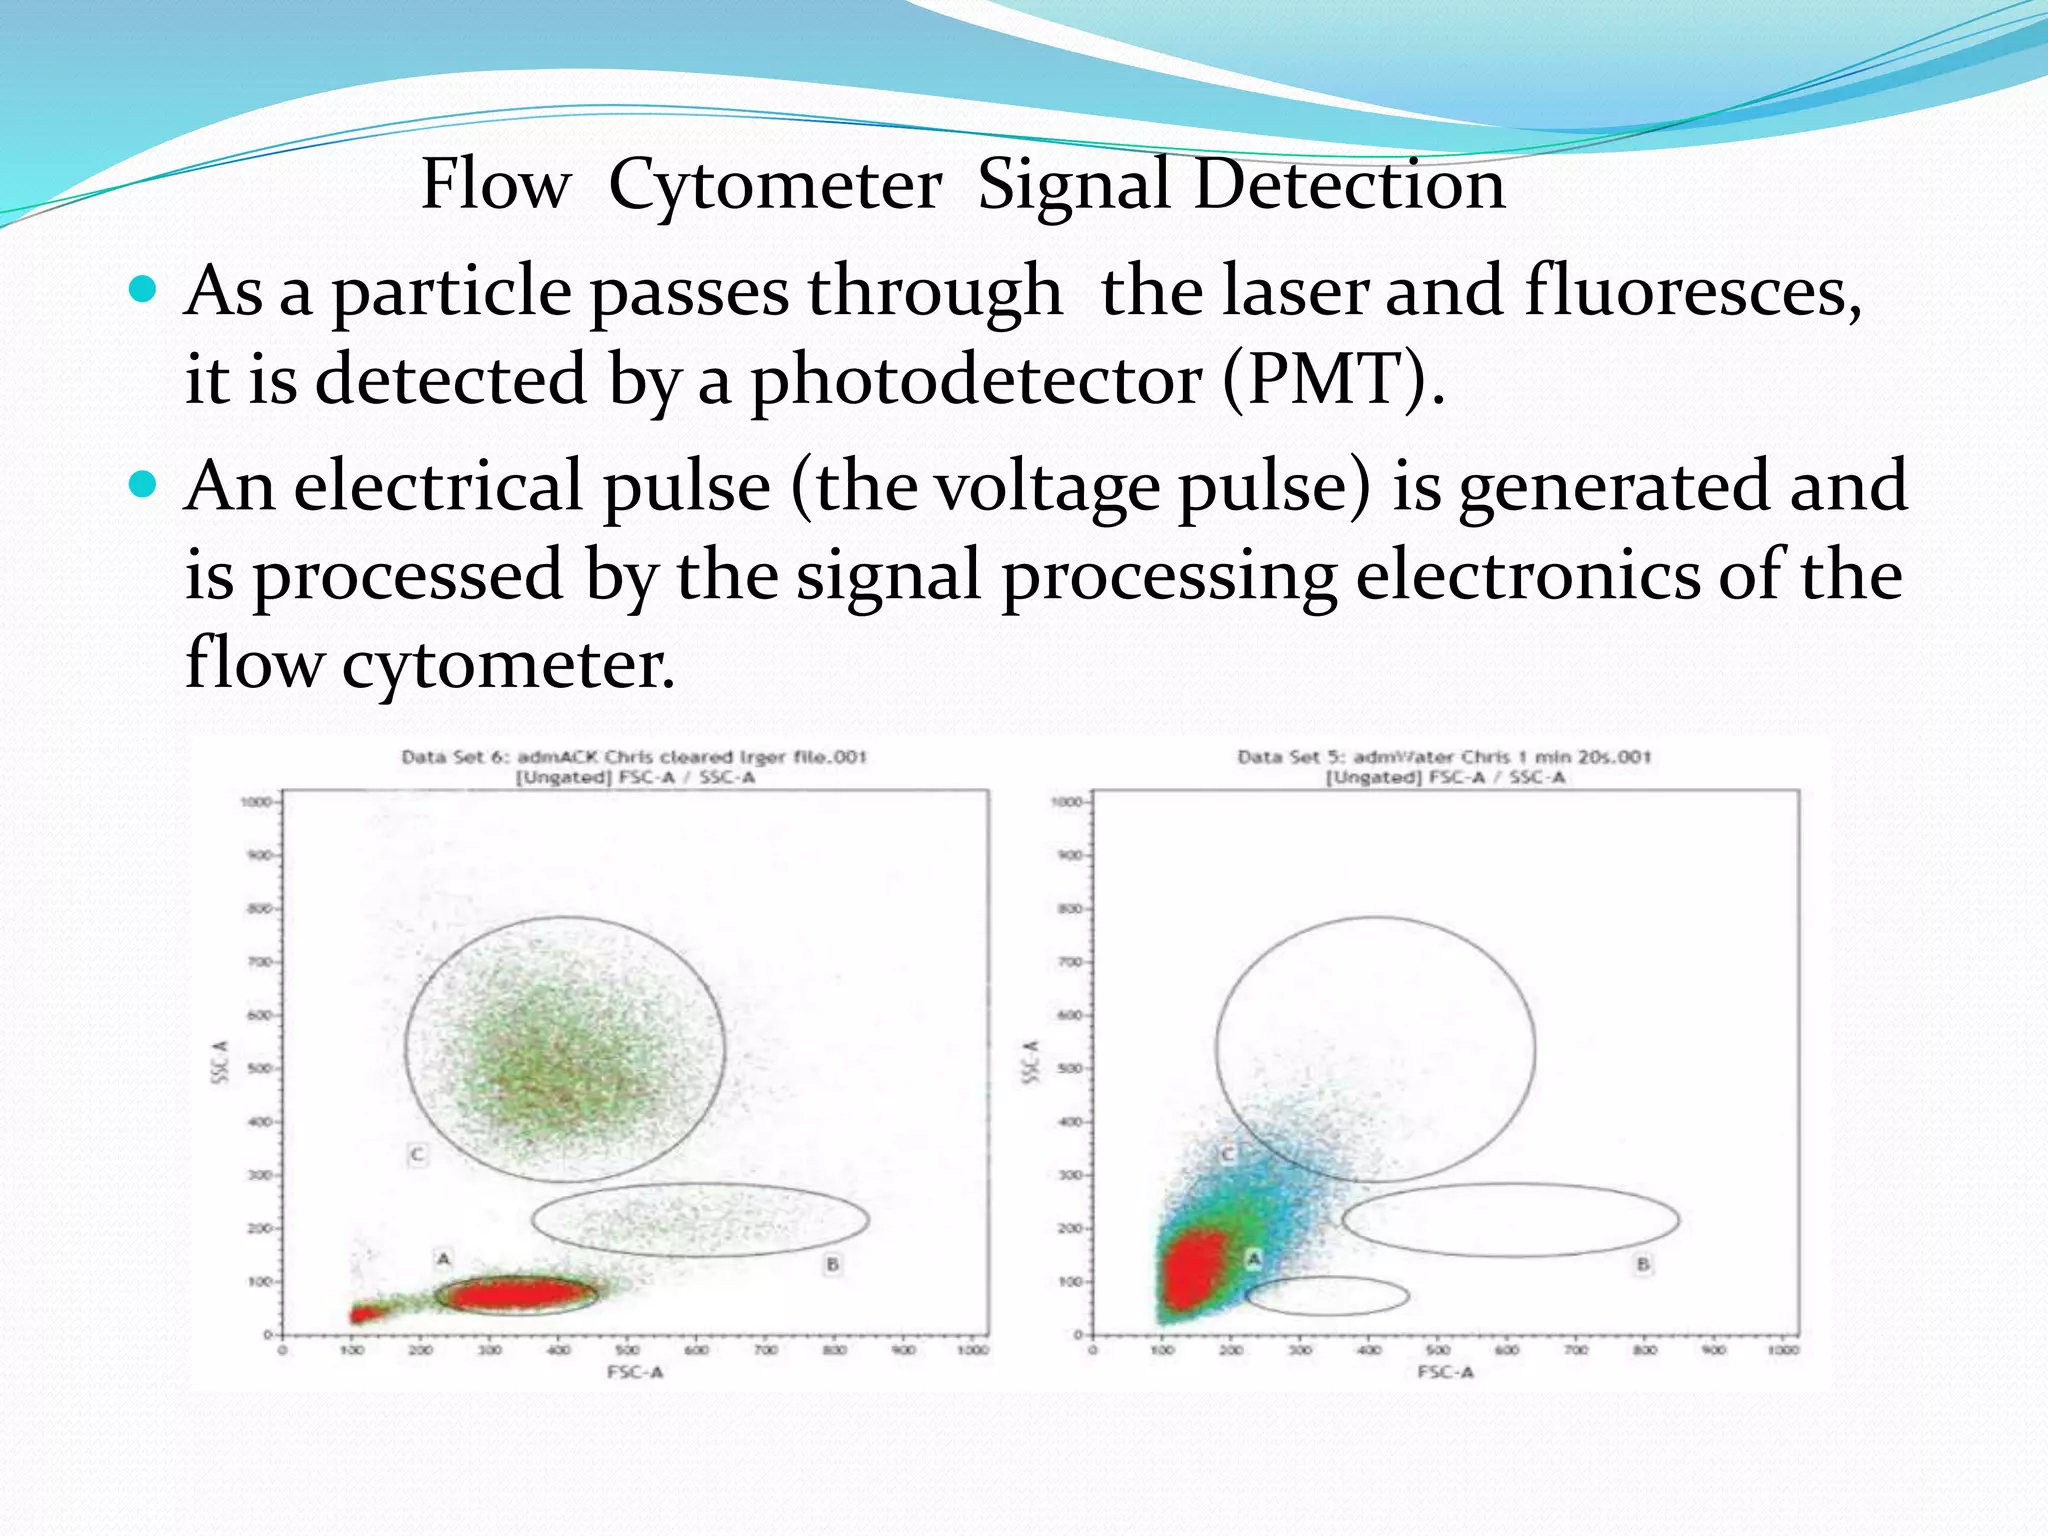
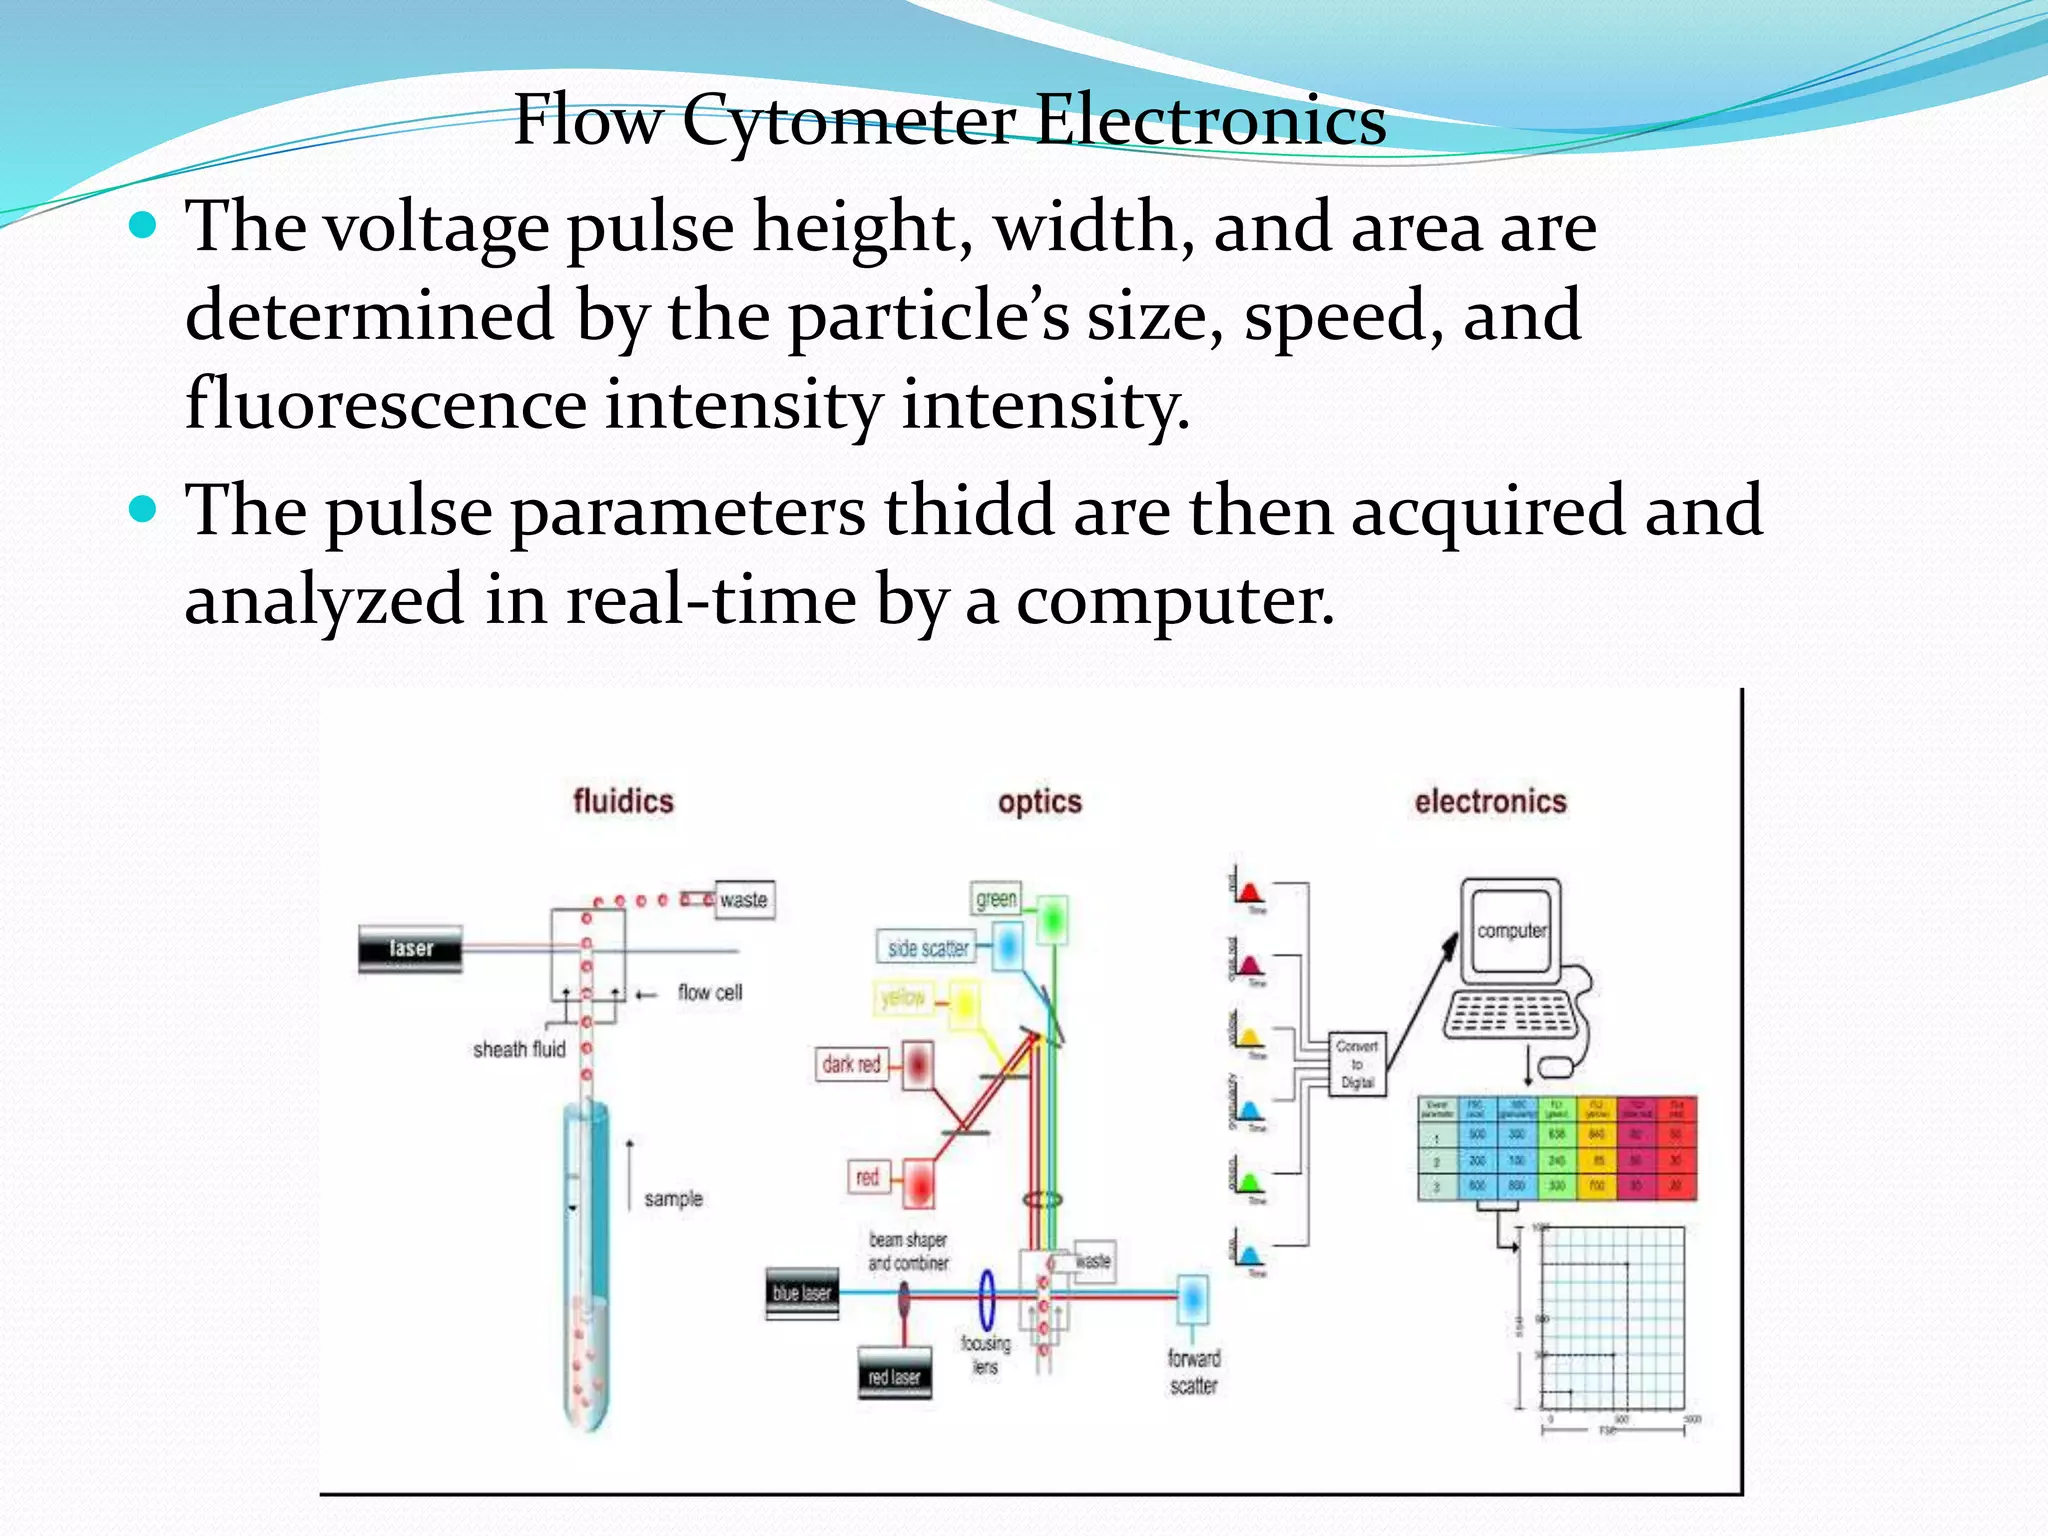
BY
OMKAR ABADHESH MISHRA
MSC ( BIOTECHNOLOGY)
Contents
 What is flow cytometry?
 Flow cytometer instrumentation.
 The use of fluorochromesin flowcytometry •
 The use of fluorochromes in flow cytometry.
 Immunophenotyping.
 Compensation
 Data analysis and gating.
 Clinical applications
 Research applications.
INTRDUCTION
• Flow cytometry is a technique for counting,examining,and
sorting microscopic objects suspended in a fluid based on
their optical properties.
• It simultaneously measures and then analyzes multiple
physical properties of single objects as they flow in a fluid
stream through a beam of light.
• Cells are measured individually, but in large numbers
• Synonymous with FACS (fluorescence activated cell sorter).
 •Microscopists visualize cells based on their
morphology and staining characteristics.
 Flow cytometrists measure cells based on similar
characteristics.
 Hence , using flow cytometry, a cell can be “seen” both
qualitatively and quantitatively.
 In the clinical lab, mixed cell populations of the blood
were evaluated manually by microscope.
 In the 1950’s, the Coulter counter automated cell
counting based on size.
 In 1960, Dr. Louis Kamentsky, in collaboration with
IBM, developed an automated optical scanner that
scanned cell preparations on slides.
Examples on the basis of size and granularity
Flow Cytometer Instrumentation
There are four general components of a flow cytometer:
1)Fluidics
2)Optics
3)Detectors
4)Electronics
 Understanding how a flow cytometer operates gyp is
critical to the design and execution of flow cytometry
experiments
Flow Cytometer Fluidics
 The cell sample is injected into a stream of sheath
fluid.
 By the laminar flow y principle, the sample remains in
the center of the sheath fluid.
 The cells in the sample are accelerated and
individually pass through a laser beam fit for
interrogation.
Light Scatter
 When a cell passes through the laser beam, it deflects
incident light.
 Forward-scattered light(FSC) is proportional to the
surface area or sizeof surface area or size of a cell.
 Side scatter ed light (SSC) is proportional to the
granularity or internal complexity of a cell.
Flow Cytometer Optics
 Light emitted from the interaction between the cell
particle and the laser beam is collected by a lens .
 The light moves through a system of optical mirrors
and filters.
 Specified wavelengths are then routed to optical
detectors.
Fluorescence
 In modern flowcytometers,more than one laser is
focused on the sample stream.
 In this way not only can cells be measured based on
their size and internal complexity, but they can also be
measured based on their fluorescent signal intensity.
 Fluorescence is typically “bestowed” upon a cell
through the use of fluorescent dyes called
fluorochromes.
Flow Cytometer Signal Detection
 As a particle passes through the laser and fluoresces,
it is detected by a photodetector (PMT).
 An electrical pulse (the voltage pulse) is generated and
is processed by the signal processing electronics of the
flow cytometer.
Fluorochrome Emission
 The laser beam excites the fluorochrome at a specific
wavelength (absorption) and the fluorochrome emits
light at a separate wavelength (emission).
 Note that absorption color differs from emission color.
Flow Cytometer Electronics
 The voltage pulse height, width, and area are
determined by the particle’s size, speed, and
fluorescence intensity intensity.
 The pulse parameters thidd are then acquired and
analyzed in real-time by a computer.
Flow Cell
 The flow cell is the flow chamber where the laser
beam interrogates the particles passing within the
sheath fluid.
 This is typically a closed system.
Immunophenotyping
 Many cell surface features (as well as some internal
characteristics) can be simultaneously assessed by
employing different combinations of fluorochromes.
 Several uniquely colored fluorochromes are available
to conduct such multicolor (multiparameter)
experiments.
Compensation
 When the wavelengths of two fluorochromes overlap,
the observed fluorescent signal detected by the flow
cytometer may not be the actual signal displayed by
the cell.
 In other words, the cell appears to possess a surface
marker or phenotype that it does not actually have.
Gating
 To optimize the analysis of multiparameter
experiments, gating is performed to isolate cell
subpopulations of interest.
 This step often eliminates p the need to physically
sort cells for further analysis
Data Analysis
 Flow cytometry is utilized both in the clinical lab and
the research lab.
 Standardization has resulted in data that is
reproducible across laboratories reproducible
 Accurate data representation is key to this
reproducibility.
 This is a 2D dotplota dot plot; a commonly used
method of data representation.
Applications -Clinical
 CD4 +T cell counts are used to monitor the it
progression of AIDS in HIV-infected patients
Applications -Research
 A kinetics assay, such as Ca2+mobilization, can be
performed using a fluorochrome, that binds to
calcium ions.
 Cells are loaded with indo-1 and then stimulated to
mobilize Ca2+.
 The UV laser excites the indo-1 and a fluorescent pulse
is observed.
THANK YOU
OMKAR ABADHESH MISHRA
MSC ( BIOTECHNOLOGY)

Flow cytometry

  • 1.
  • 2.
    Contents  What isflow cytometry?  Flow cytometer instrumentation.  The use of fluorochromesin flowcytometry •  The use of fluorochromes in flow cytometry.  Immunophenotyping.  Compensation  Data analysis and gating.  Clinical applications  Research applications.
  • 3.
    INTRDUCTION • Flow cytometryis a technique for counting,examining,and sorting microscopic objects suspended in a fluid based on their optical properties. • It simultaneously measures and then analyzes multiple physical properties of single objects as they flow in a fluid stream through a beam of light. • Cells are measured individually, but in large numbers • Synonymous with FACS (fluorescence activated cell sorter).
  • 4.
     •Microscopists visualizecells based on their morphology and staining characteristics.  Flow cytometrists measure cells based on similar characteristics.  Hence , using flow cytometry, a cell can be “seen” both qualitatively and quantitatively.  In the clinical lab, mixed cell populations of the blood were evaluated manually by microscope.  In the 1950’s, the Coulter counter automated cell counting based on size.  In 1960, Dr. Louis Kamentsky, in collaboration with IBM, developed an automated optical scanner that scanned cell preparations on slides.
  • 5.
    Examples on thebasis of size and granularity
  • 6.
    Flow Cytometer Instrumentation Thereare four general components of a flow cytometer: 1)Fluidics 2)Optics 3)Detectors 4)Electronics  Understanding how a flow cytometer operates gyp is critical to the design and execution of flow cytometry experiments
  • 7.
    Flow Cytometer Fluidics The cell sample is injected into a stream of sheath fluid.  By the laminar flow y principle, the sample remains in the center of the sheath fluid.  The cells in the sample are accelerated and individually pass through a laser beam fit for interrogation.
  • 8.
    Light Scatter  Whena cell passes through the laser beam, it deflects incident light.  Forward-scattered light(FSC) is proportional to the surface area or sizeof surface area or size of a cell.  Side scatter ed light (SSC) is proportional to the granularity or internal complexity of a cell.
  • 9.
    Flow Cytometer Optics Light emitted from the interaction between the cell particle and the laser beam is collected by a lens .  The light moves through a system of optical mirrors and filters.  Specified wavelengths are then routed to optical detectors.
  • 10.
    Fluorescence  In modernflowcytometers,more than one laser is focused on the sample stream.  In this way not only can cells be measured based on their size and internal complexity, but they can also be measured based on their fluorescent signal intensity.  Fluorescence is typically “bestowed” upon a cell through the use of fluorescent dyes called fluorochromes.
  • 11.
    Flow Cytometer SignalDetection  As a particle passes through the laser and fluoresces, it is detected by a photodetector (PMT).  An electrical pulse (the voltage pulse) is generated and is processed by the signal processing electronics of the flow cytometer.
  • 12.
    Fluorochrome Emission  Thelaser beam excites the fluorochrome at a specific wavelength (absorption) and the fluorochrome emits light at a separate wavelength (emission).  Note that absorption color differs from emission color.
  • 13.
    Flow Cytometer Electronics The voltage pulse height, width, and area are determined by the particle’s size, speed, and fluorescence intensity intensity.  The pulse parameters thidd are then acquired and analyzed in real-time by a computer.
  • 14.
    Flow Cell  Theflow cell is the flow chamber where the laser beam interrogates the particles passing within the sheath fluid.  This is typically a closed system.
  • 15.
    Immunophenotyping  Many cellsurface features (as well as some internal characteristics) can be simultaneously assessed by employing different combinations of fluorochromes.  Several uniquely colored fluorochromes are available to conduct such multicolor (multiparameter) experiments.
  • 16.
    Compensation  When thewavelengths of two fluorochromes overlap, the observed fluorescent signal detected by the flow cytometer may not be the actual signal displayed by the cell.  In other words, the cell appears to possess a surface marker or phenotype that it does not actually have.
  • 17.
    Gating  To optimizethe analysis of multiparameter experiments, gating is performed to isolate cell subpopulations of interest.  This step often eliminates p the need to physically sort cells for further analysis
  • 18.
    Data Analysis  Flowcytometry is utilized both in the clinical lab and the research lab.  Standardization has resulted in data that is reproducible across laboratories reproducible  Accurate data representation is key to this reproducibility.  This is a 2D dotplota dot plot; a commonly used method of data representation.
  • 19.
    Applications -Clinical  CD4+T cell counts are used to monitor the it progression of AIDS in HIV-infected patients
  • 20.
    Applications -Research  Akinetics assay, such as Ca2+mobilization, can be performed using a fluorochrome, that binds to calcium ions.  Cells are loaded with indo-1 and then stimulated to mobilize Ca2+.  The UV laser excites the indo-1 and a fluorescent pulse is observed.
  • 21.
    THANK YOU OMKAR ABADHESHMISHRA MSC ( BIOTECHNOLOGY)