Downloaded 2,215 times

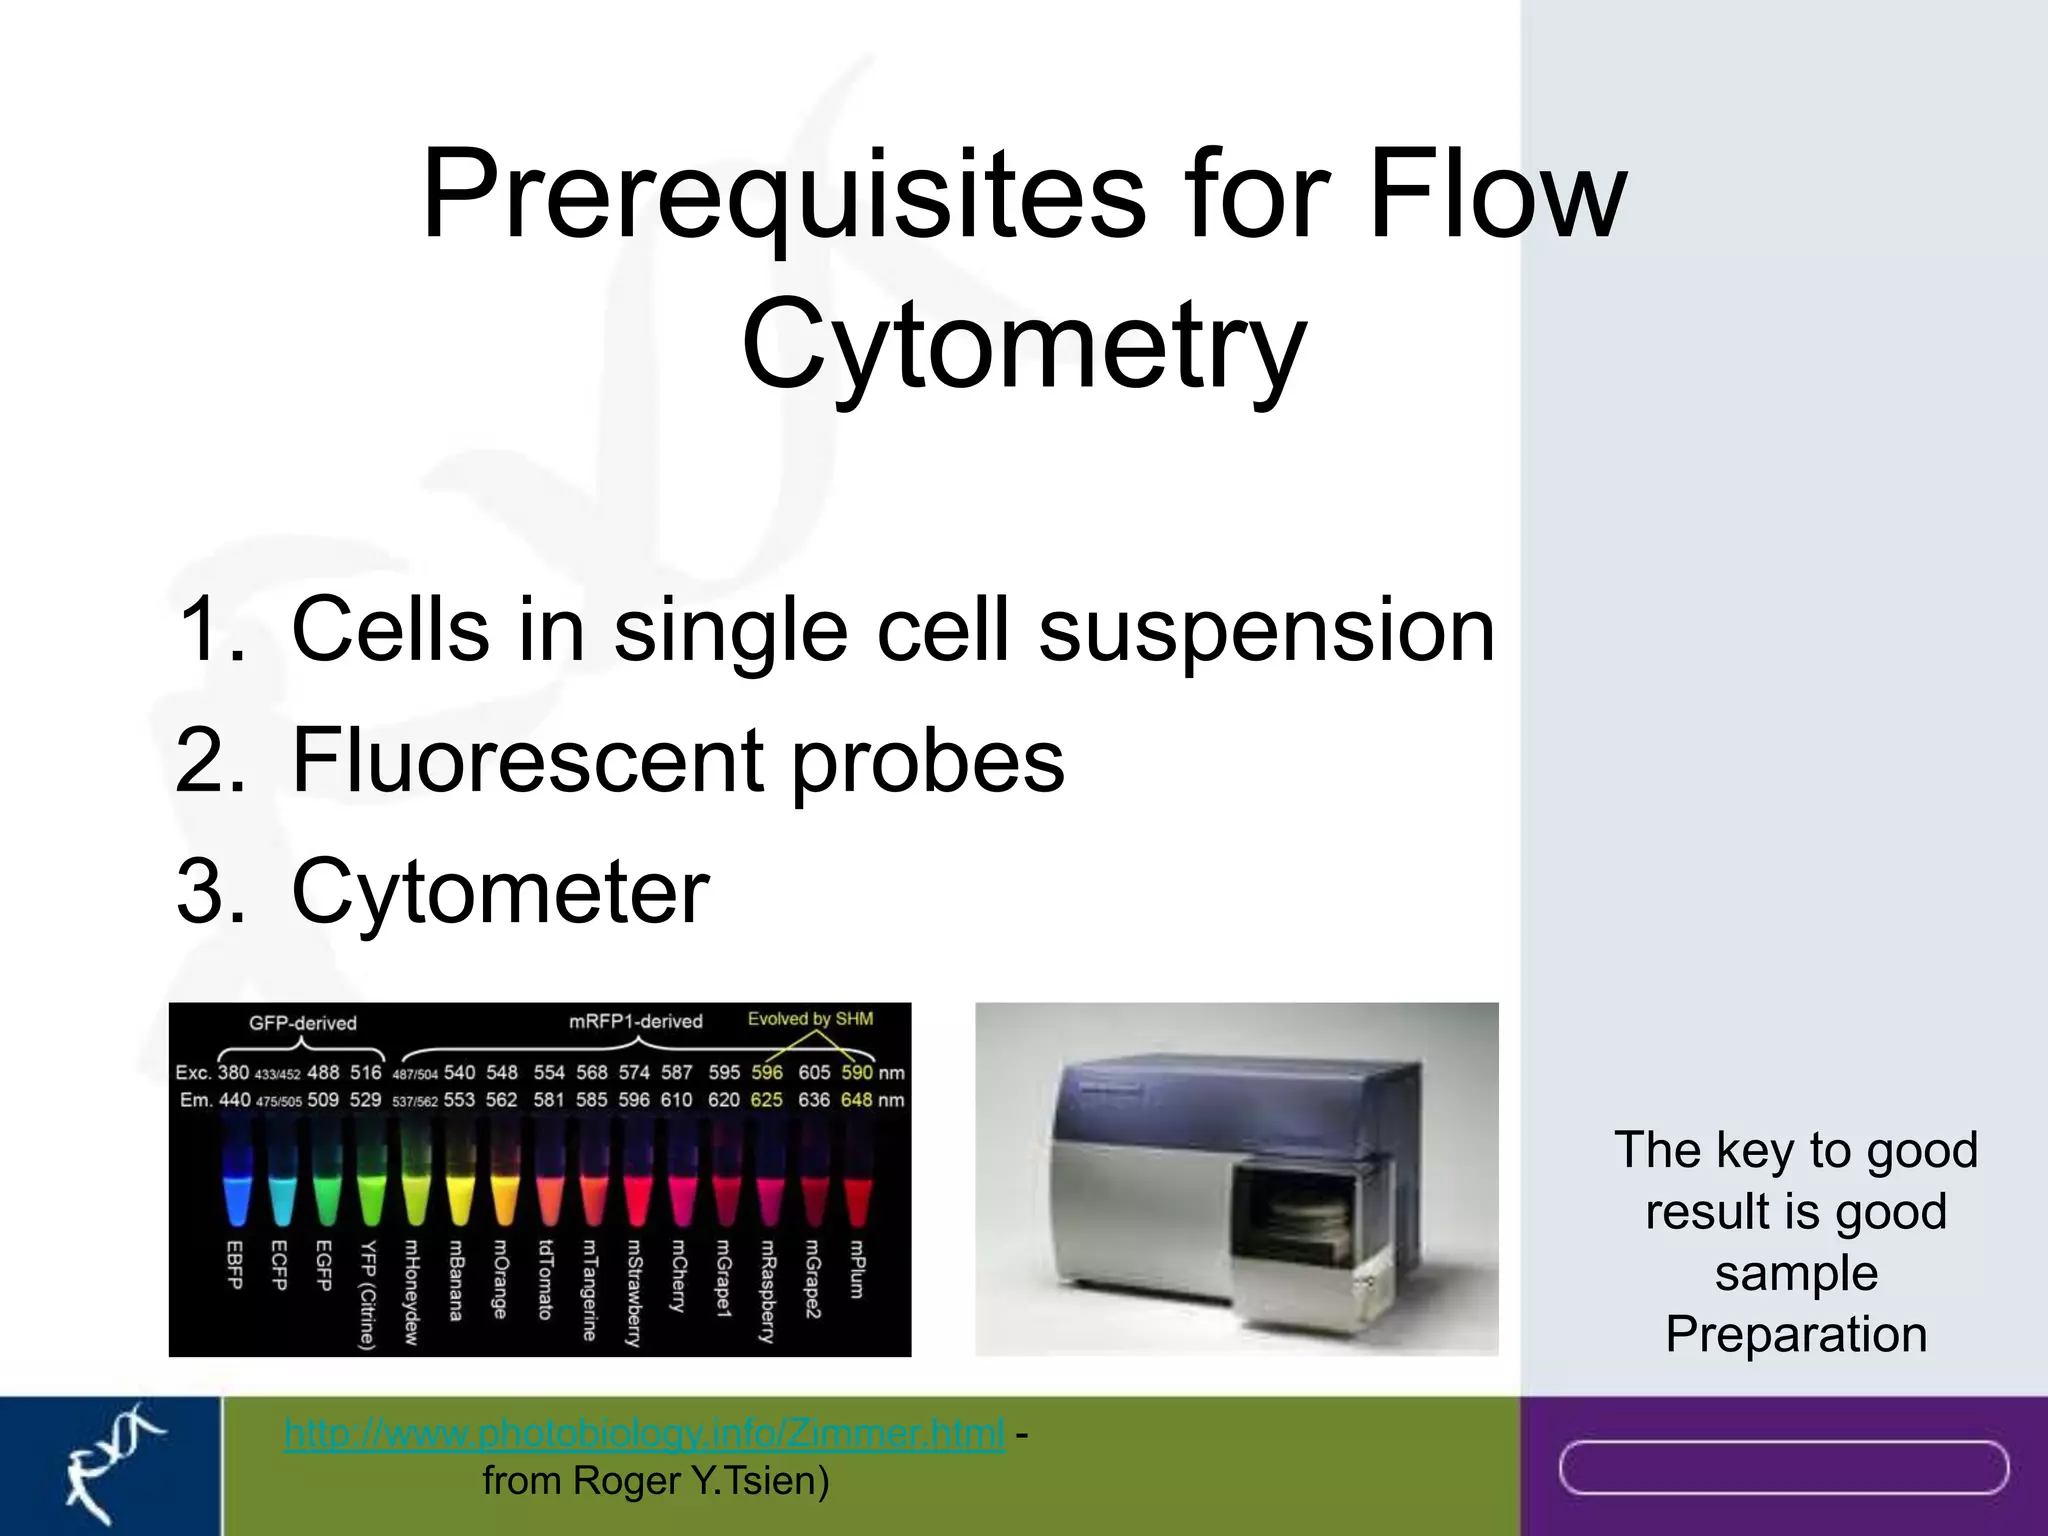
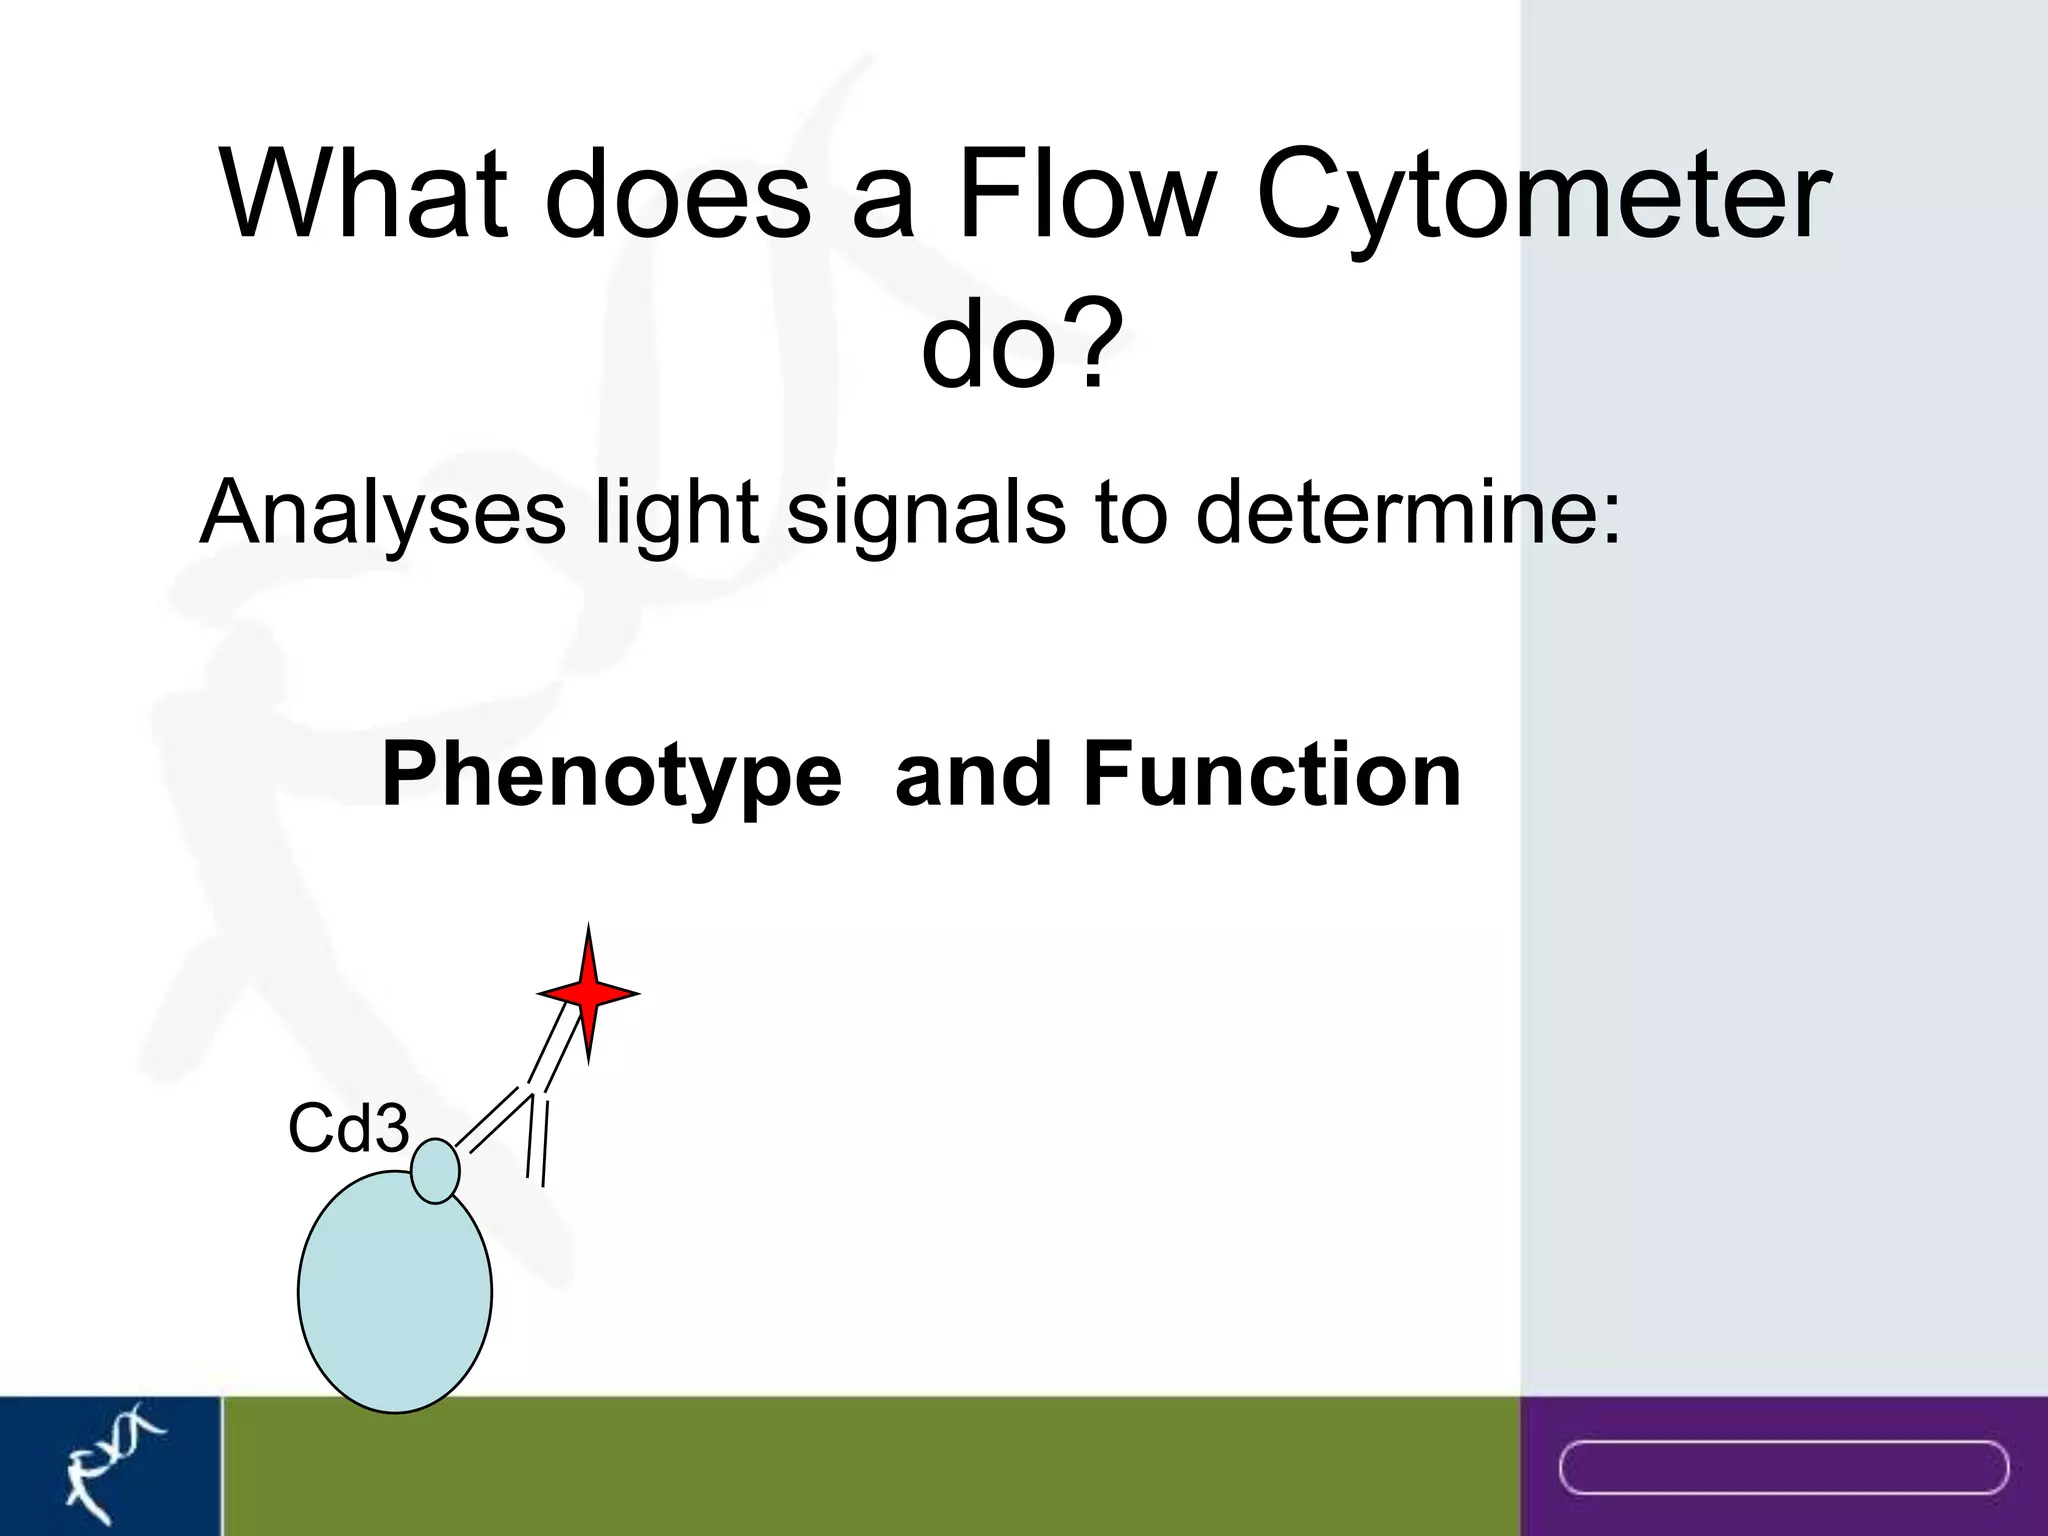
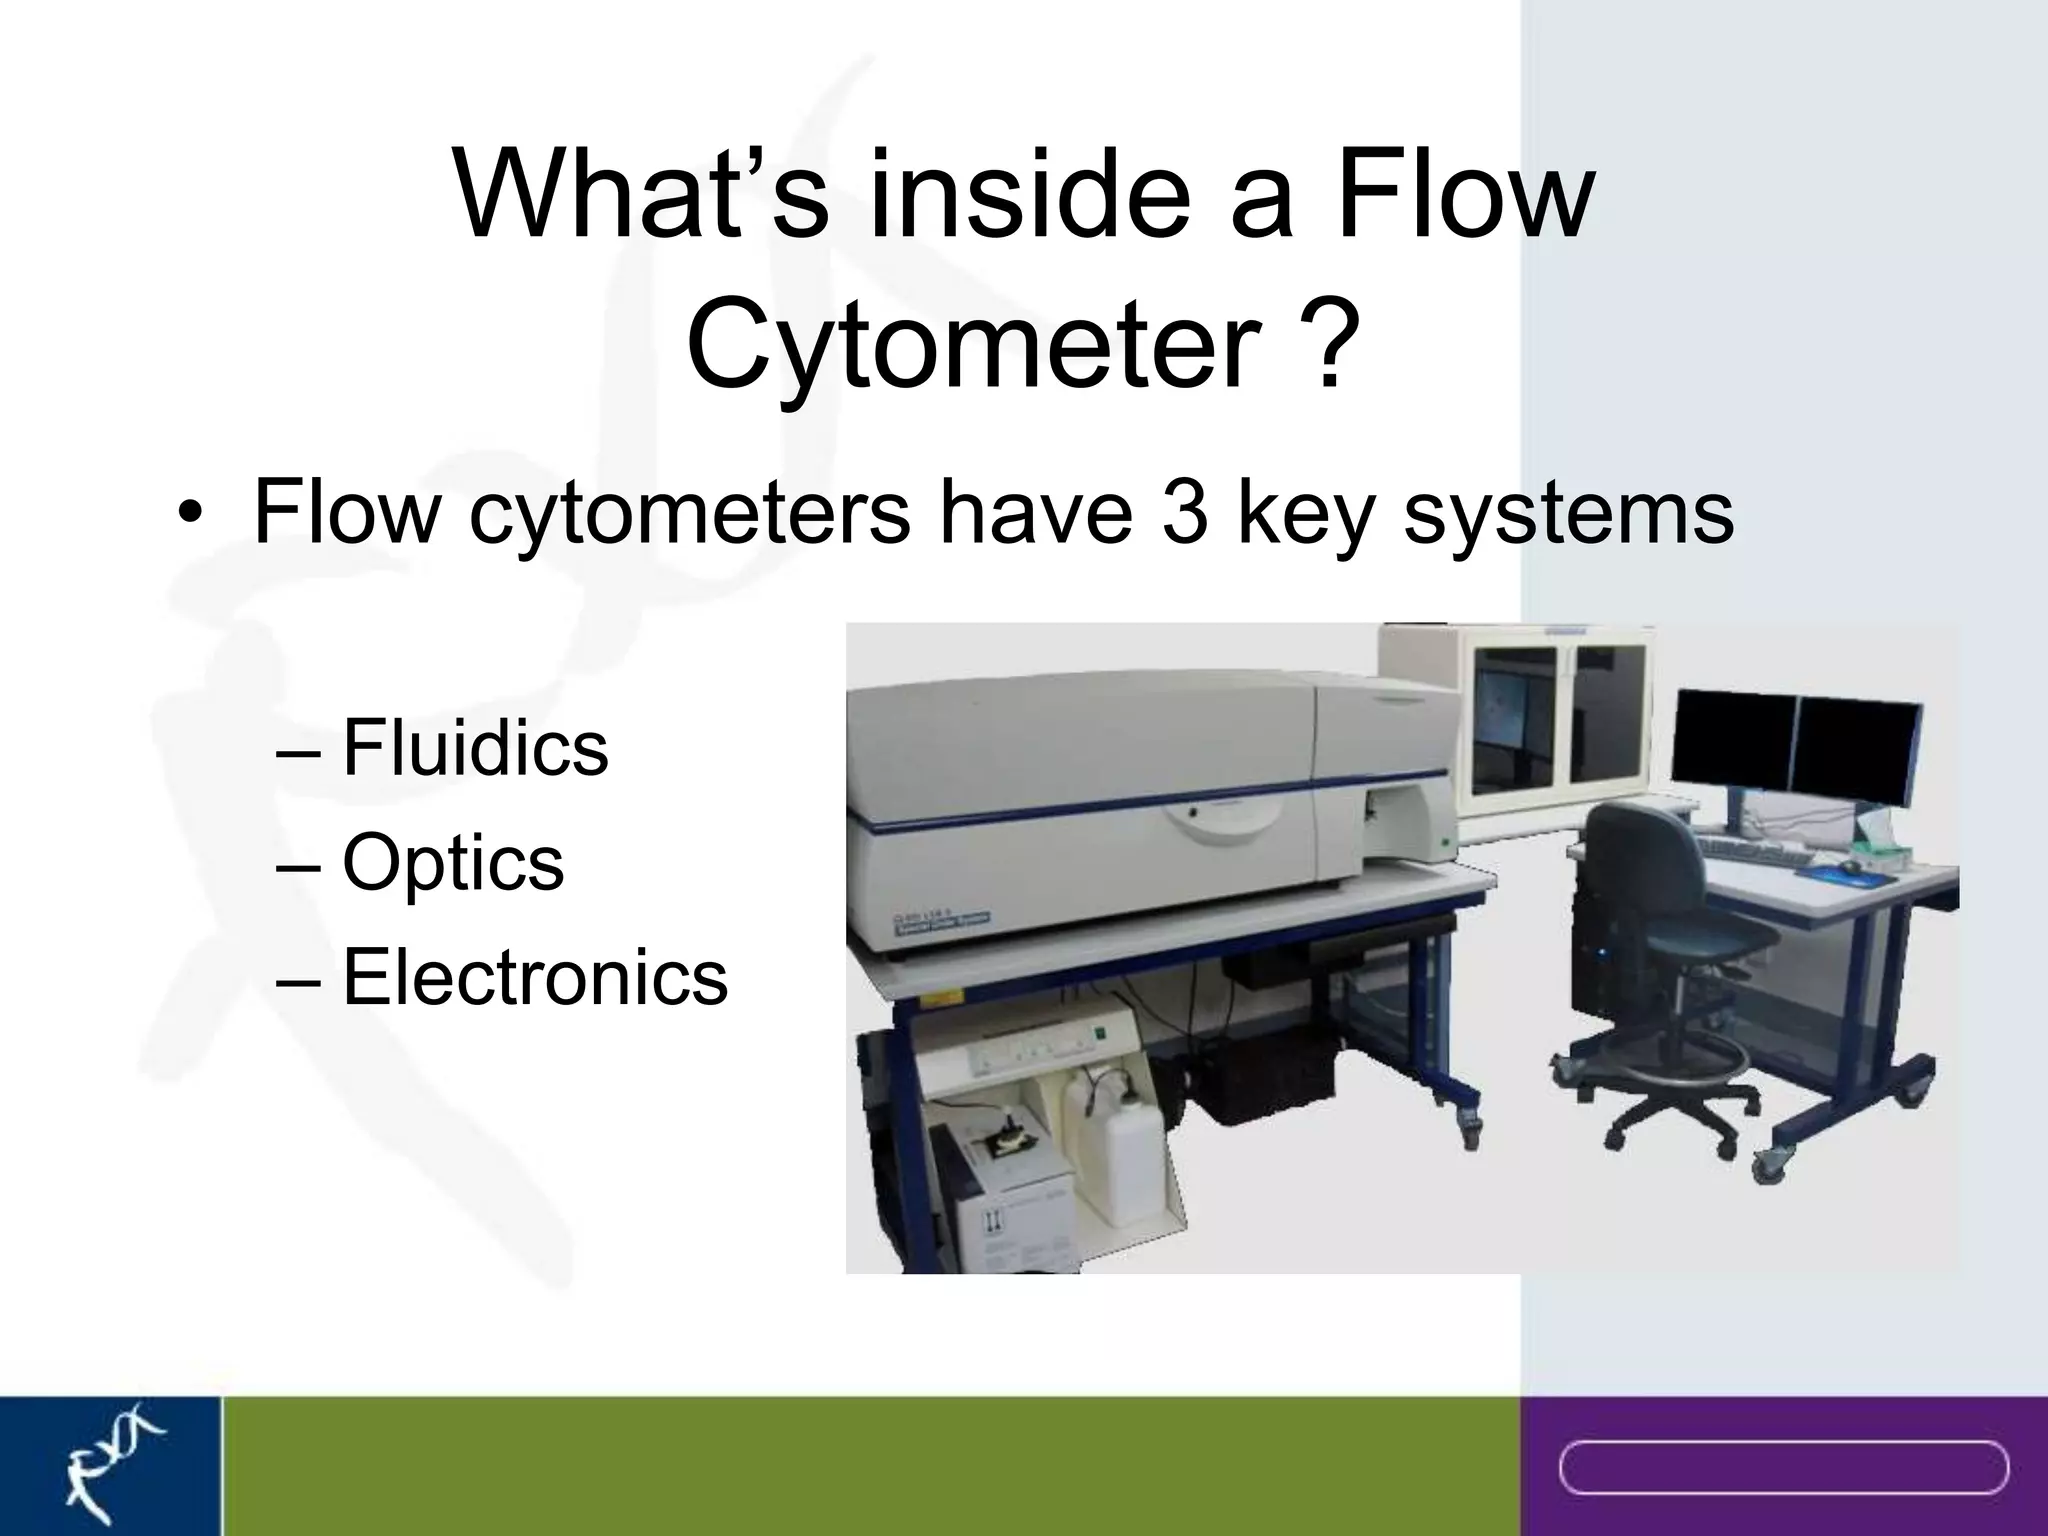
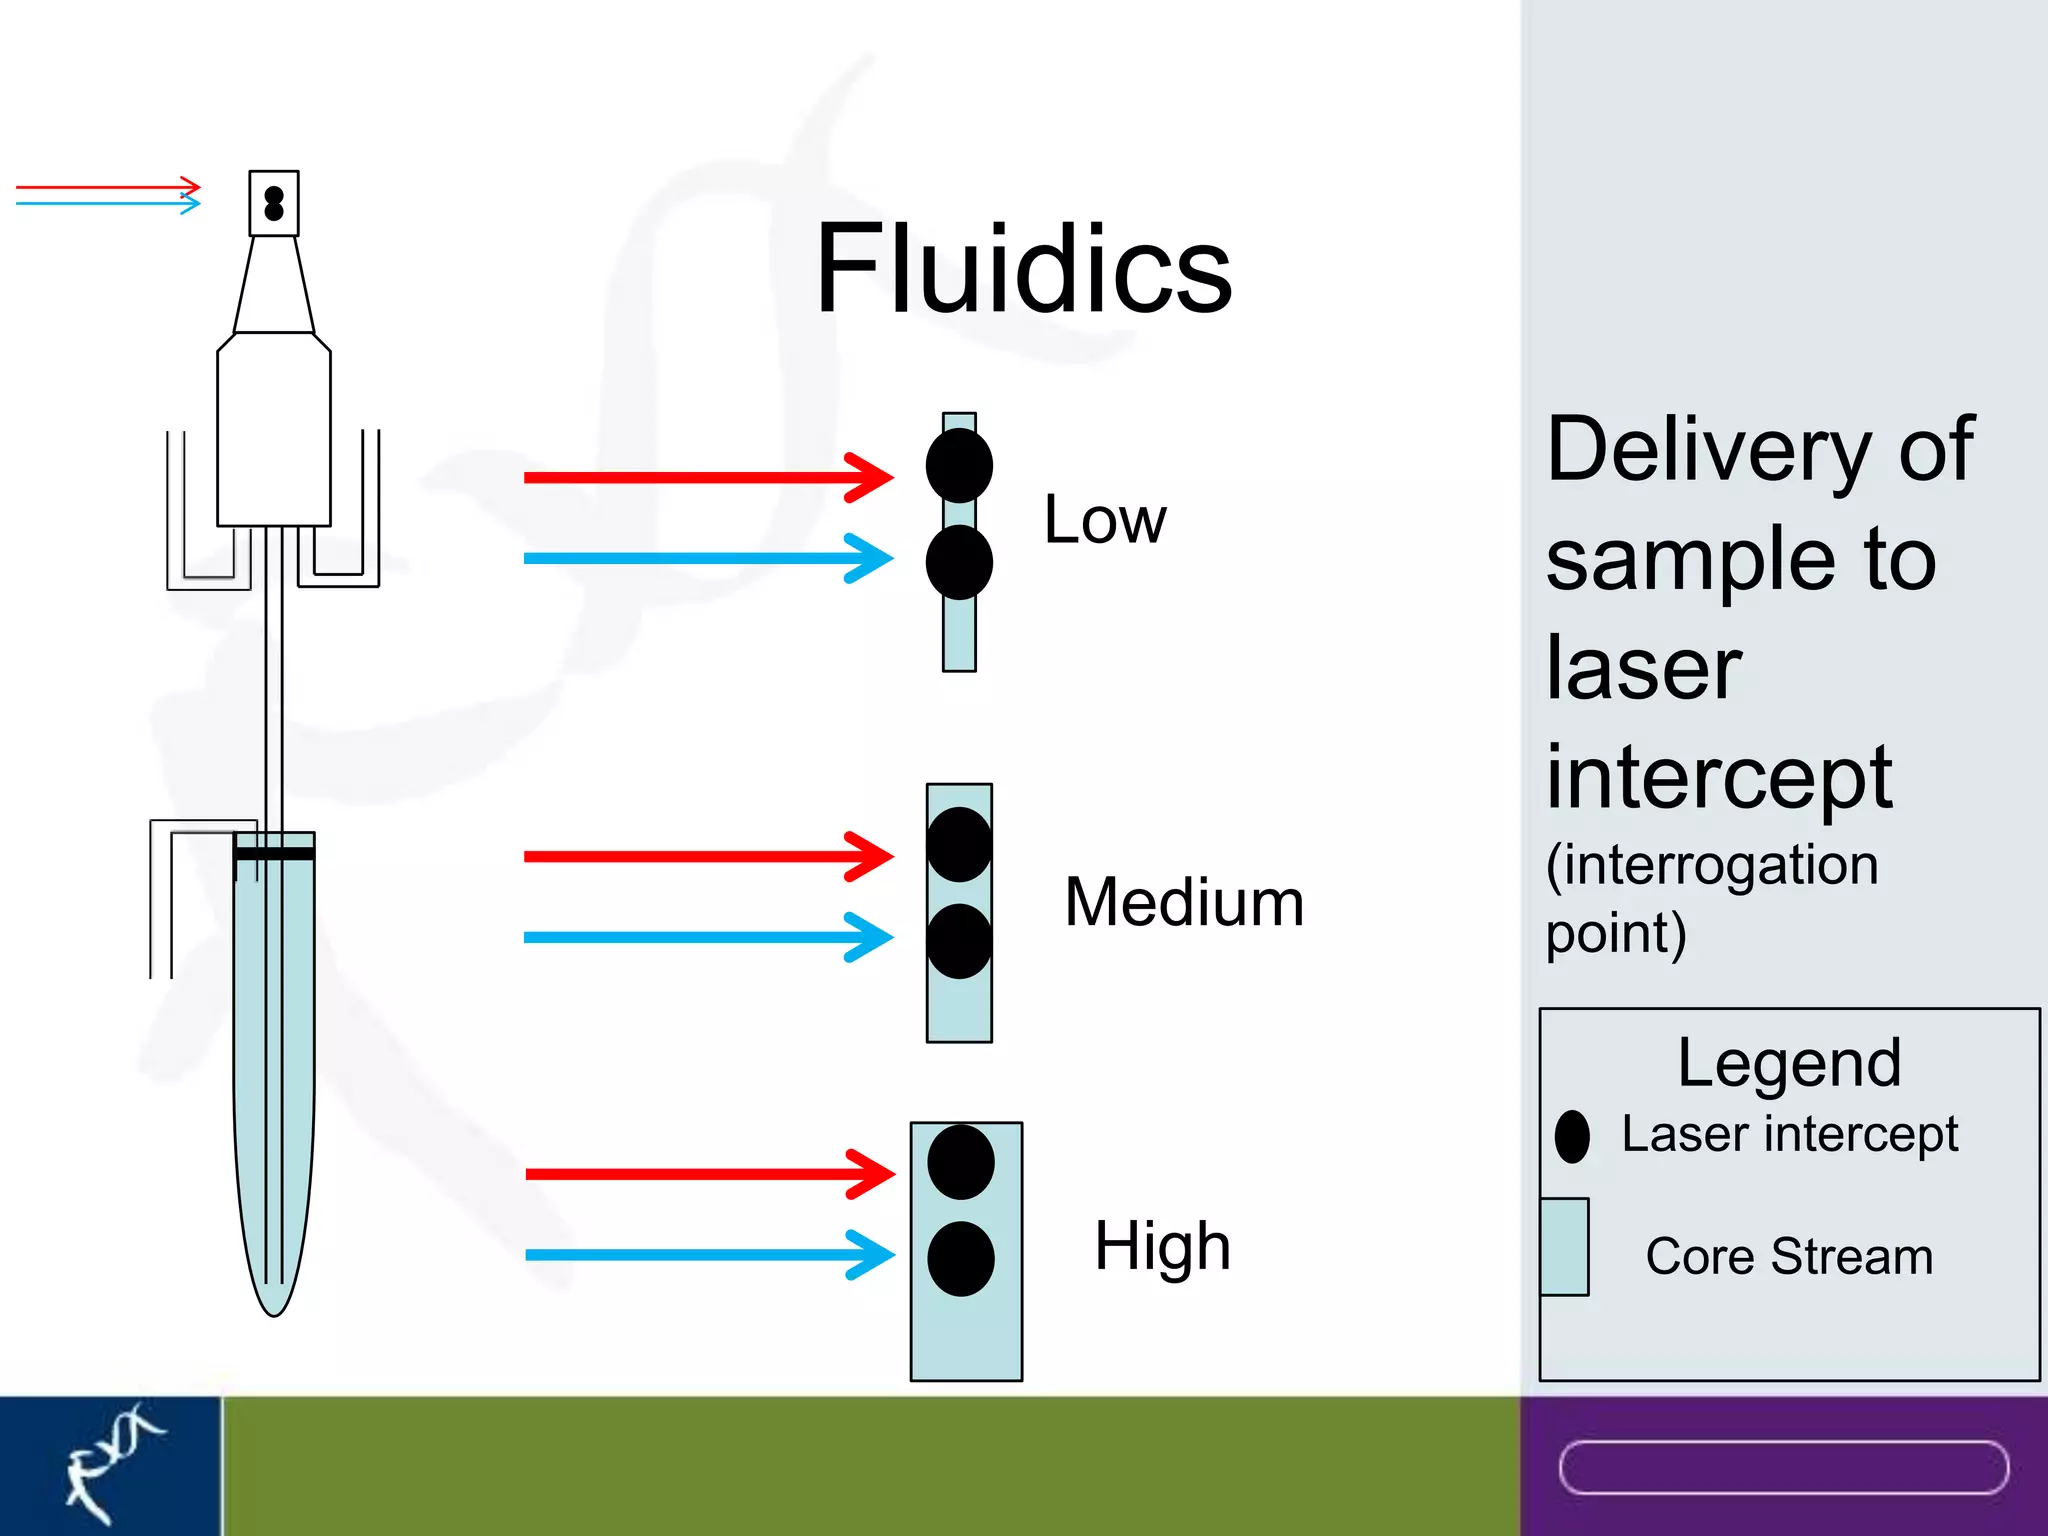
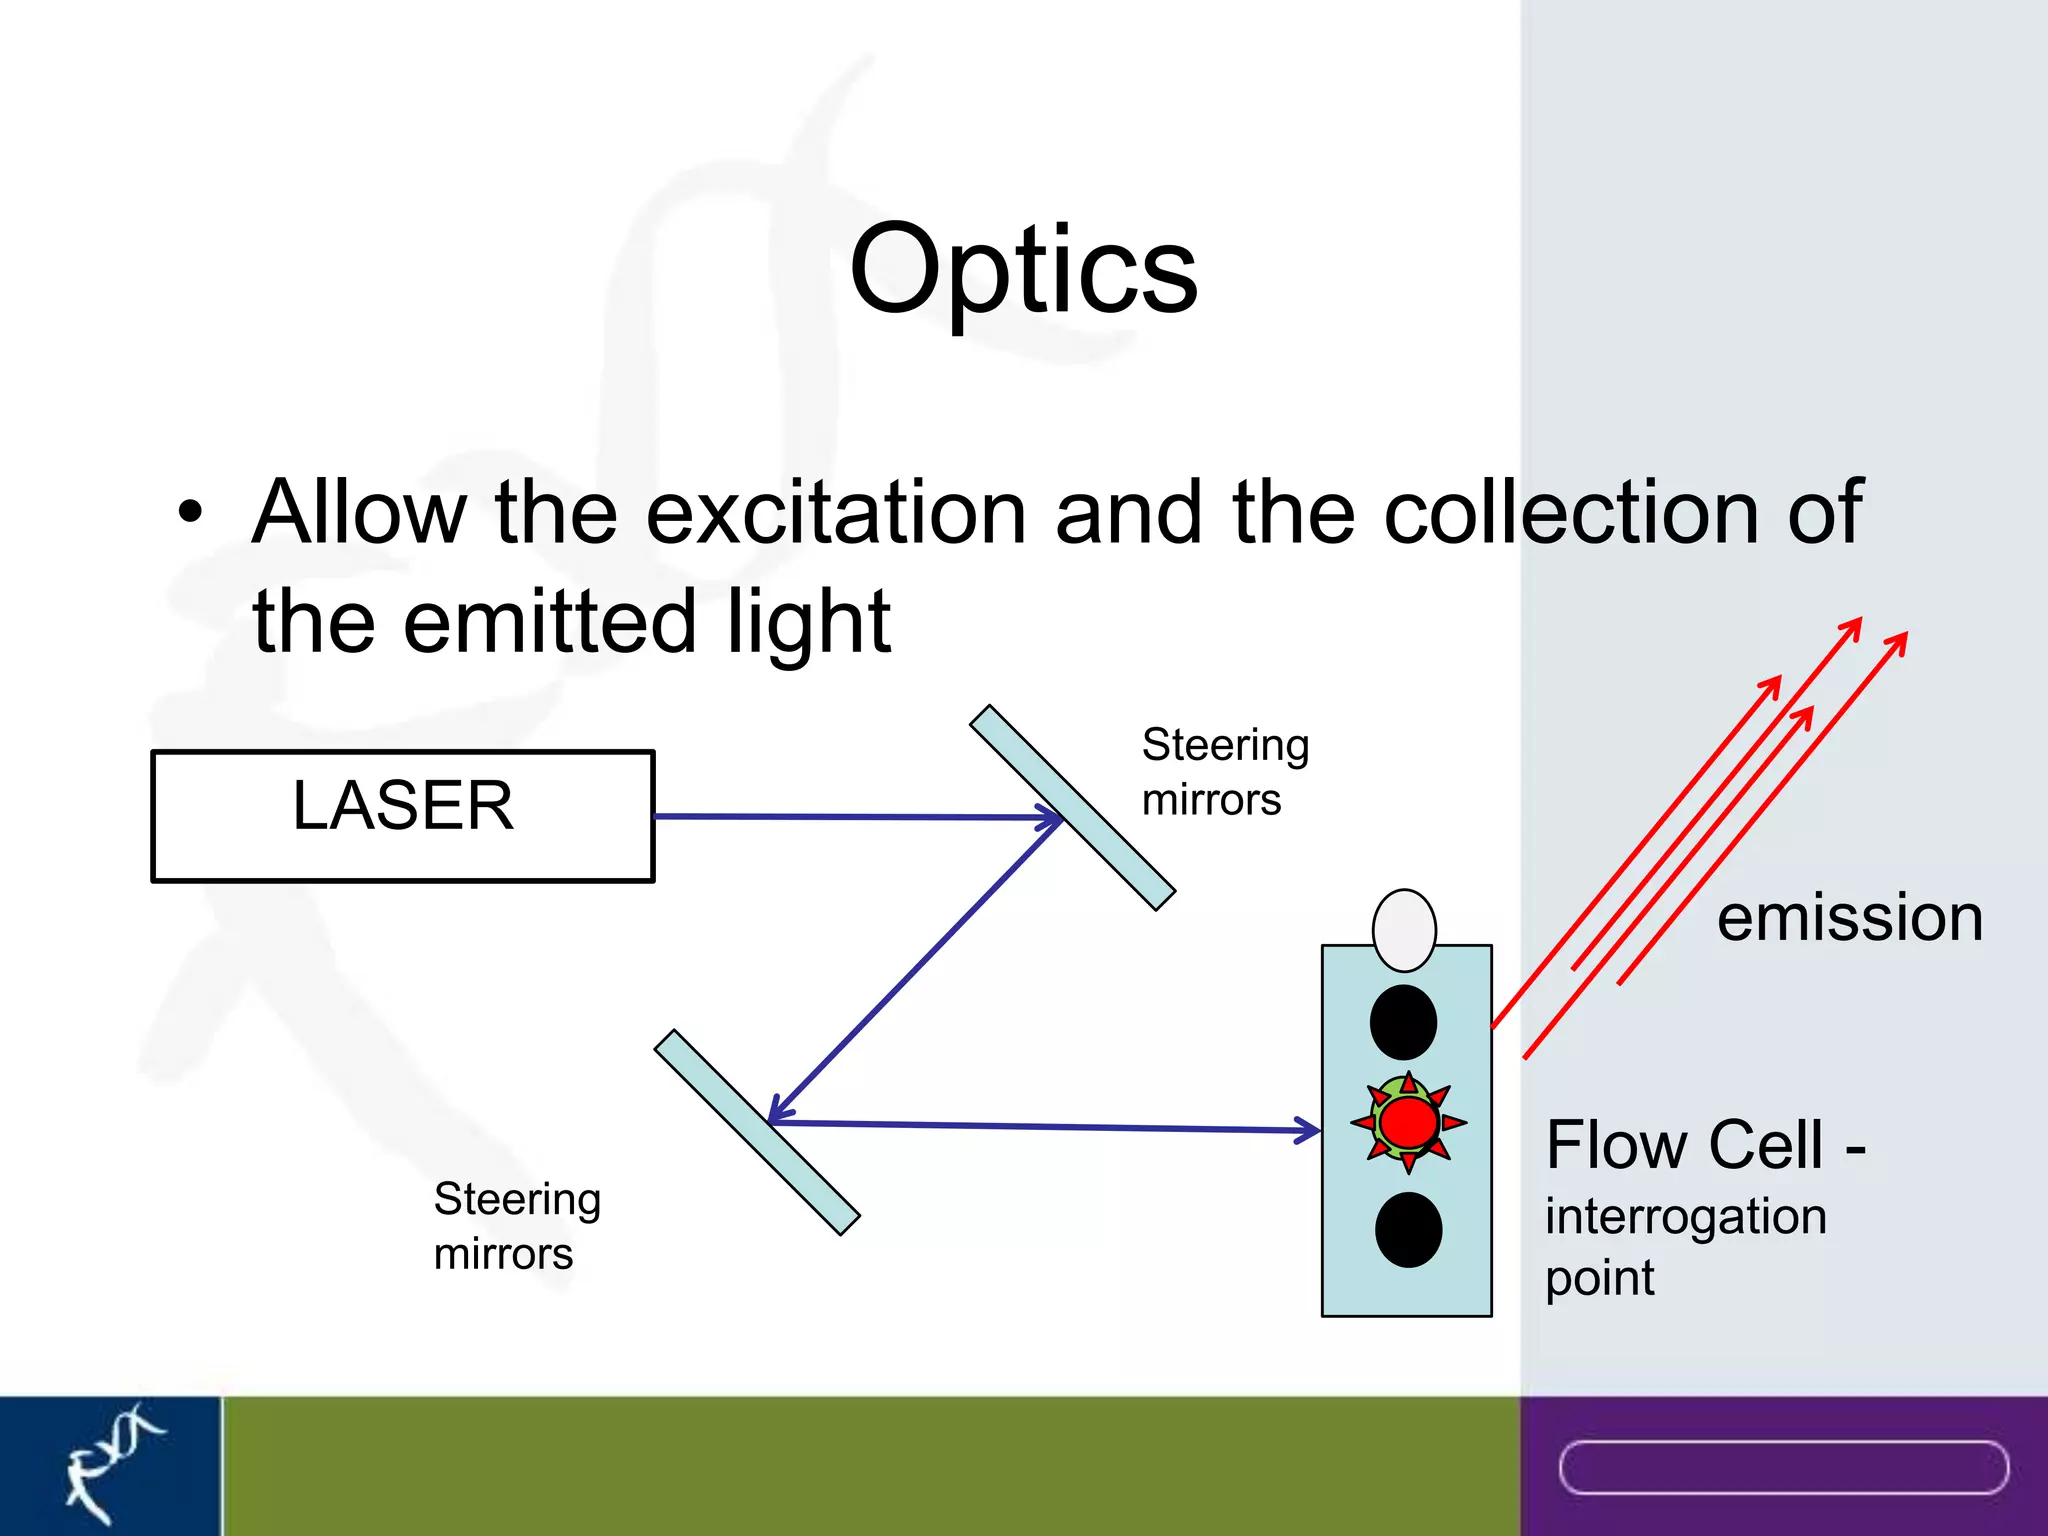
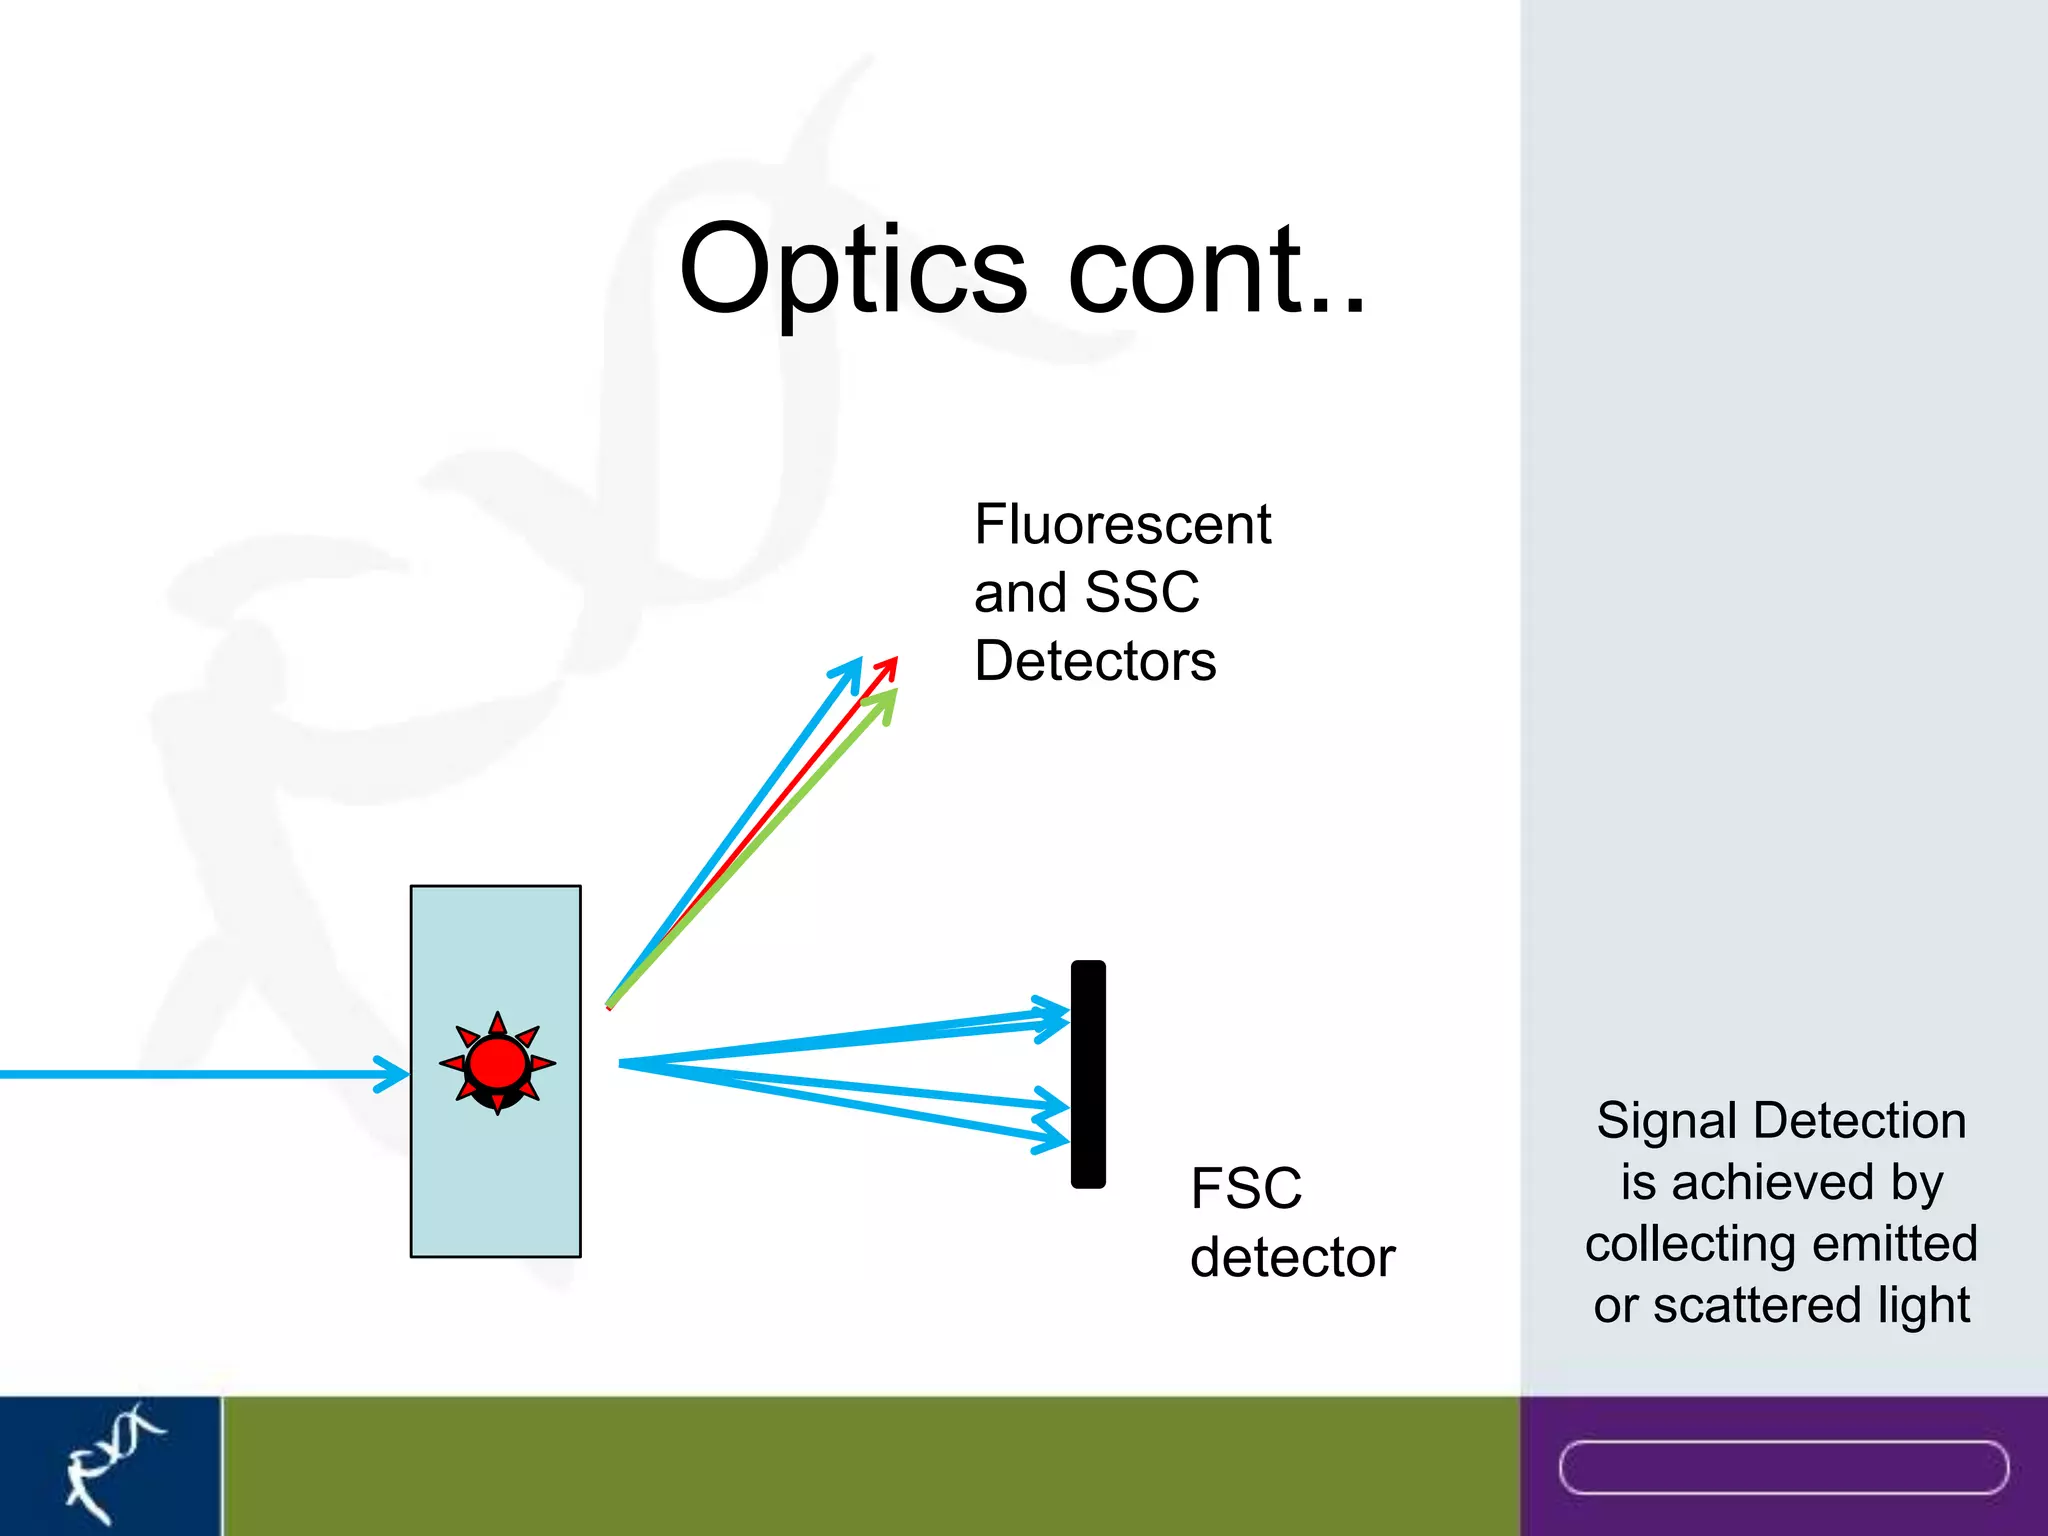
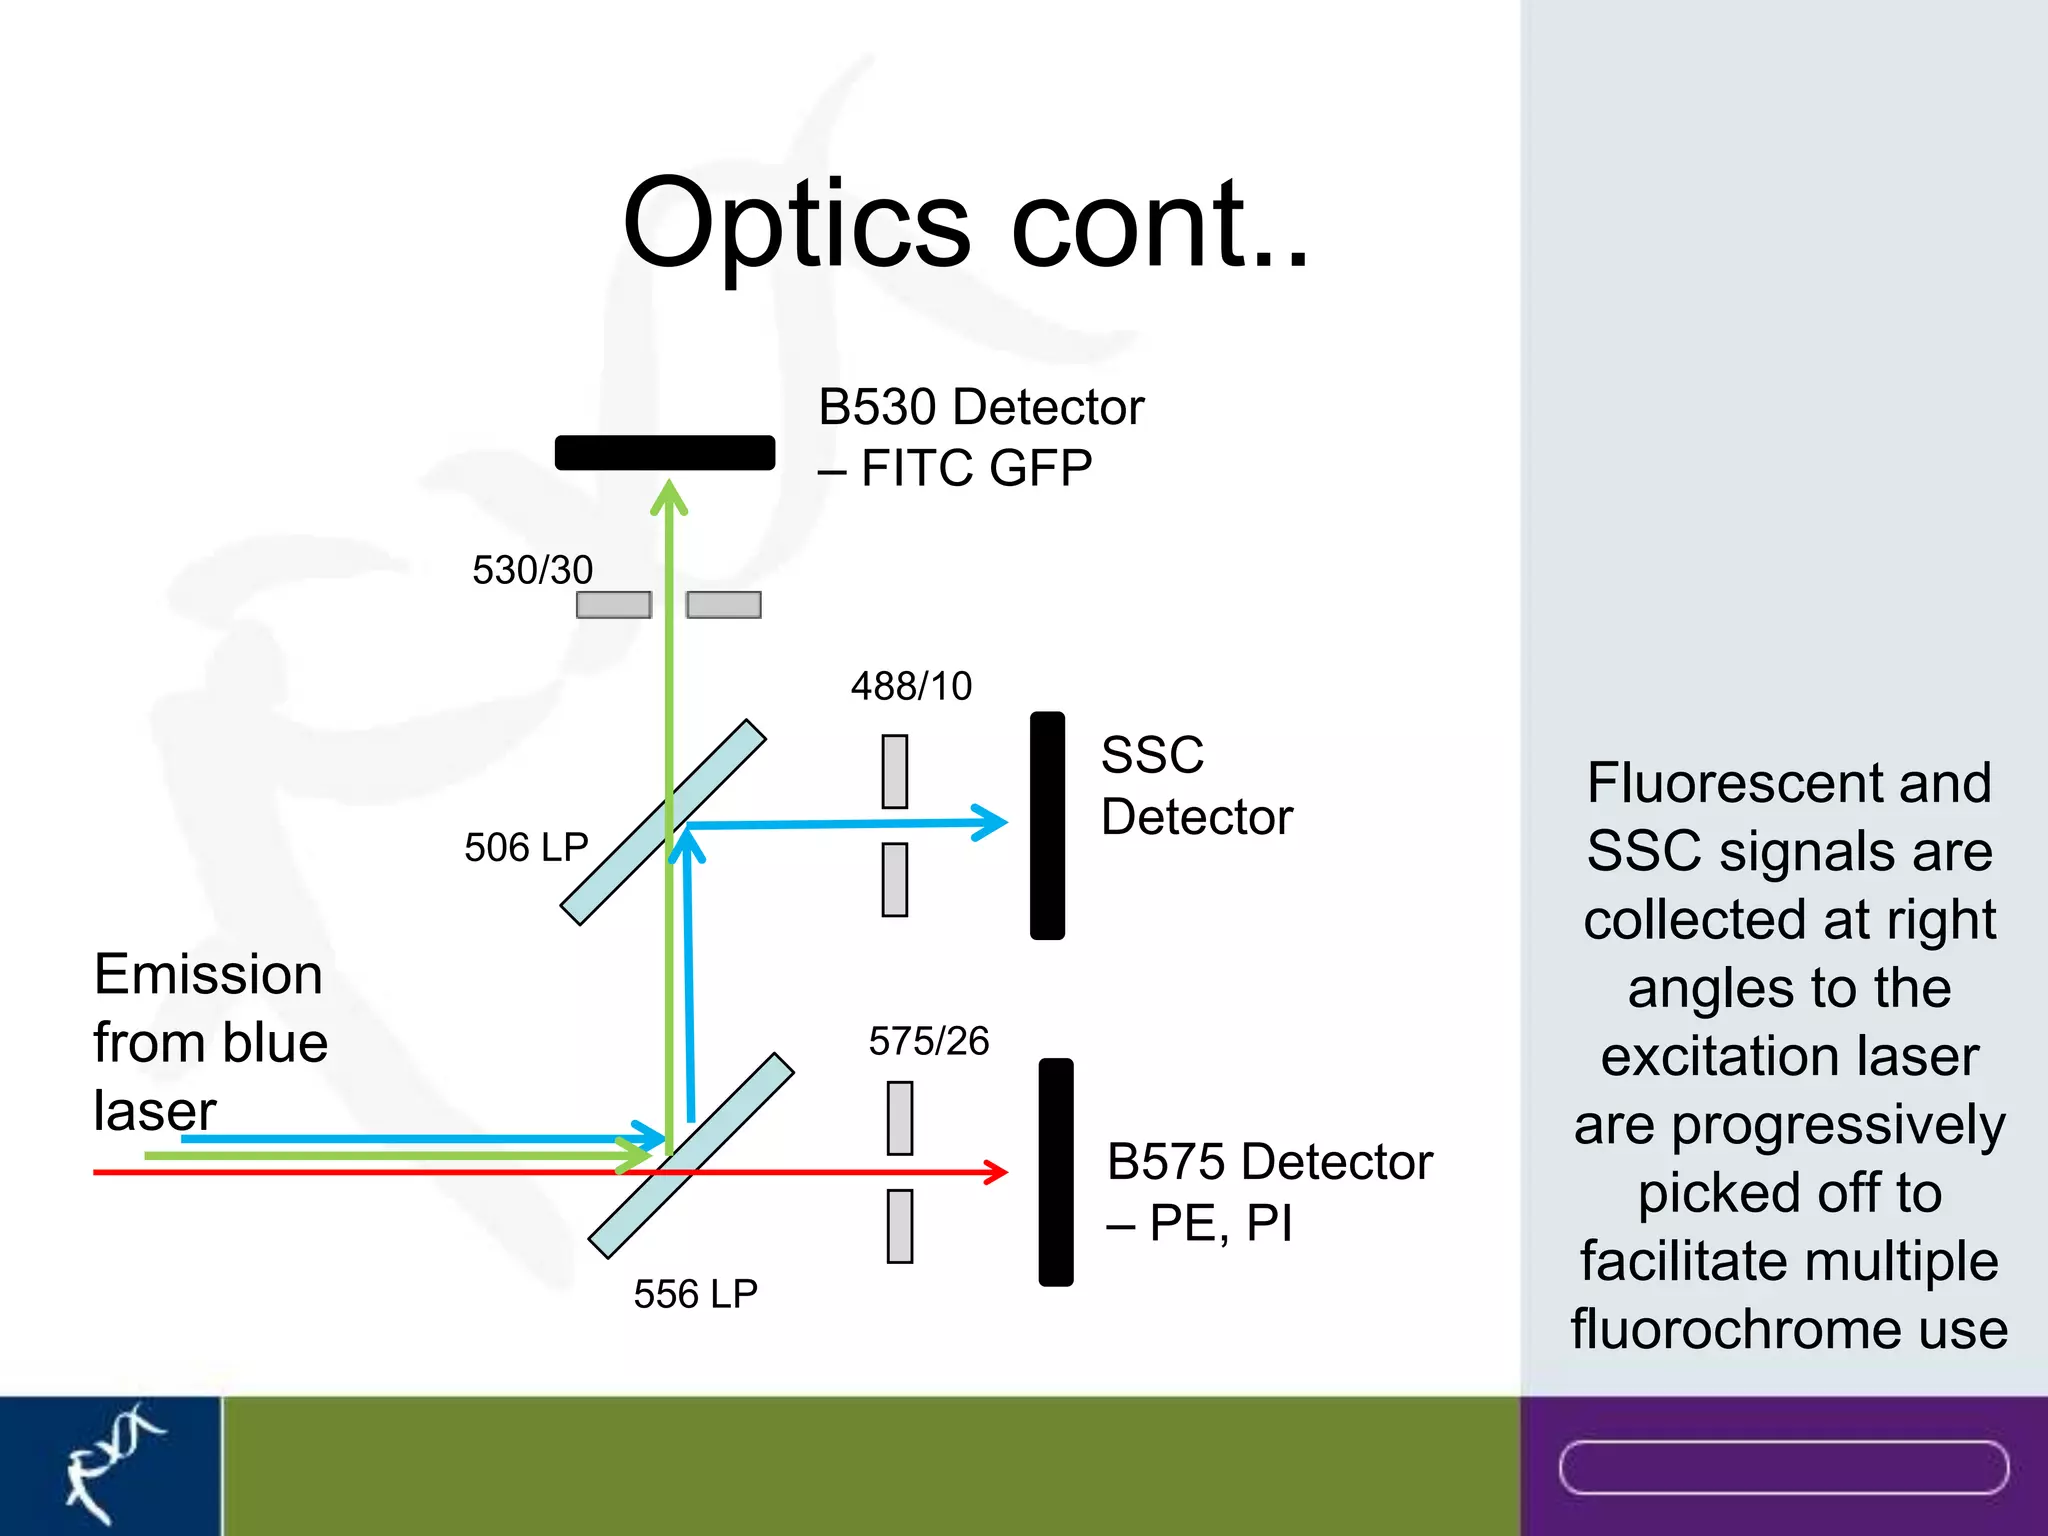
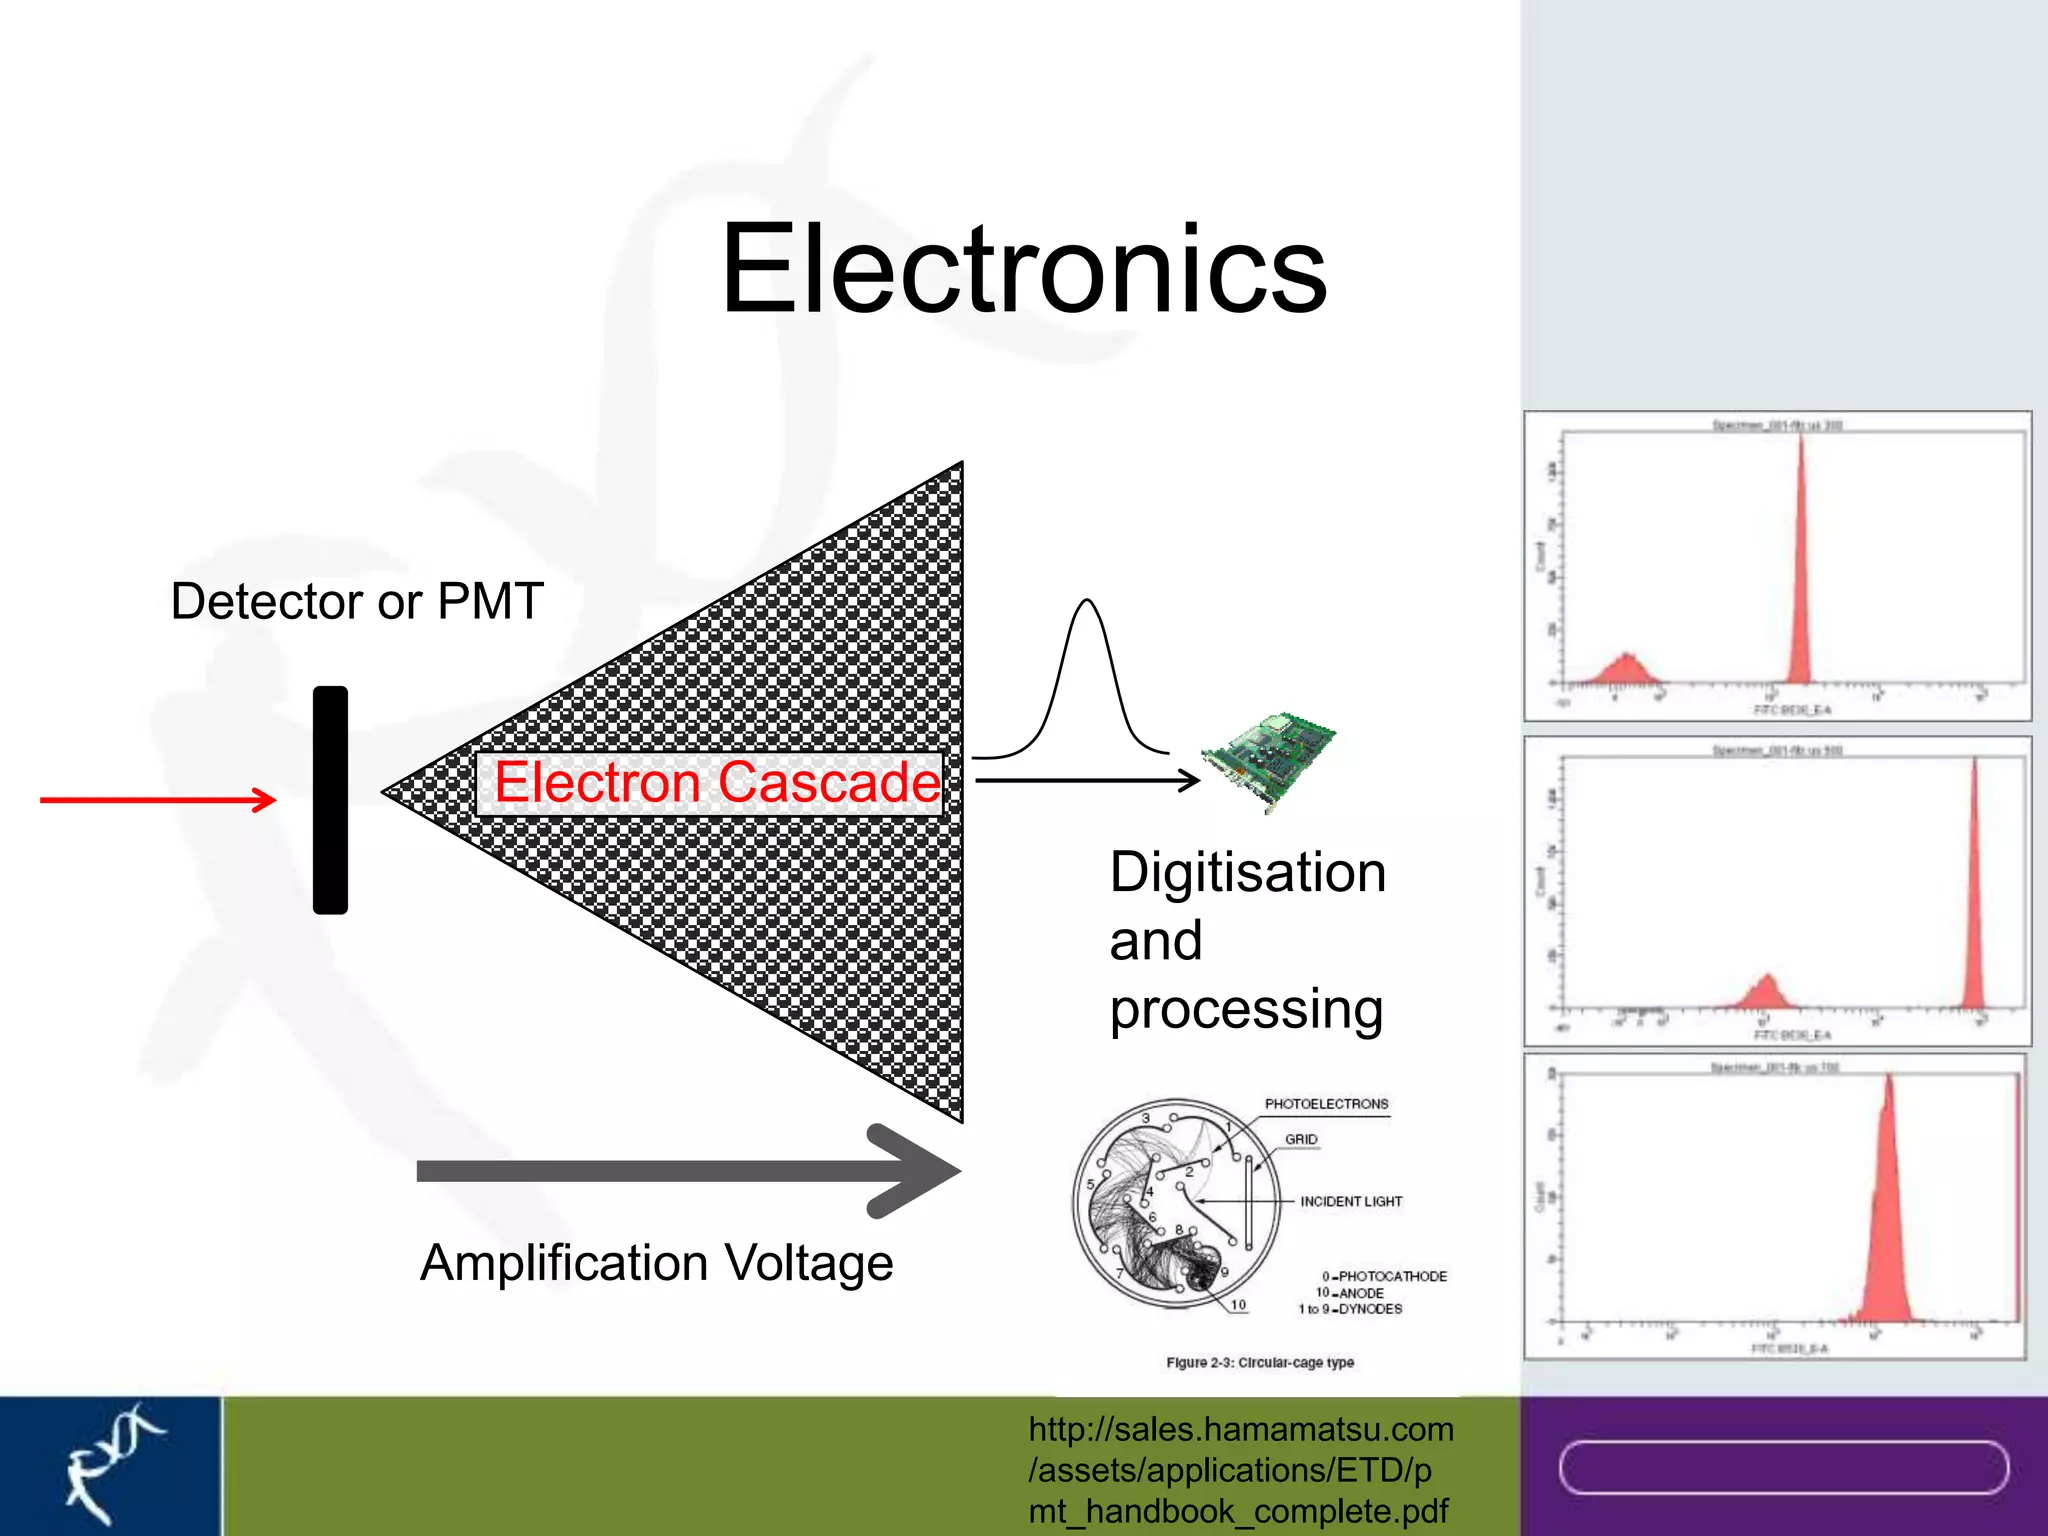
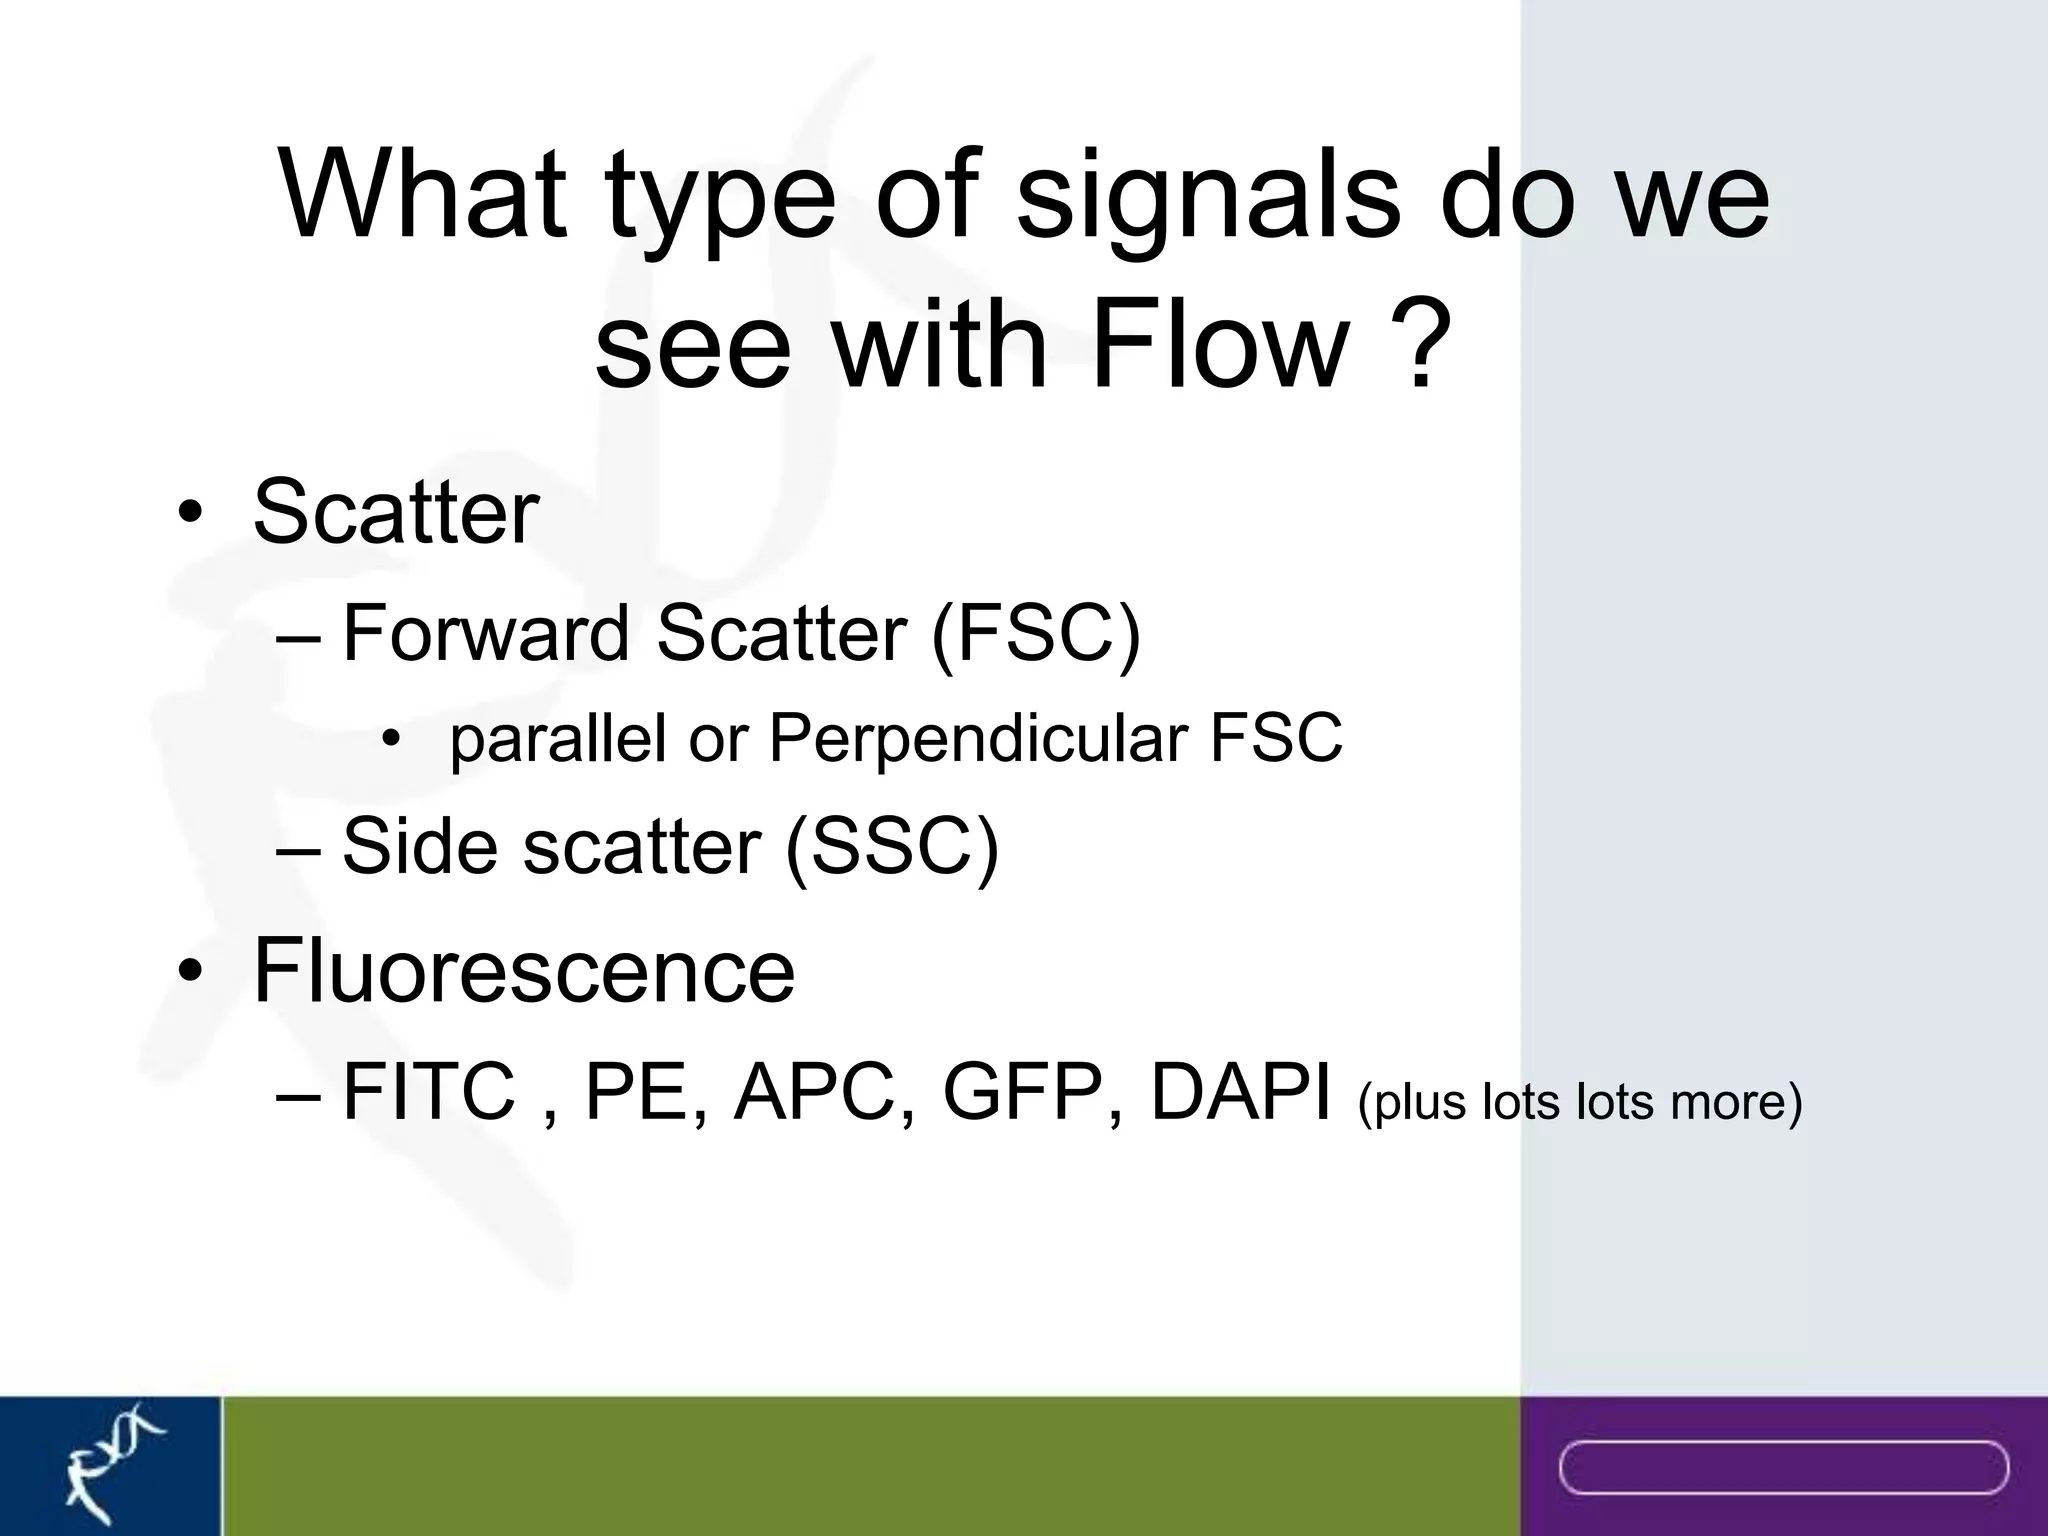
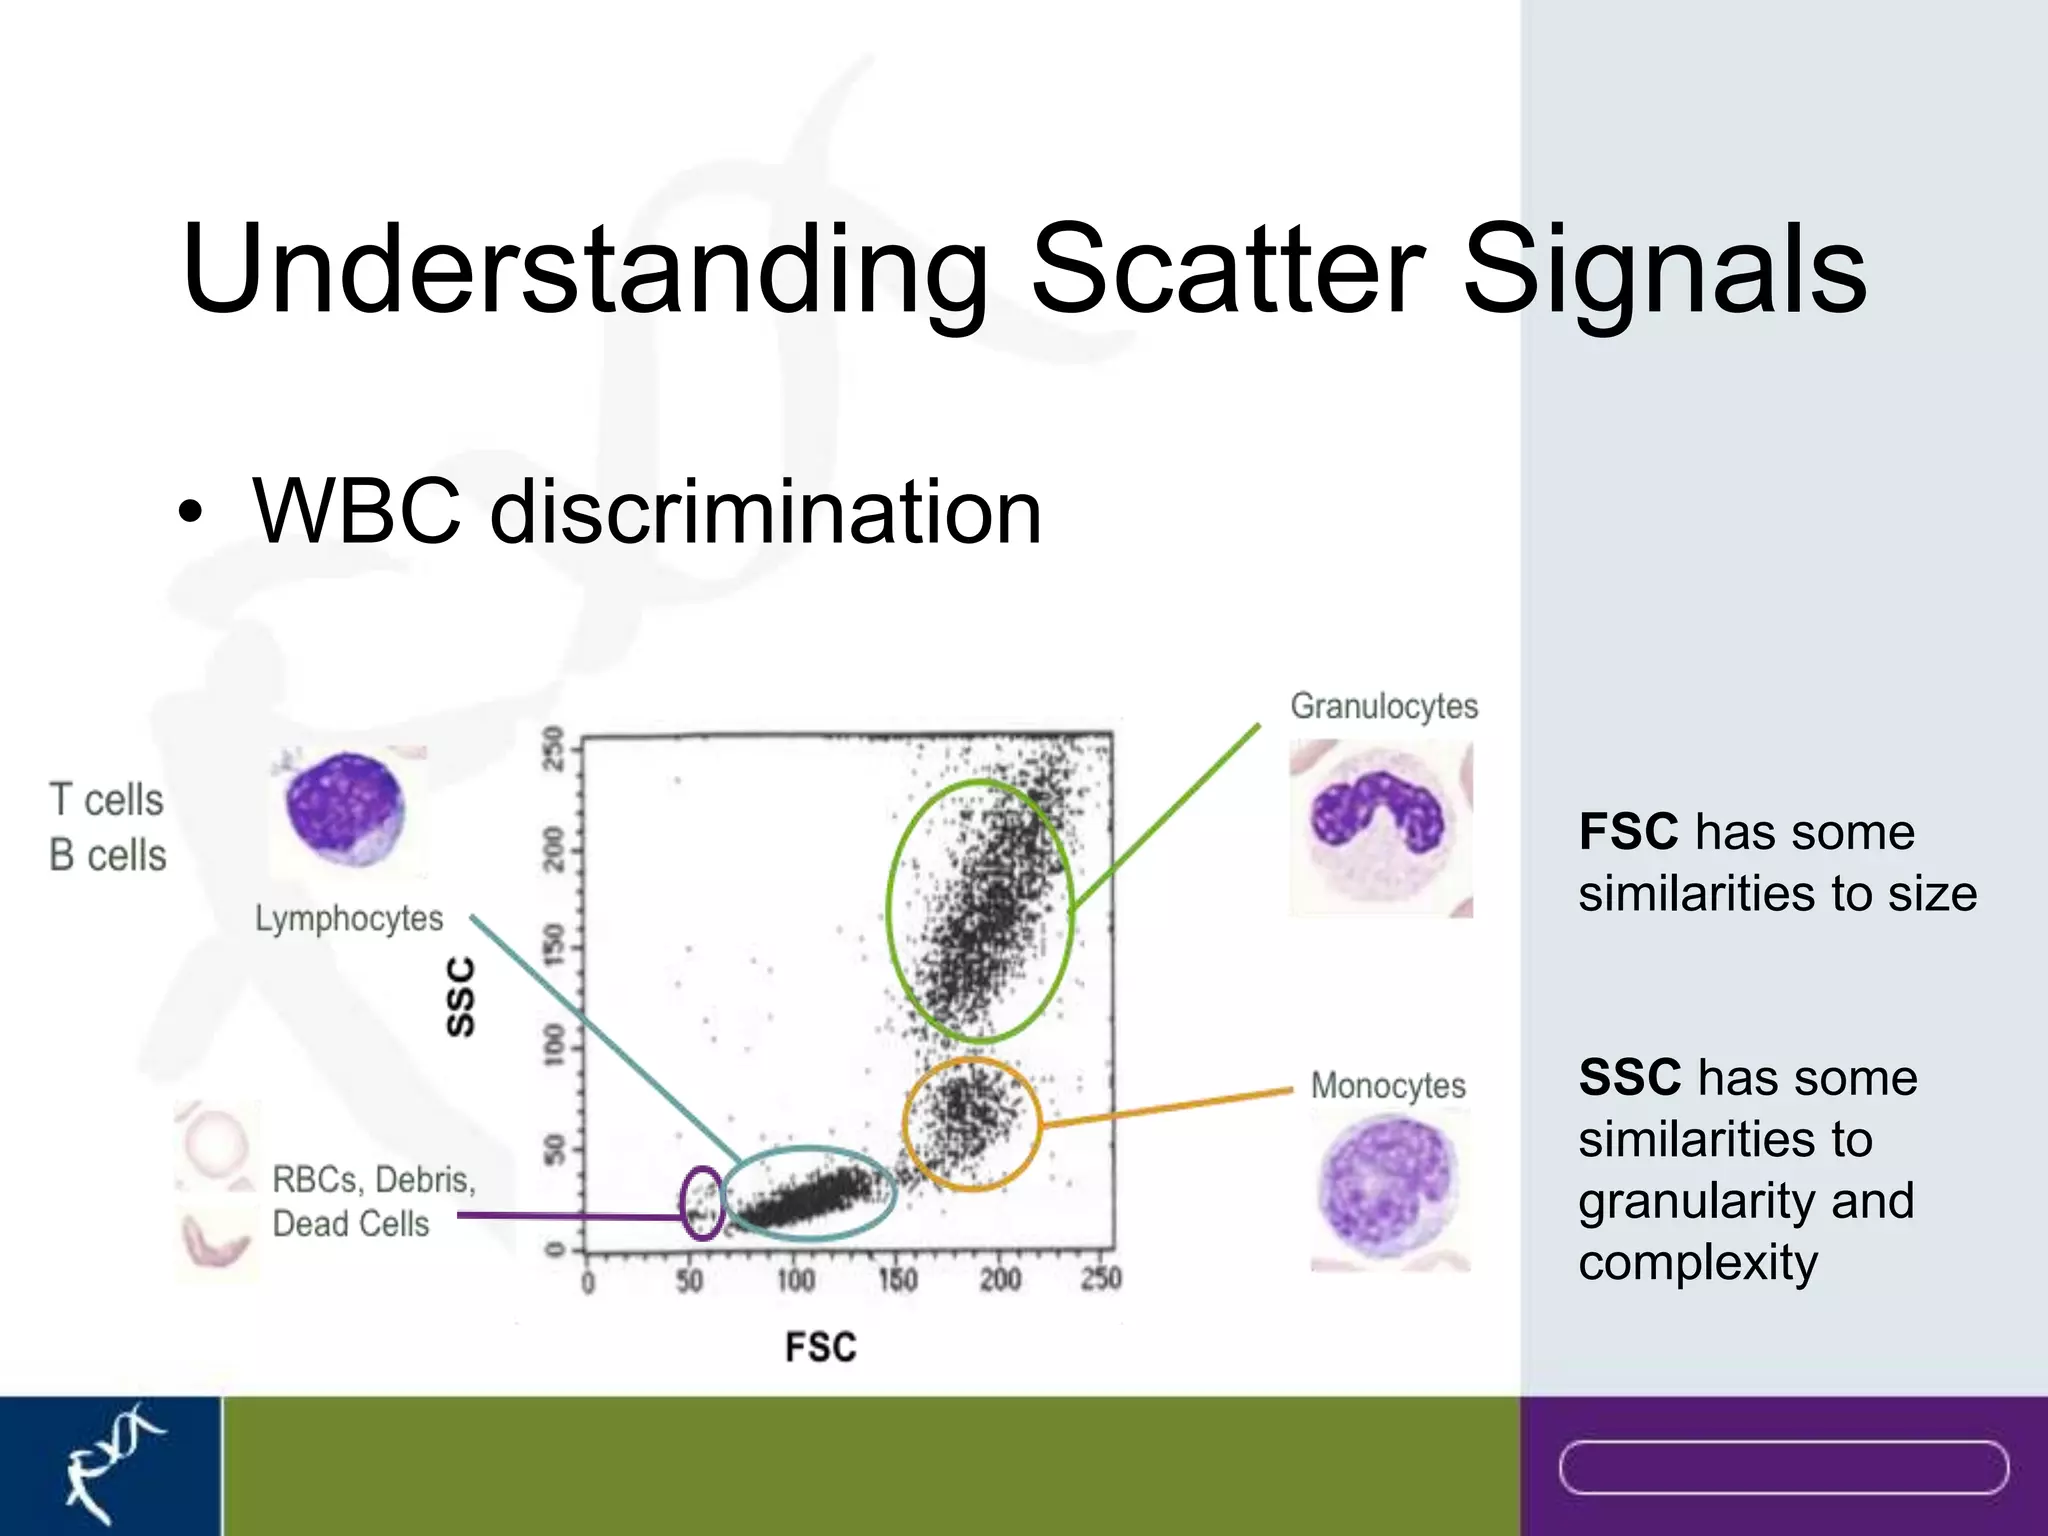


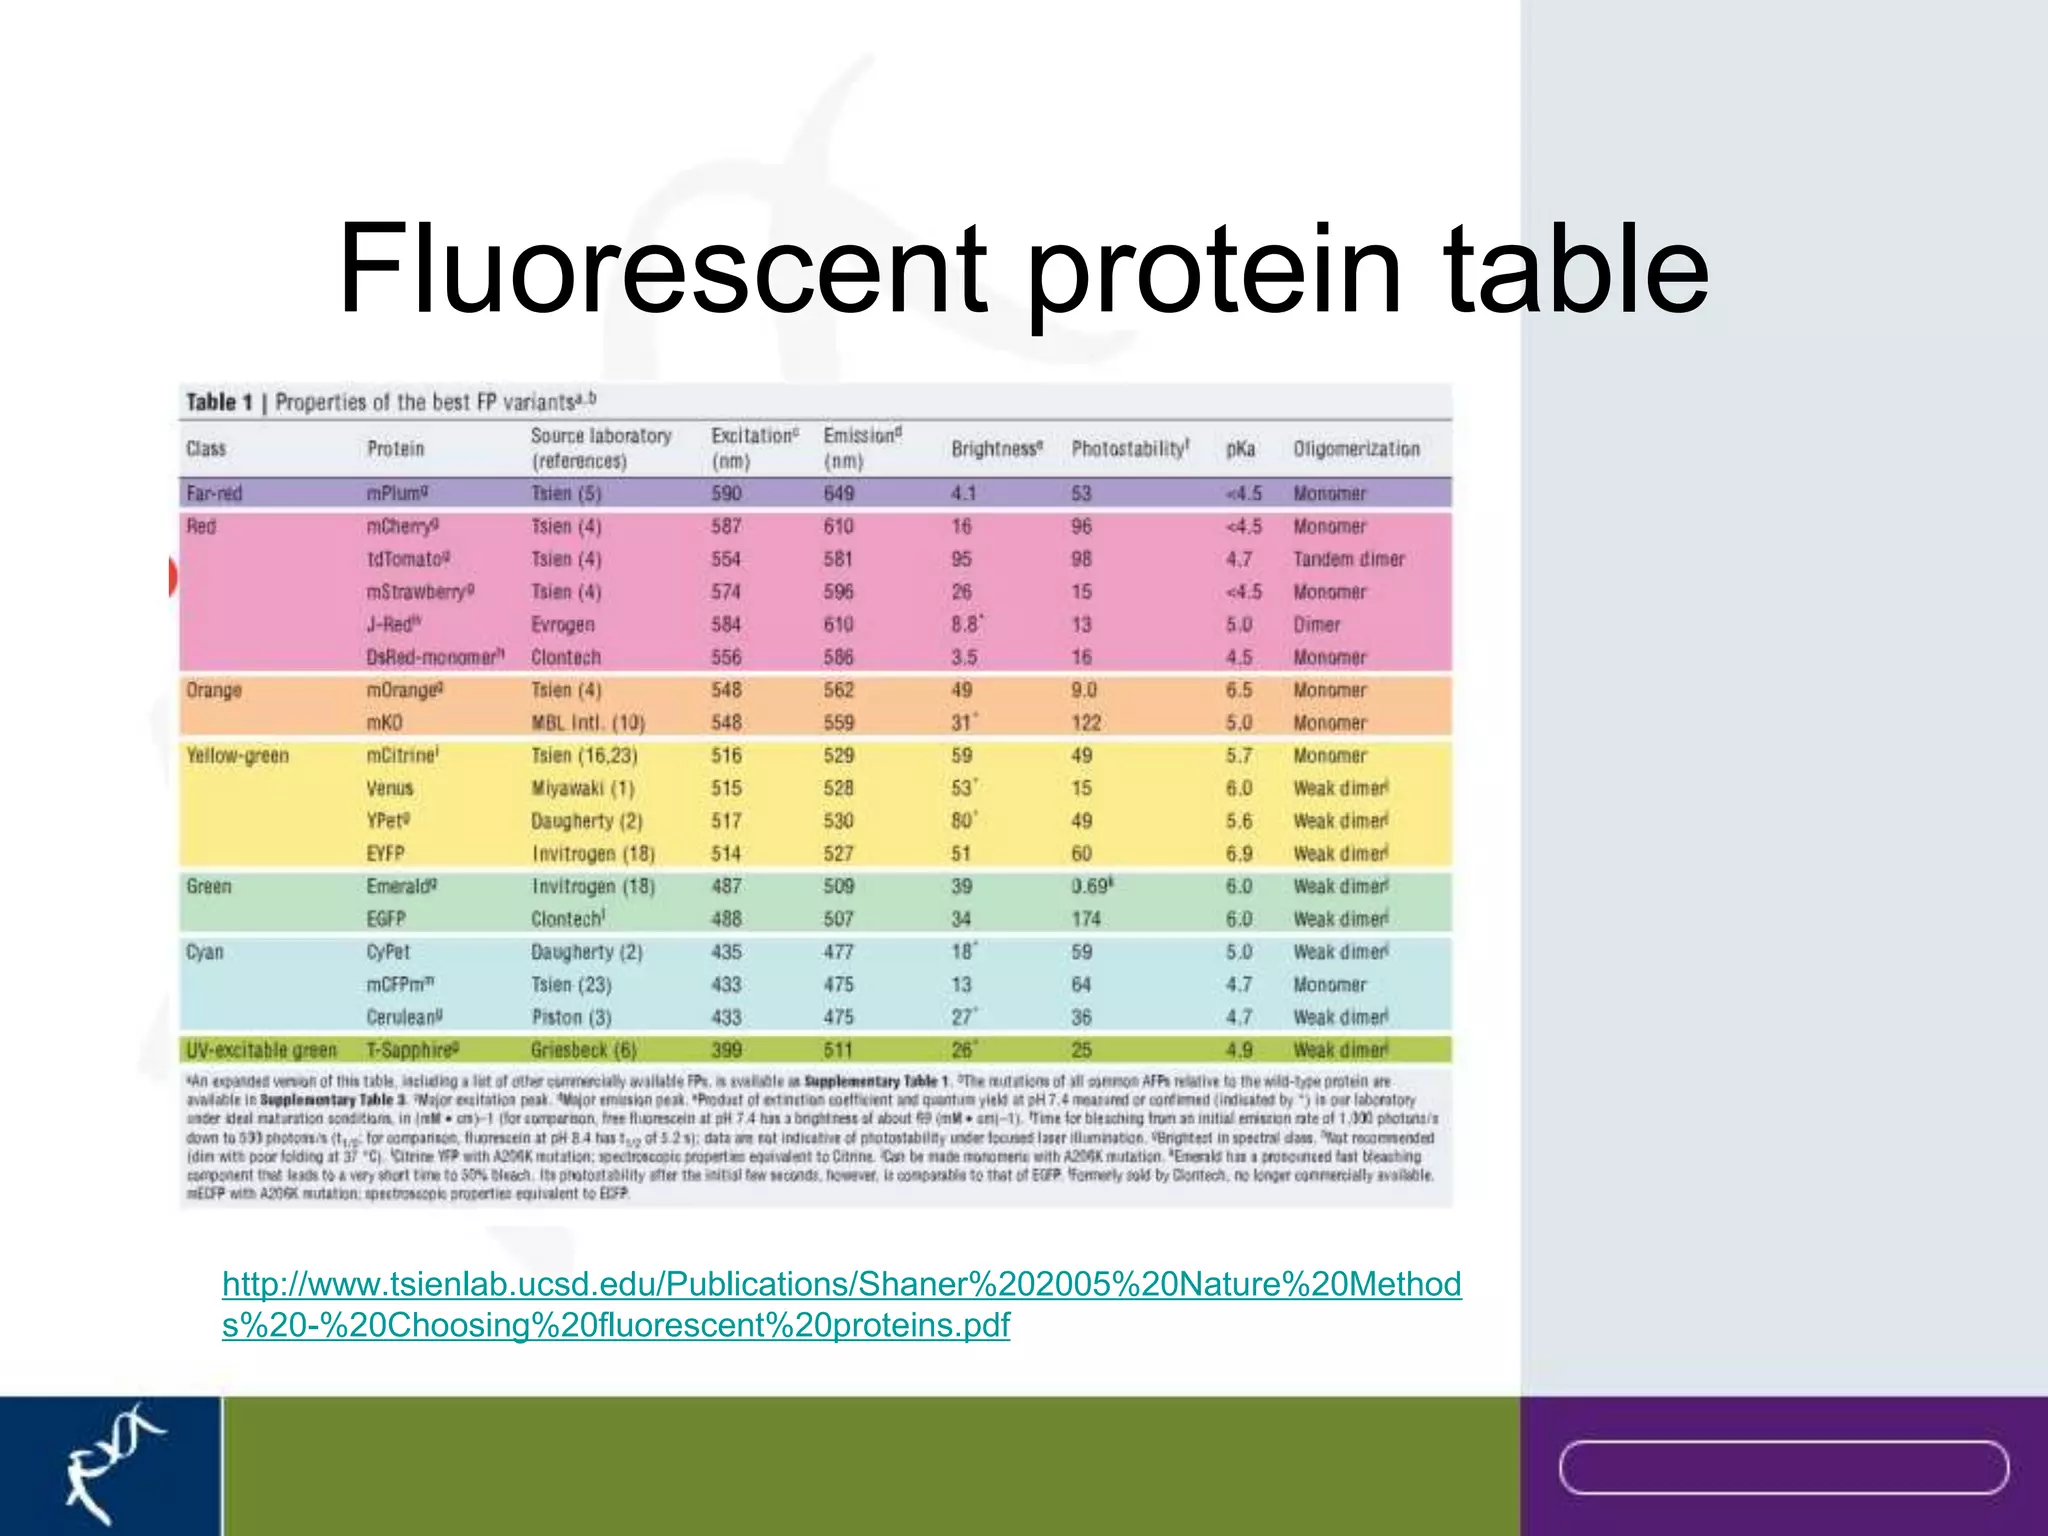
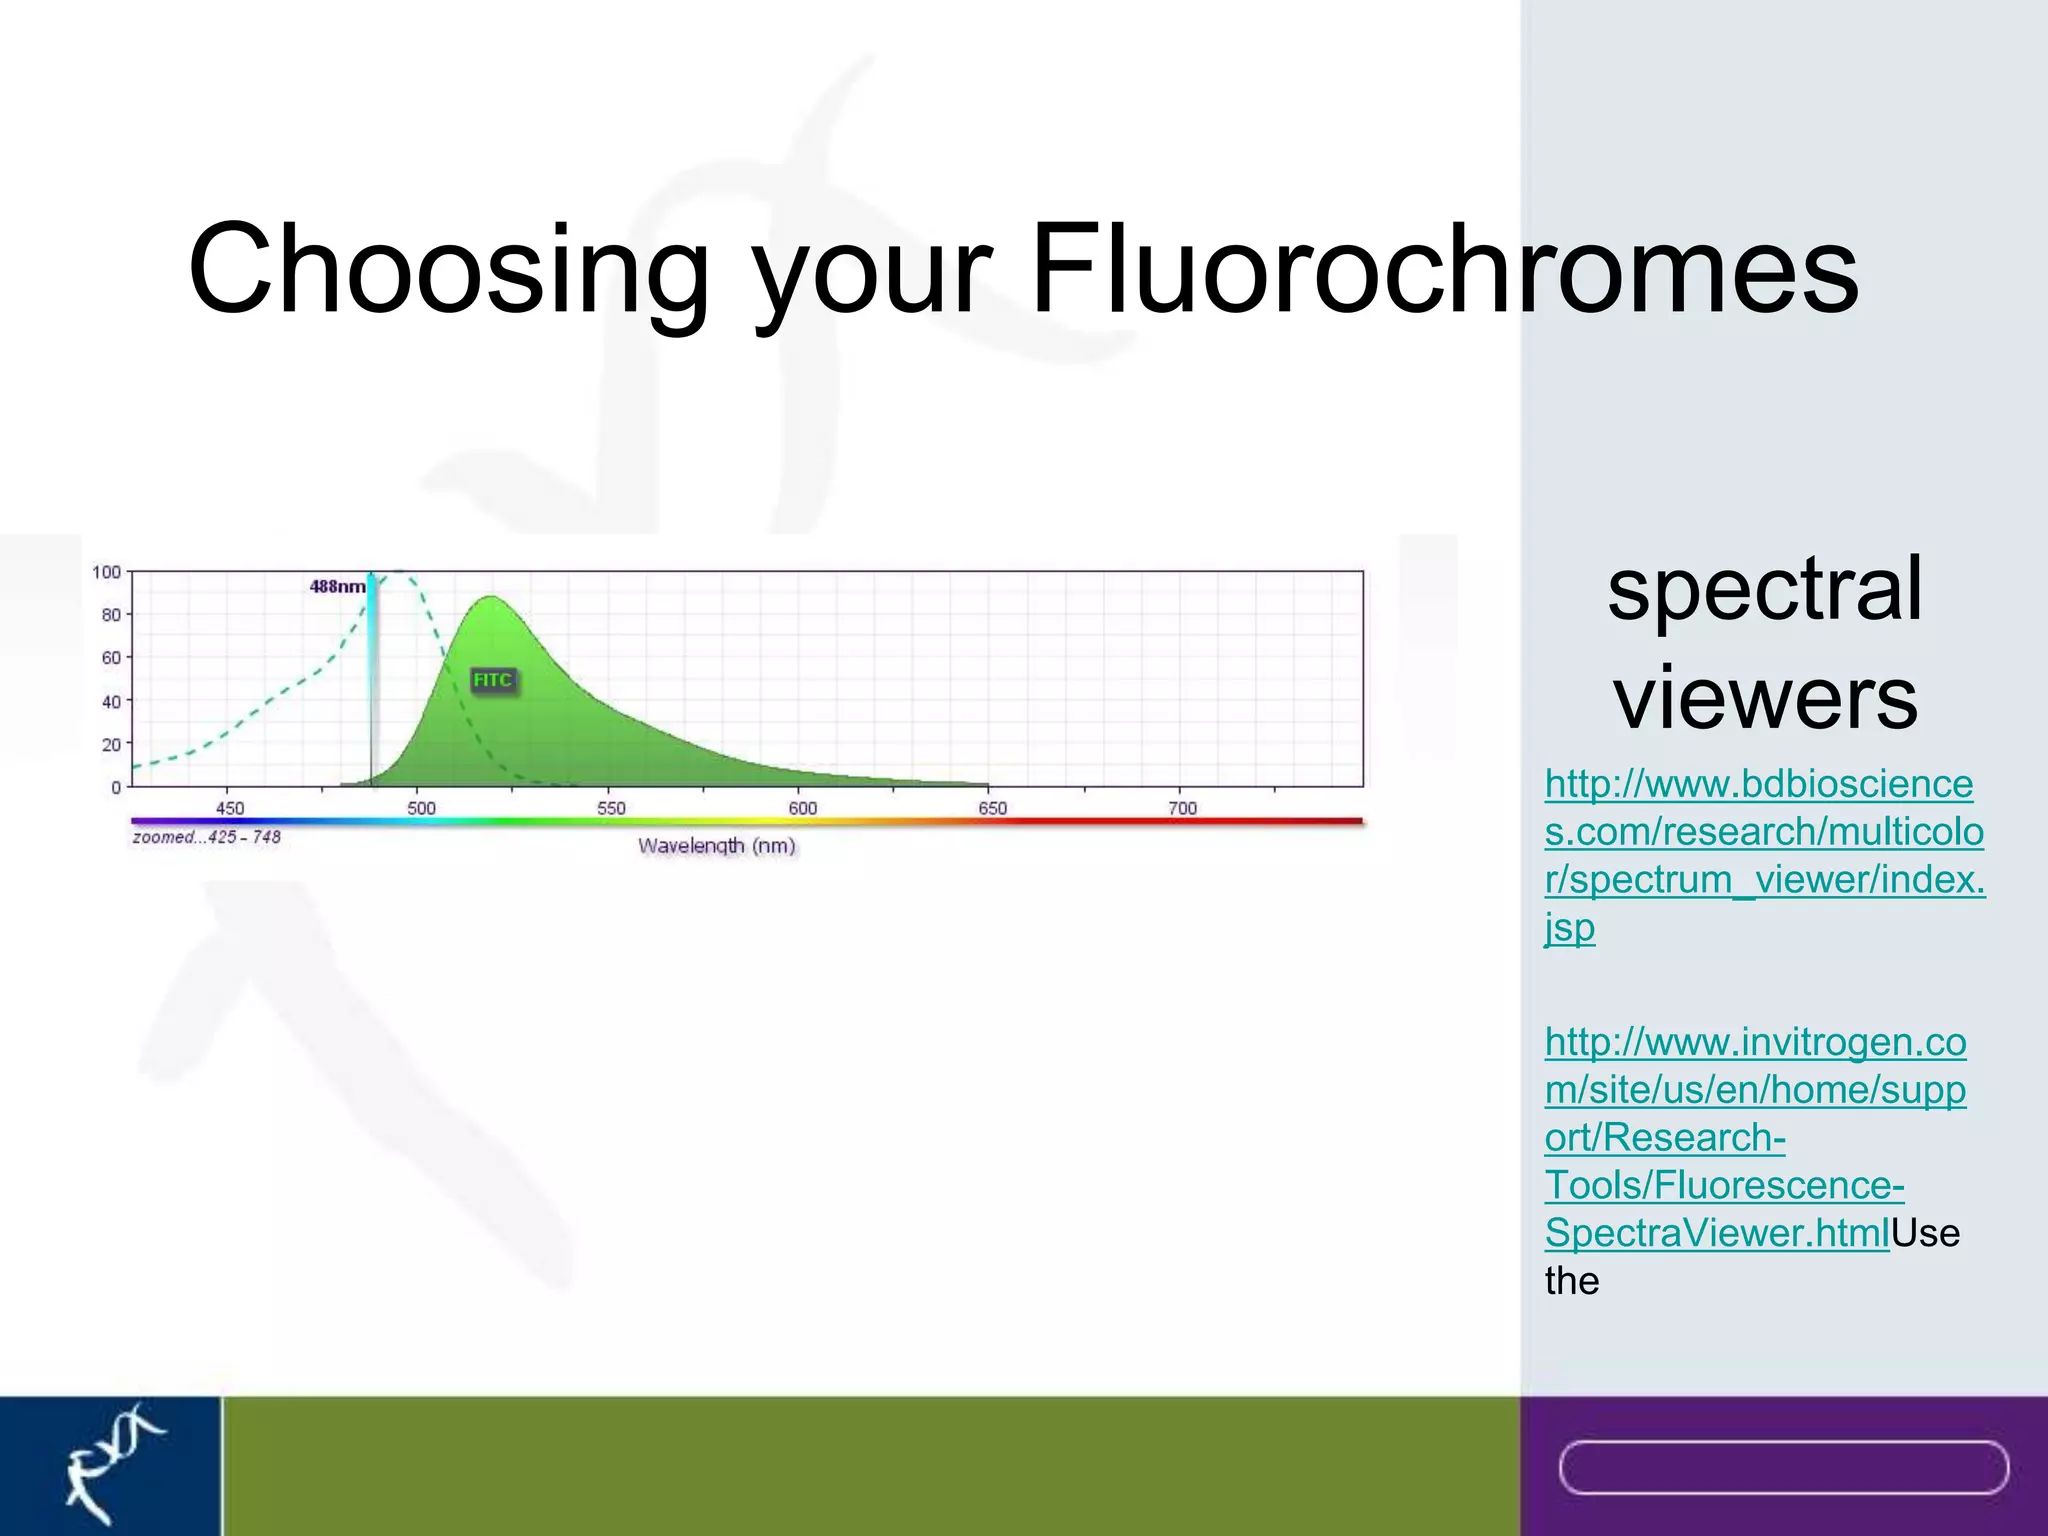
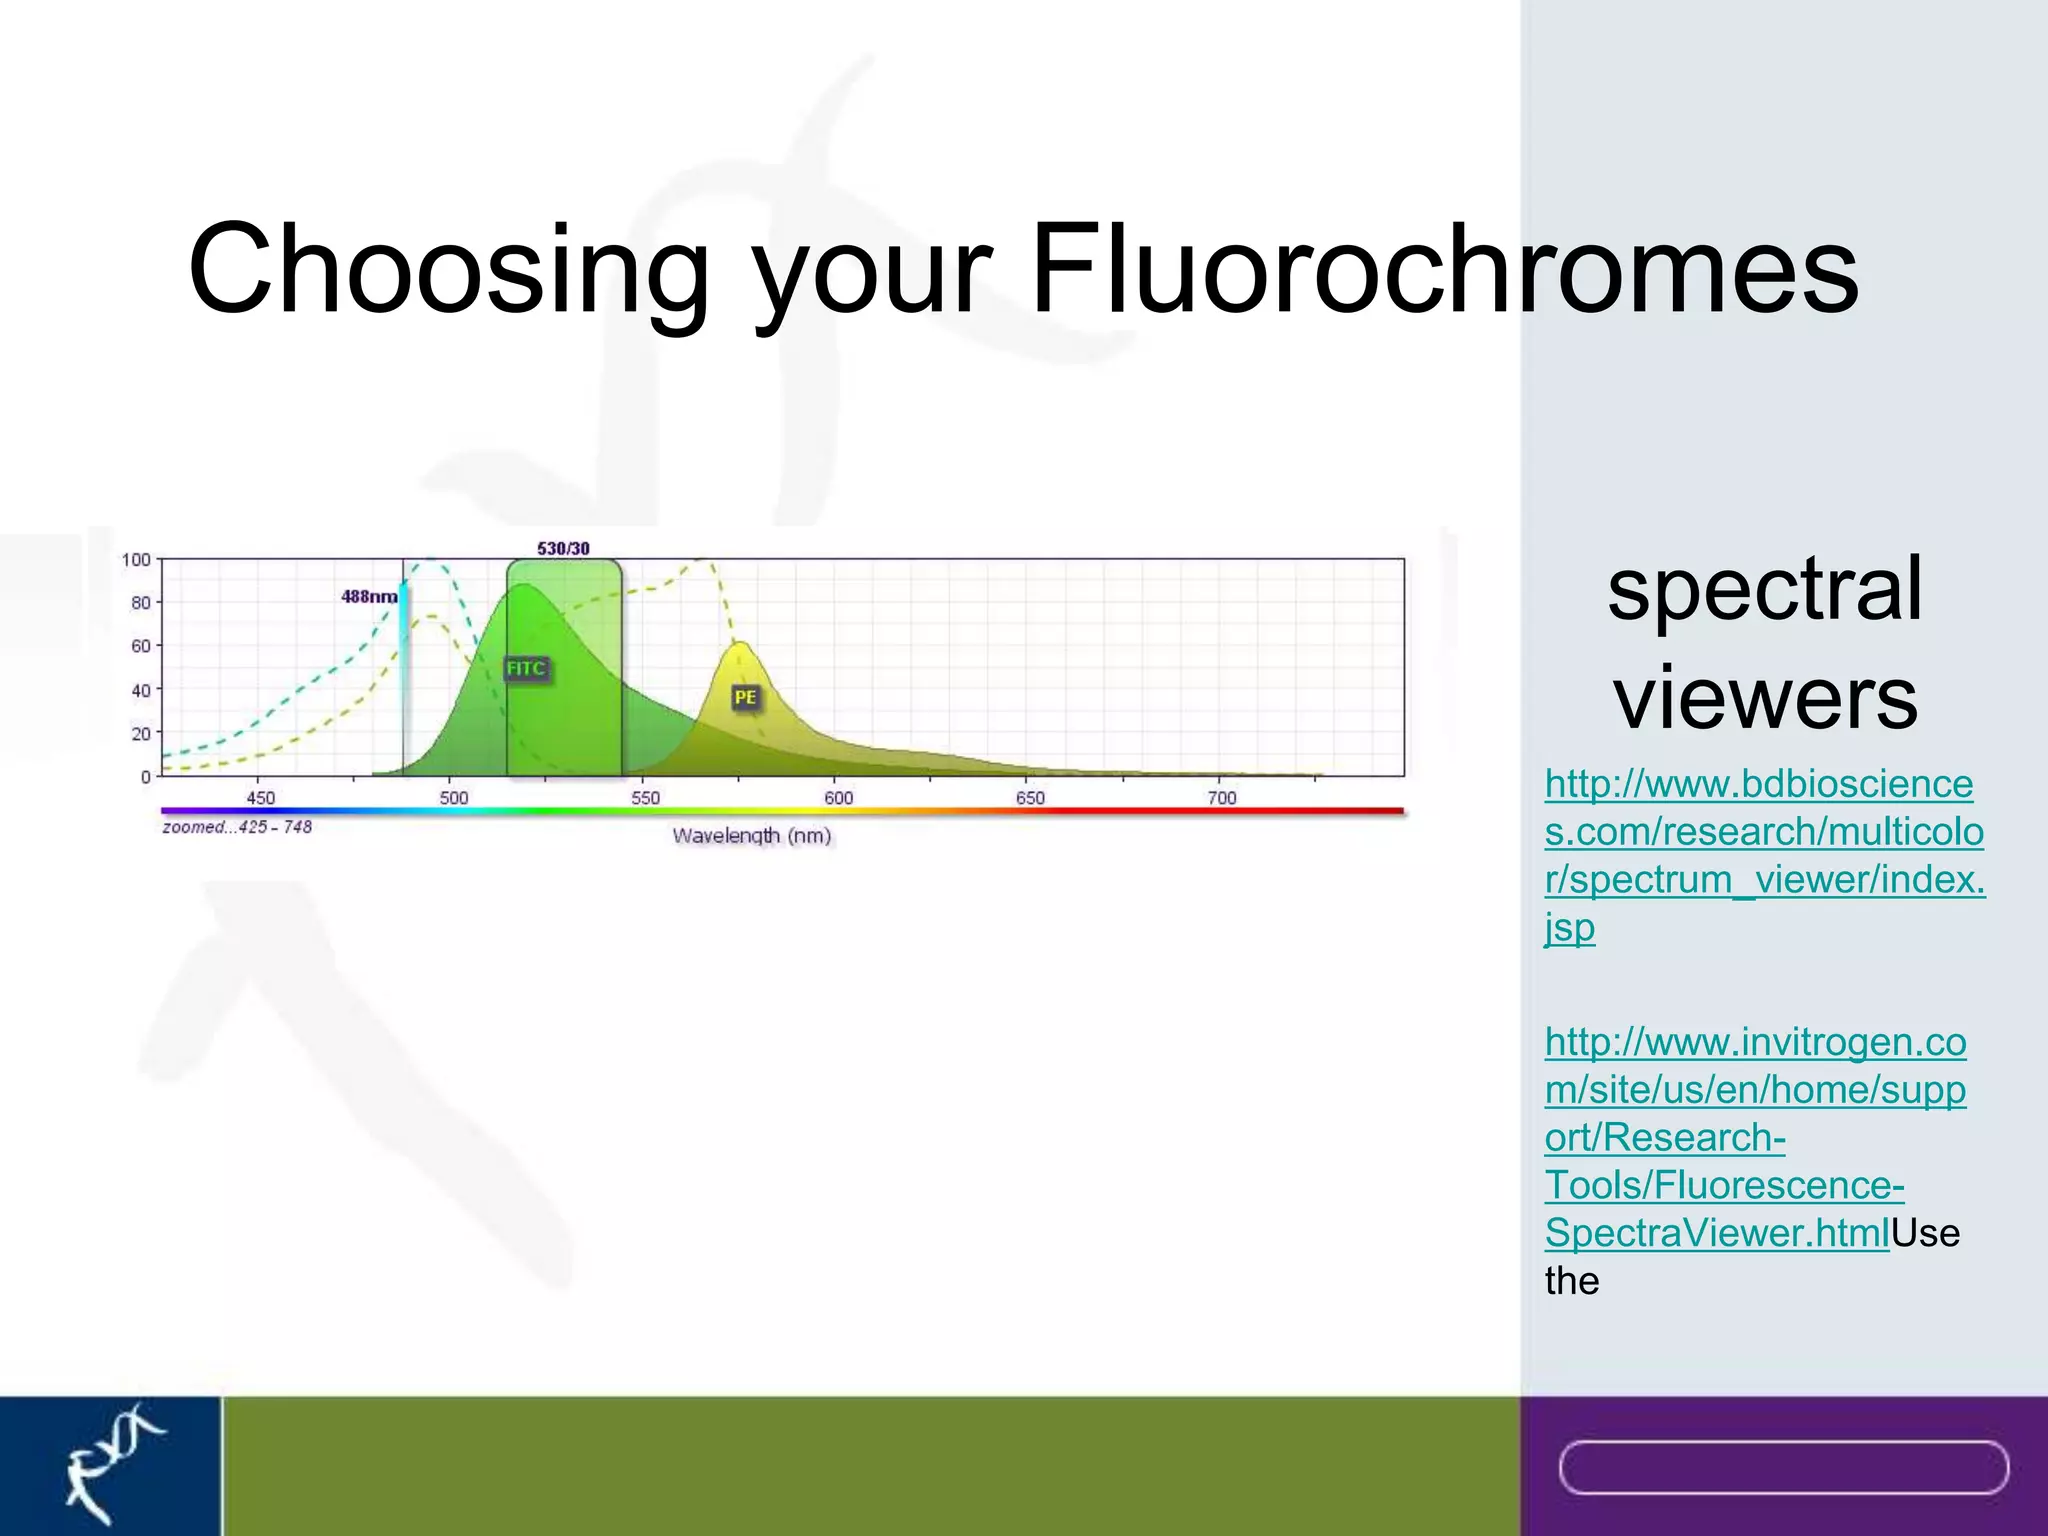
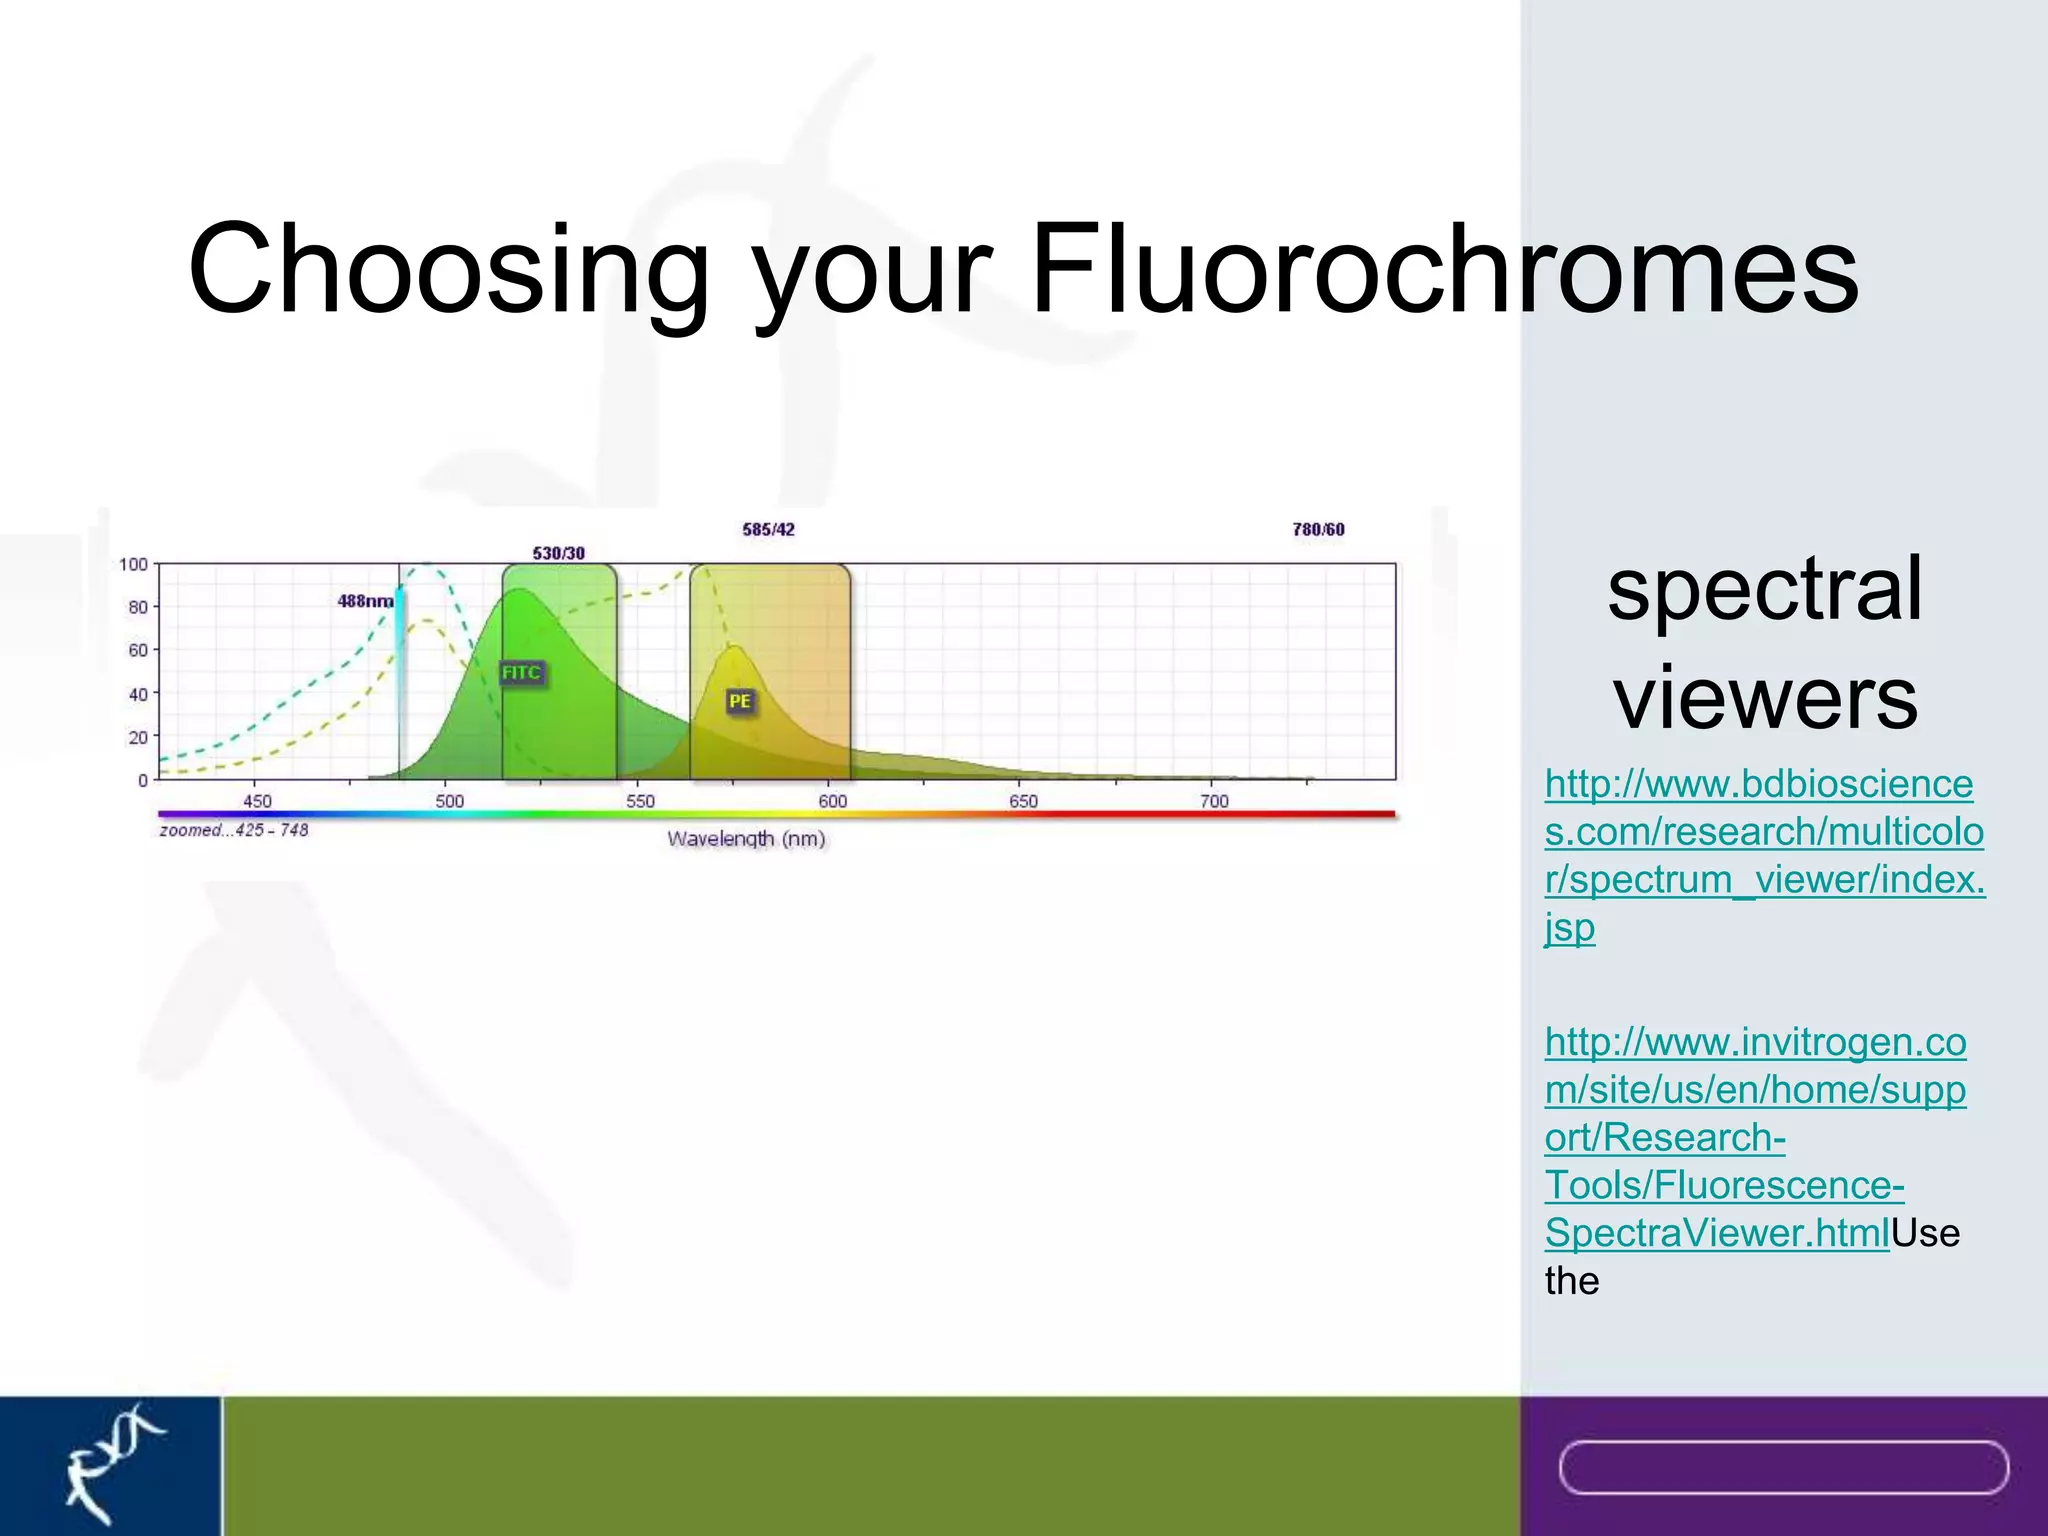
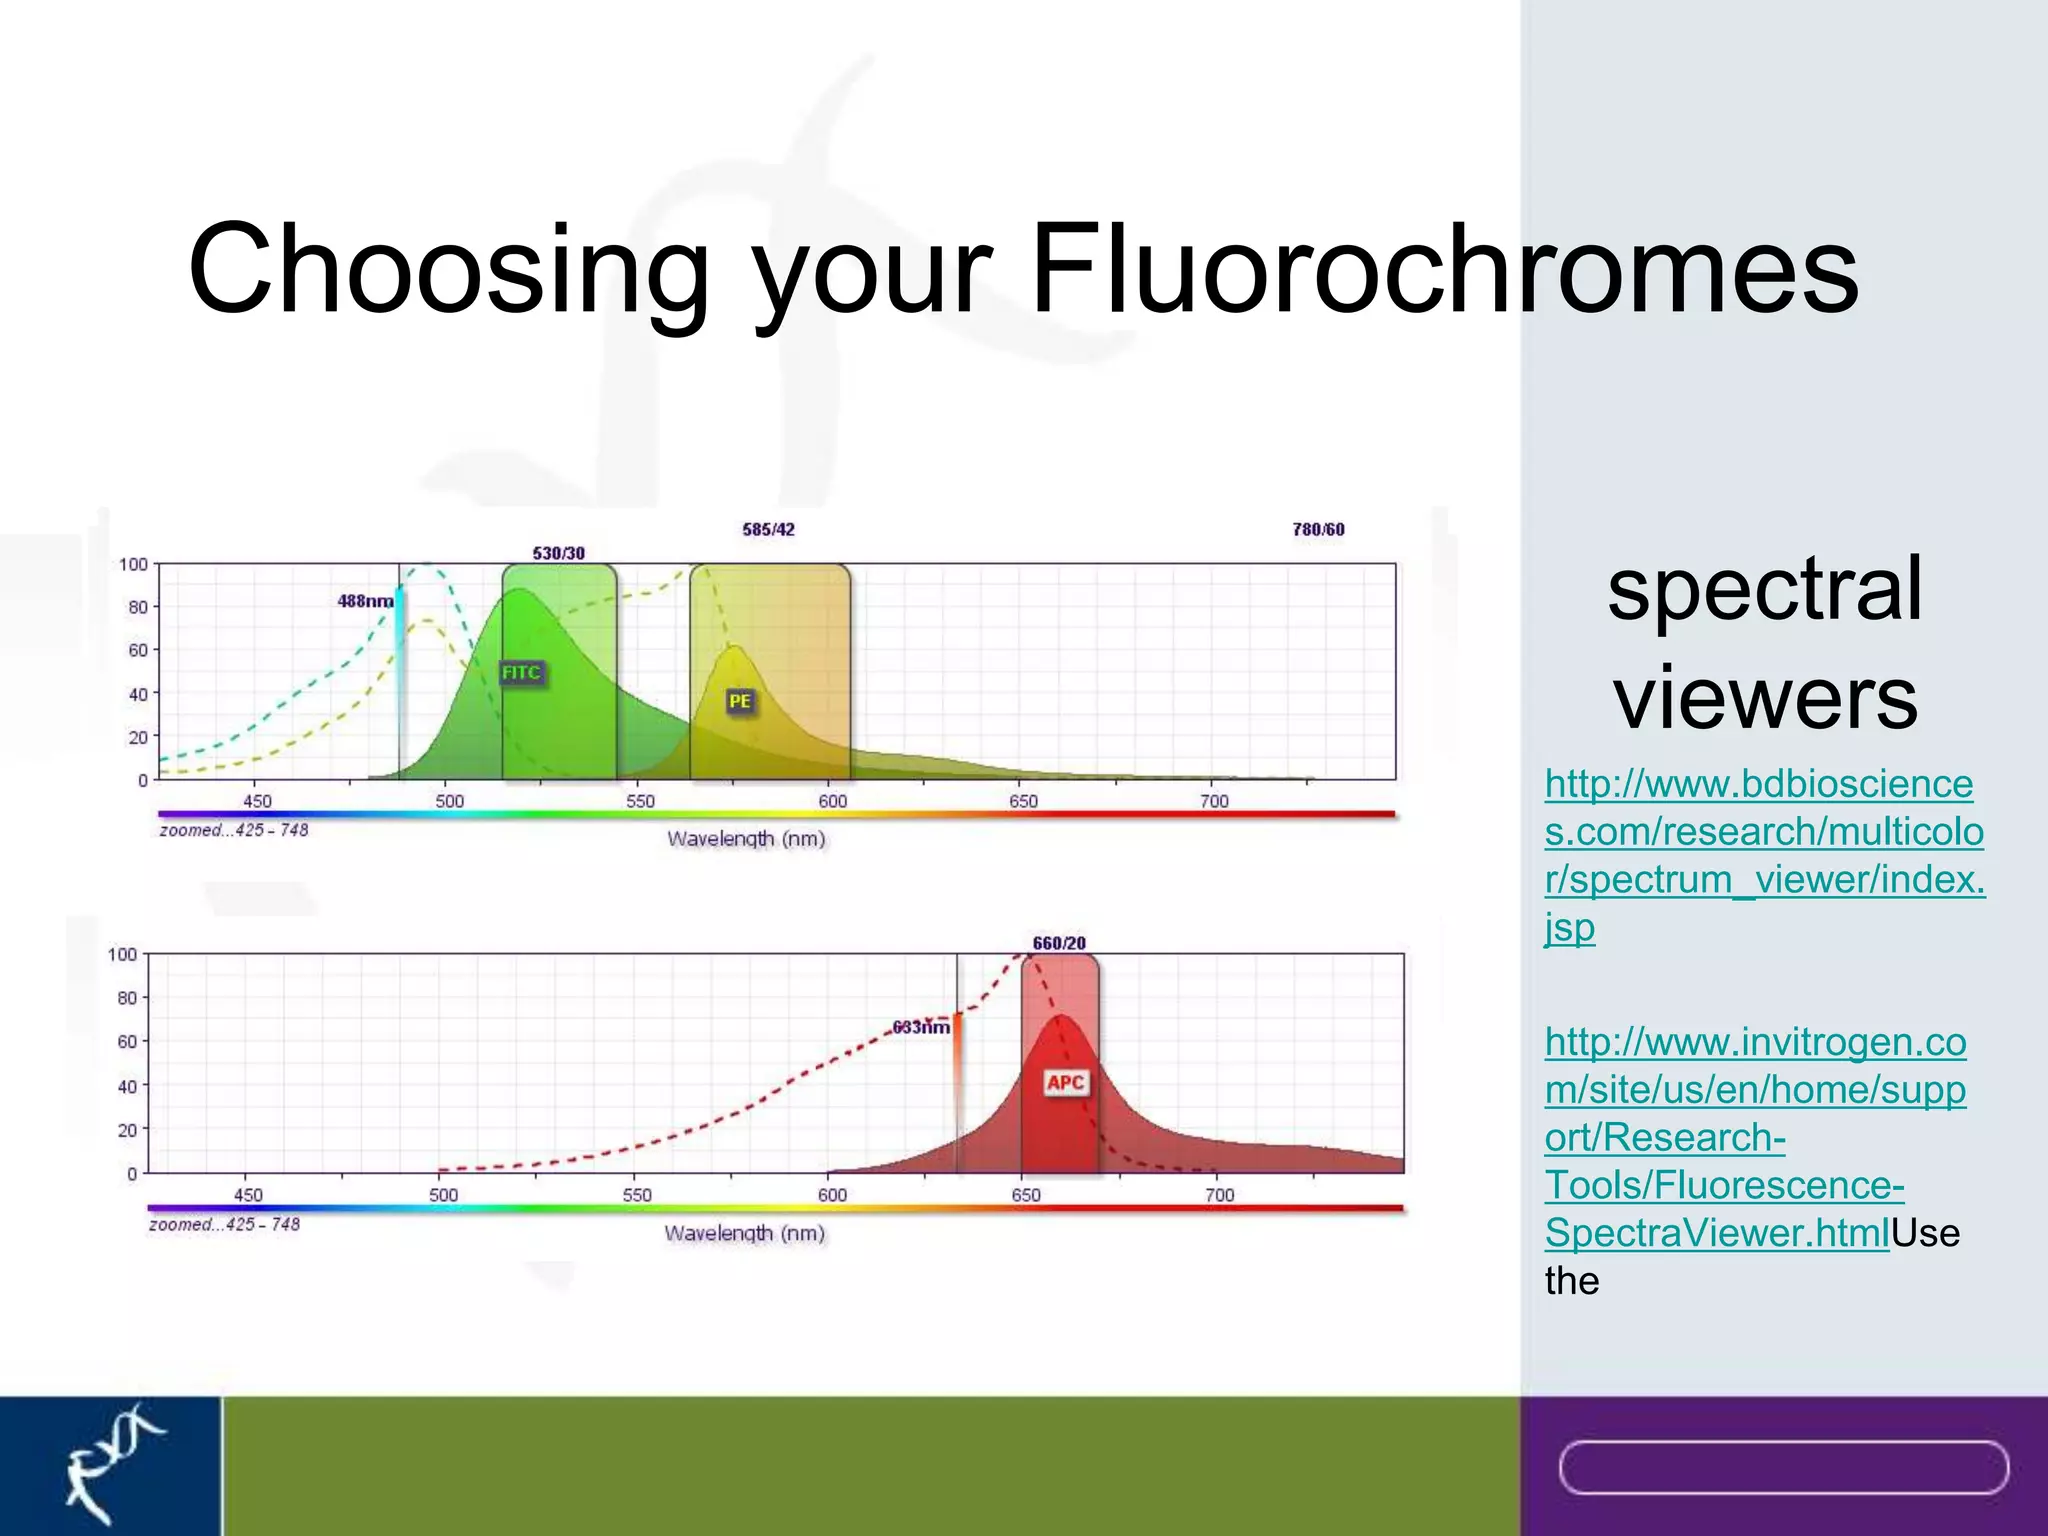
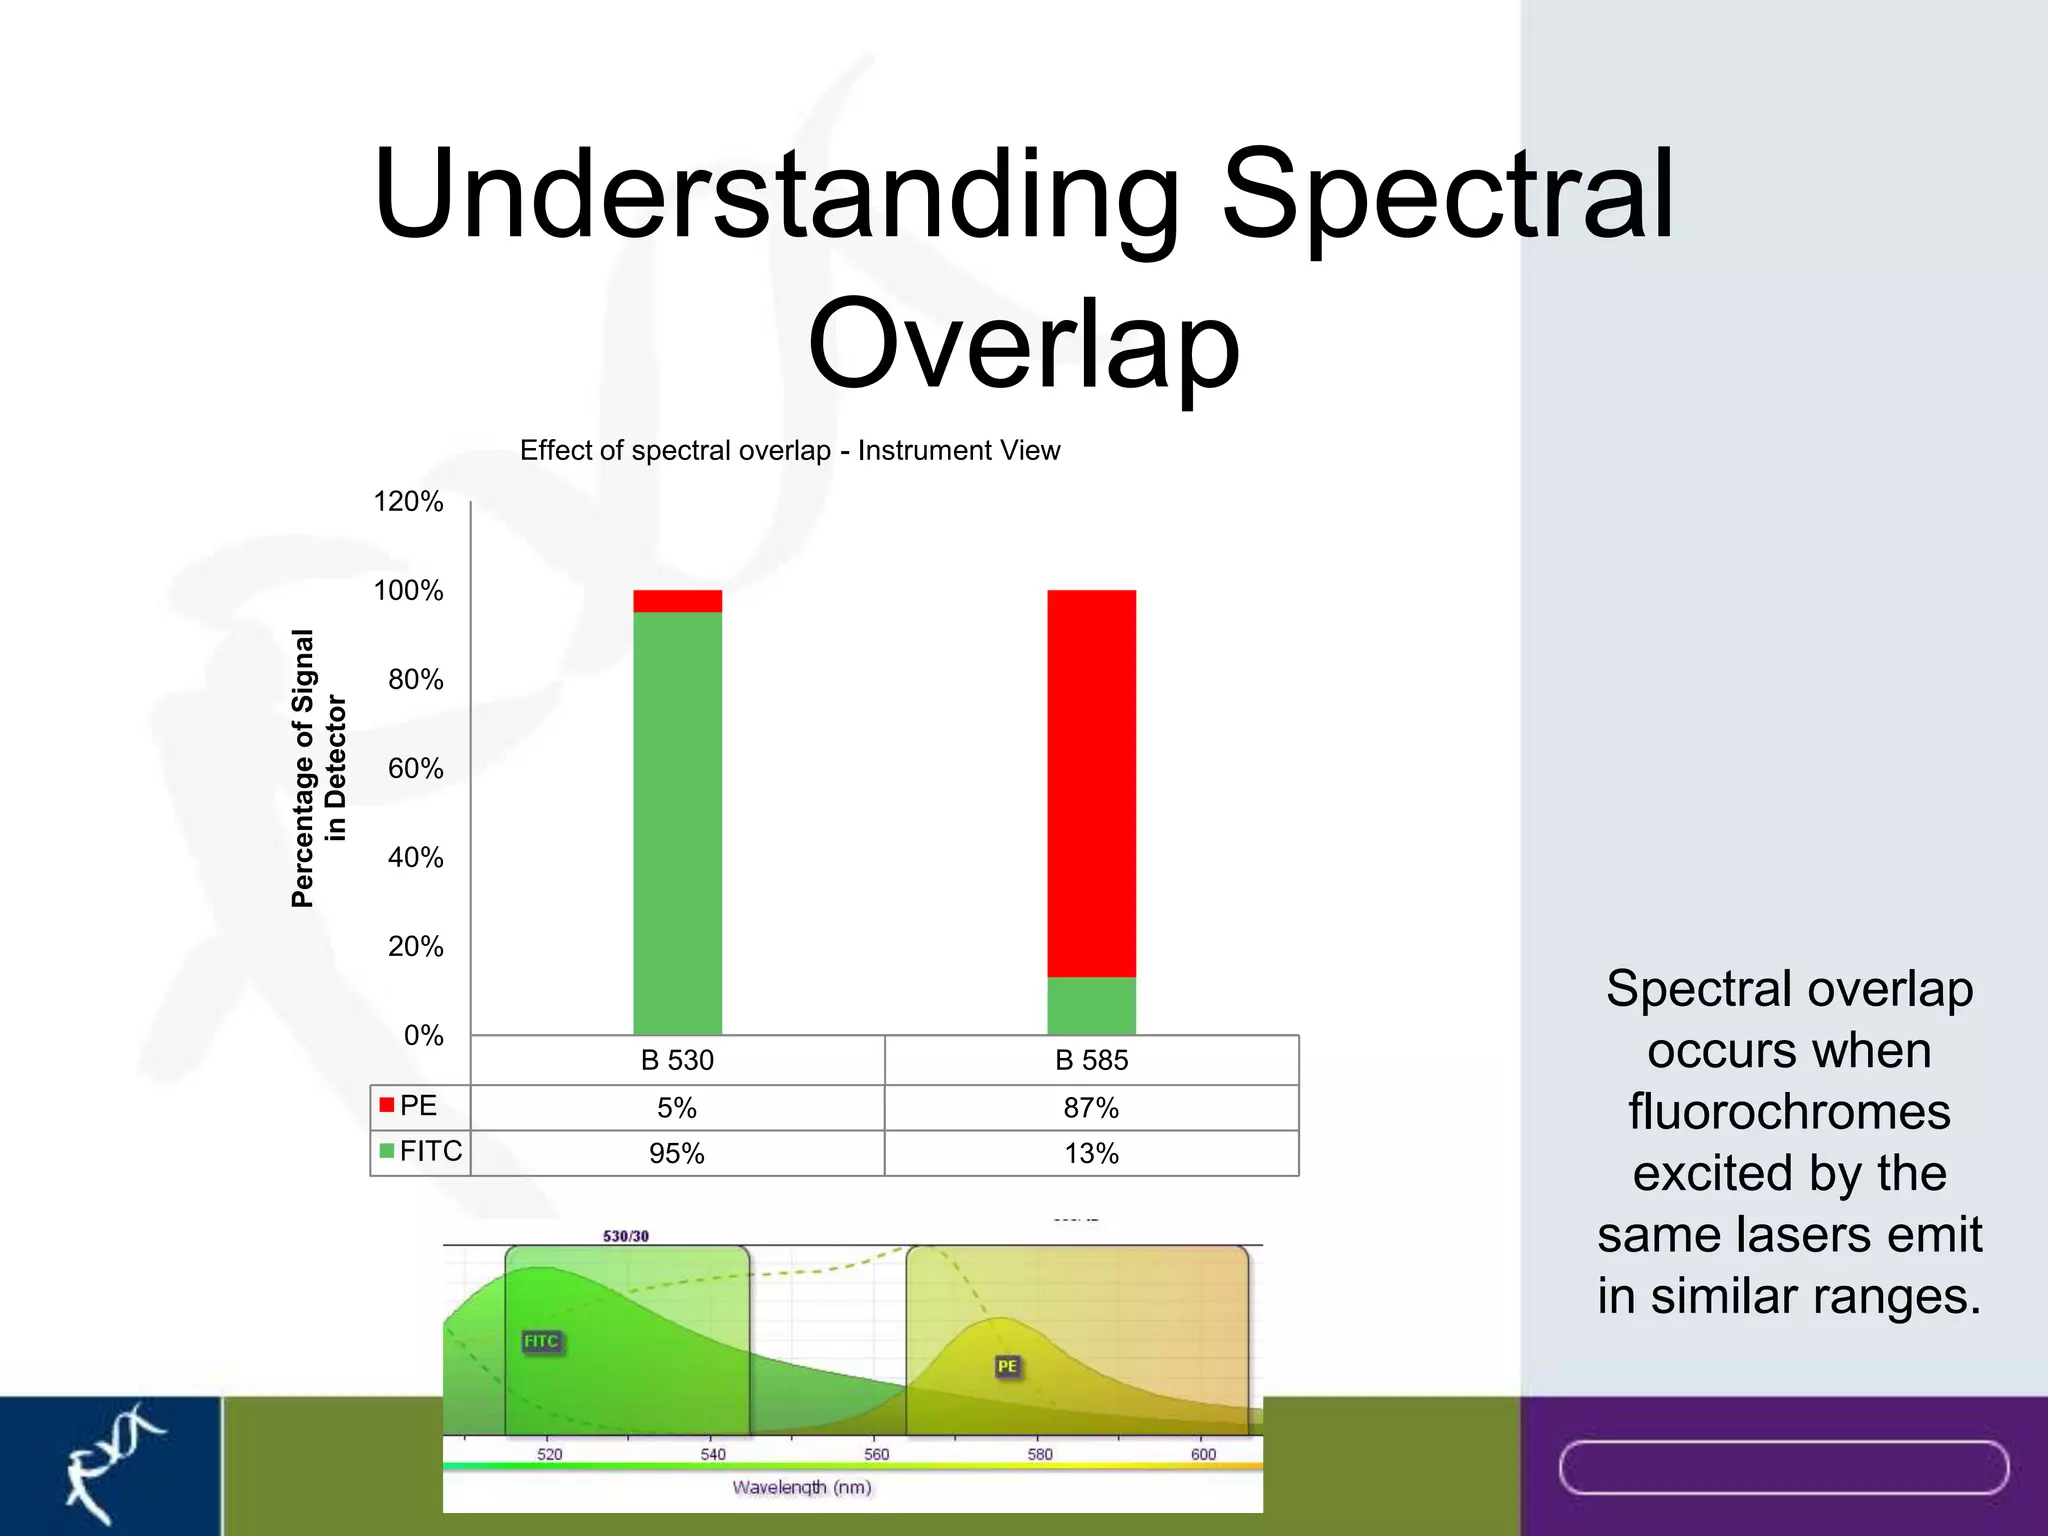
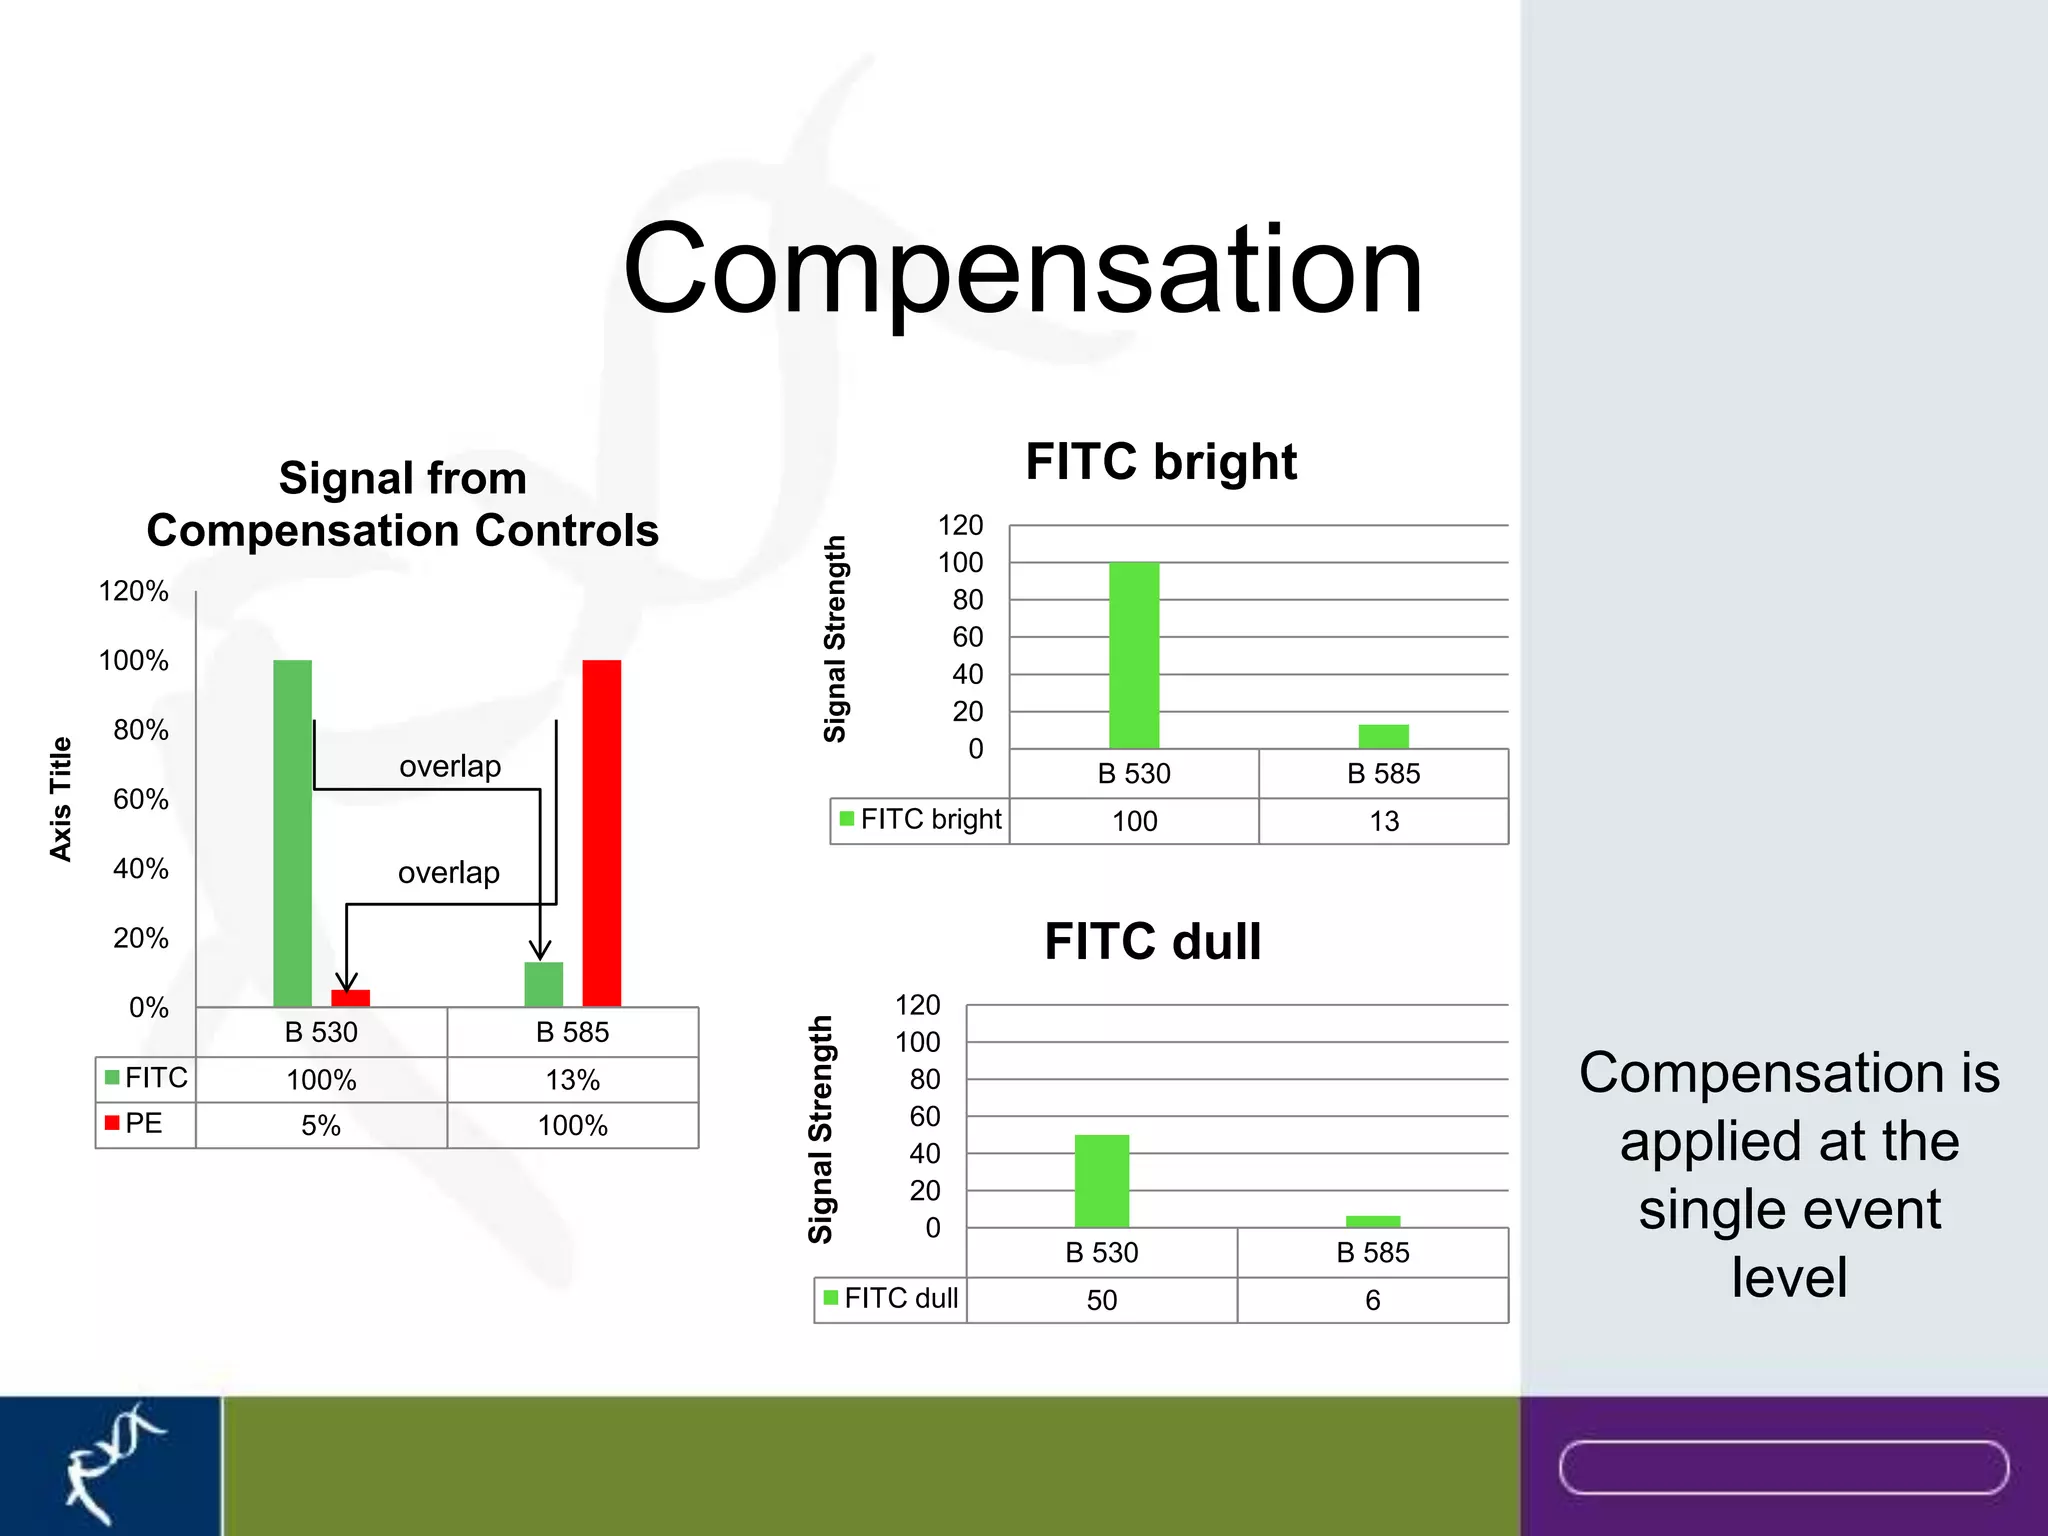
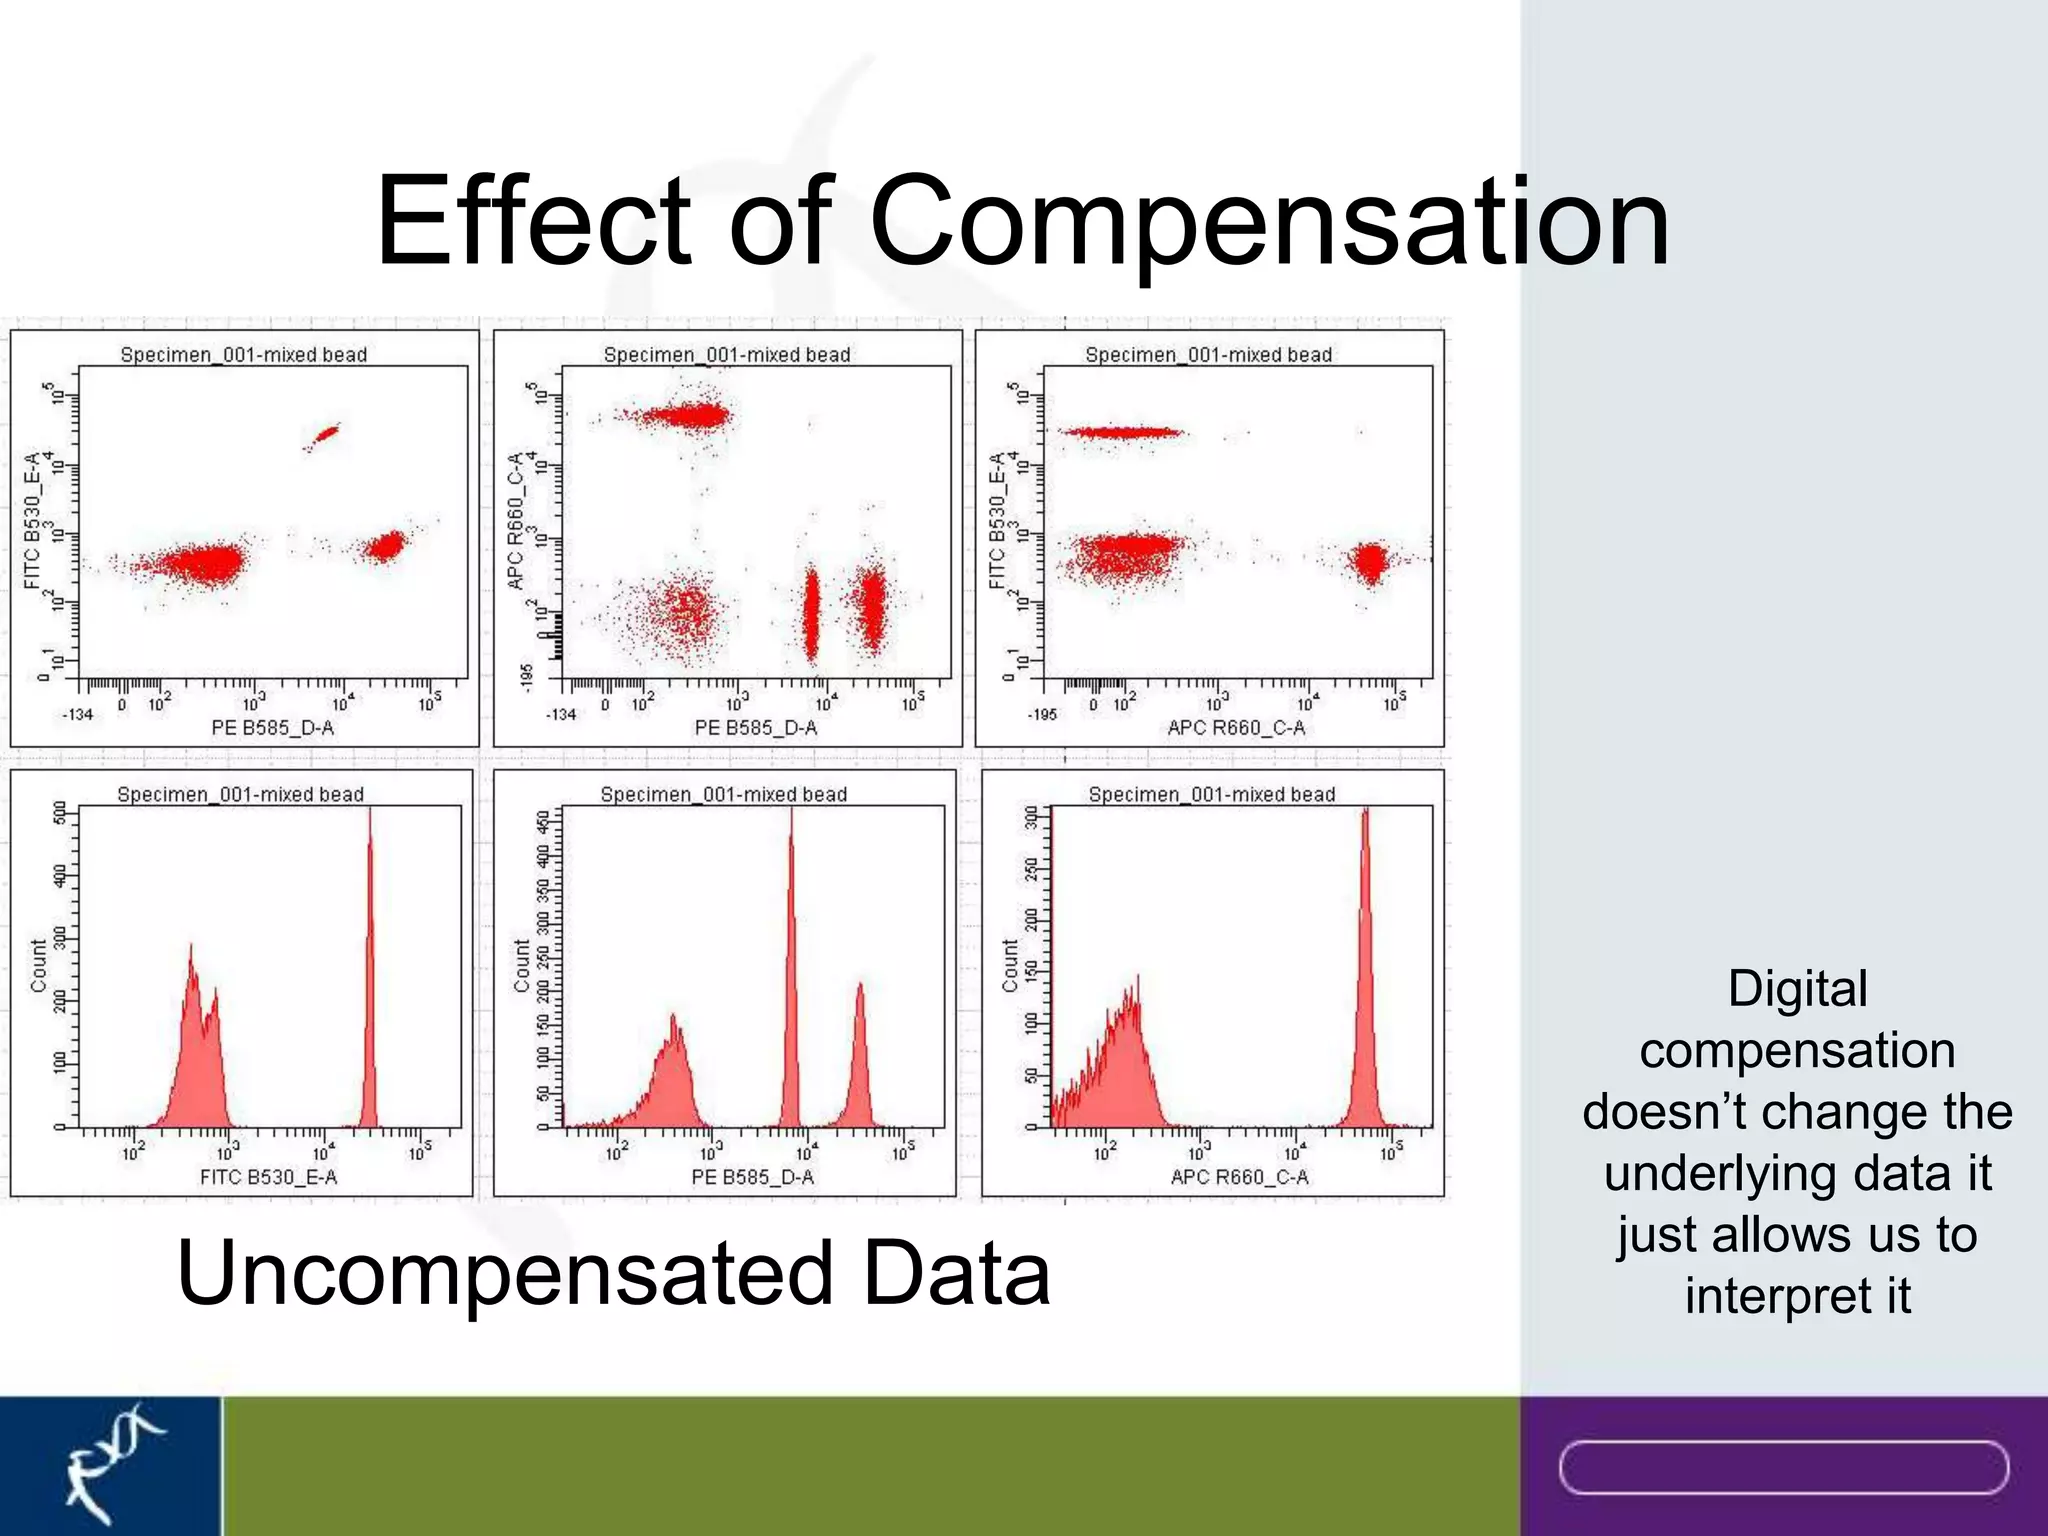
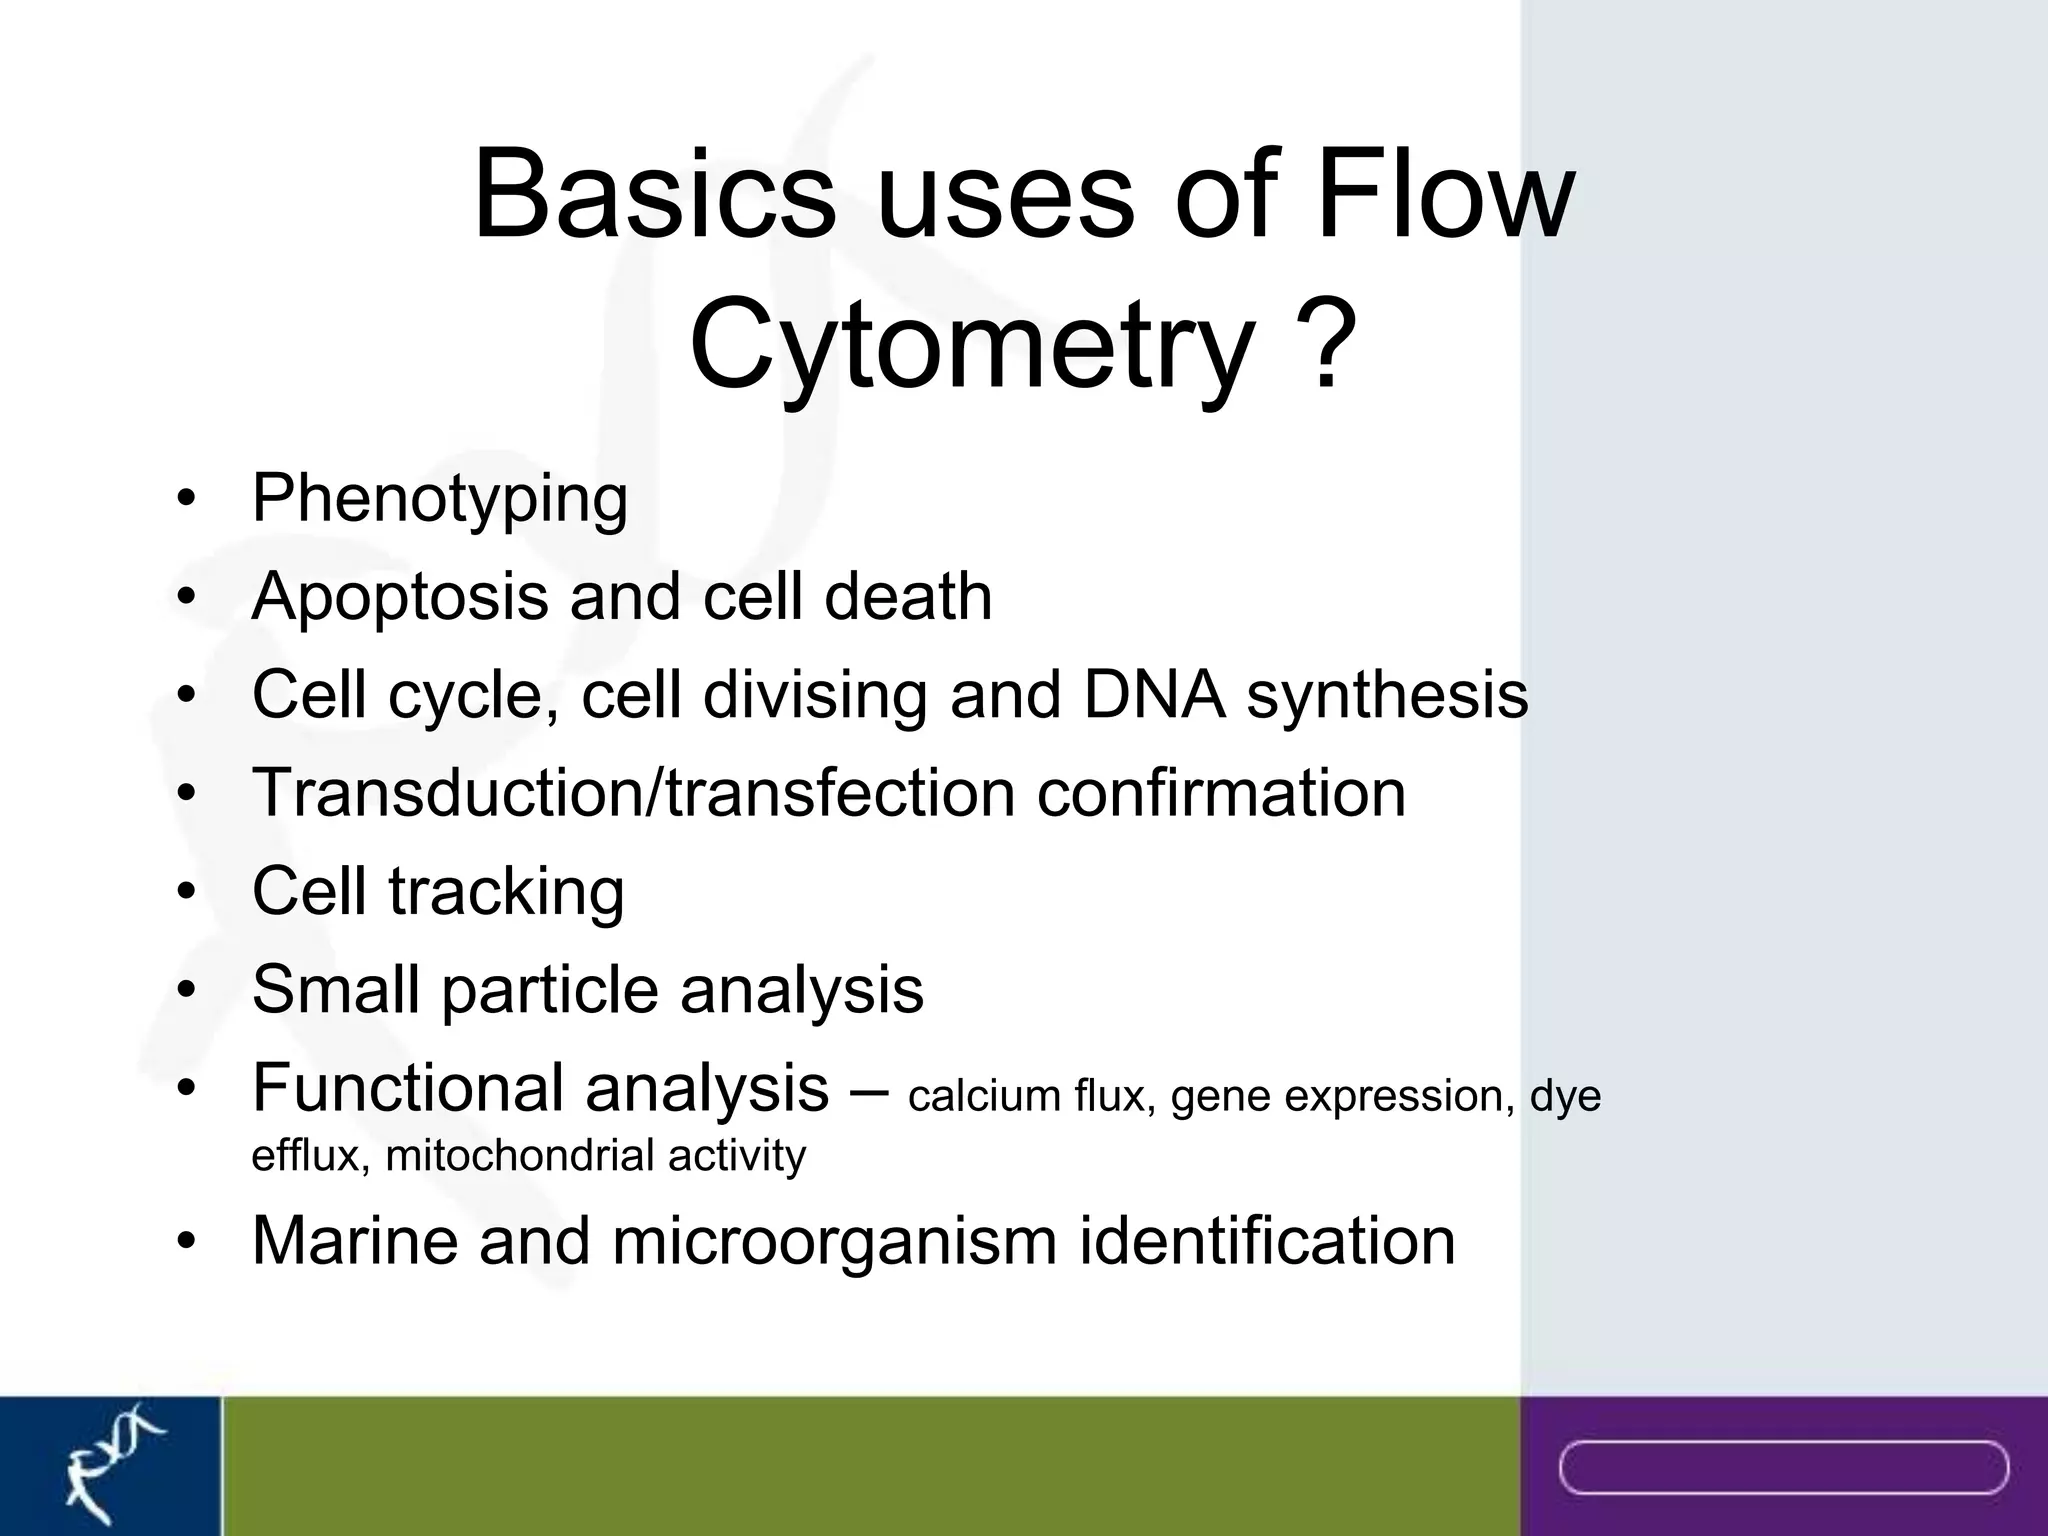
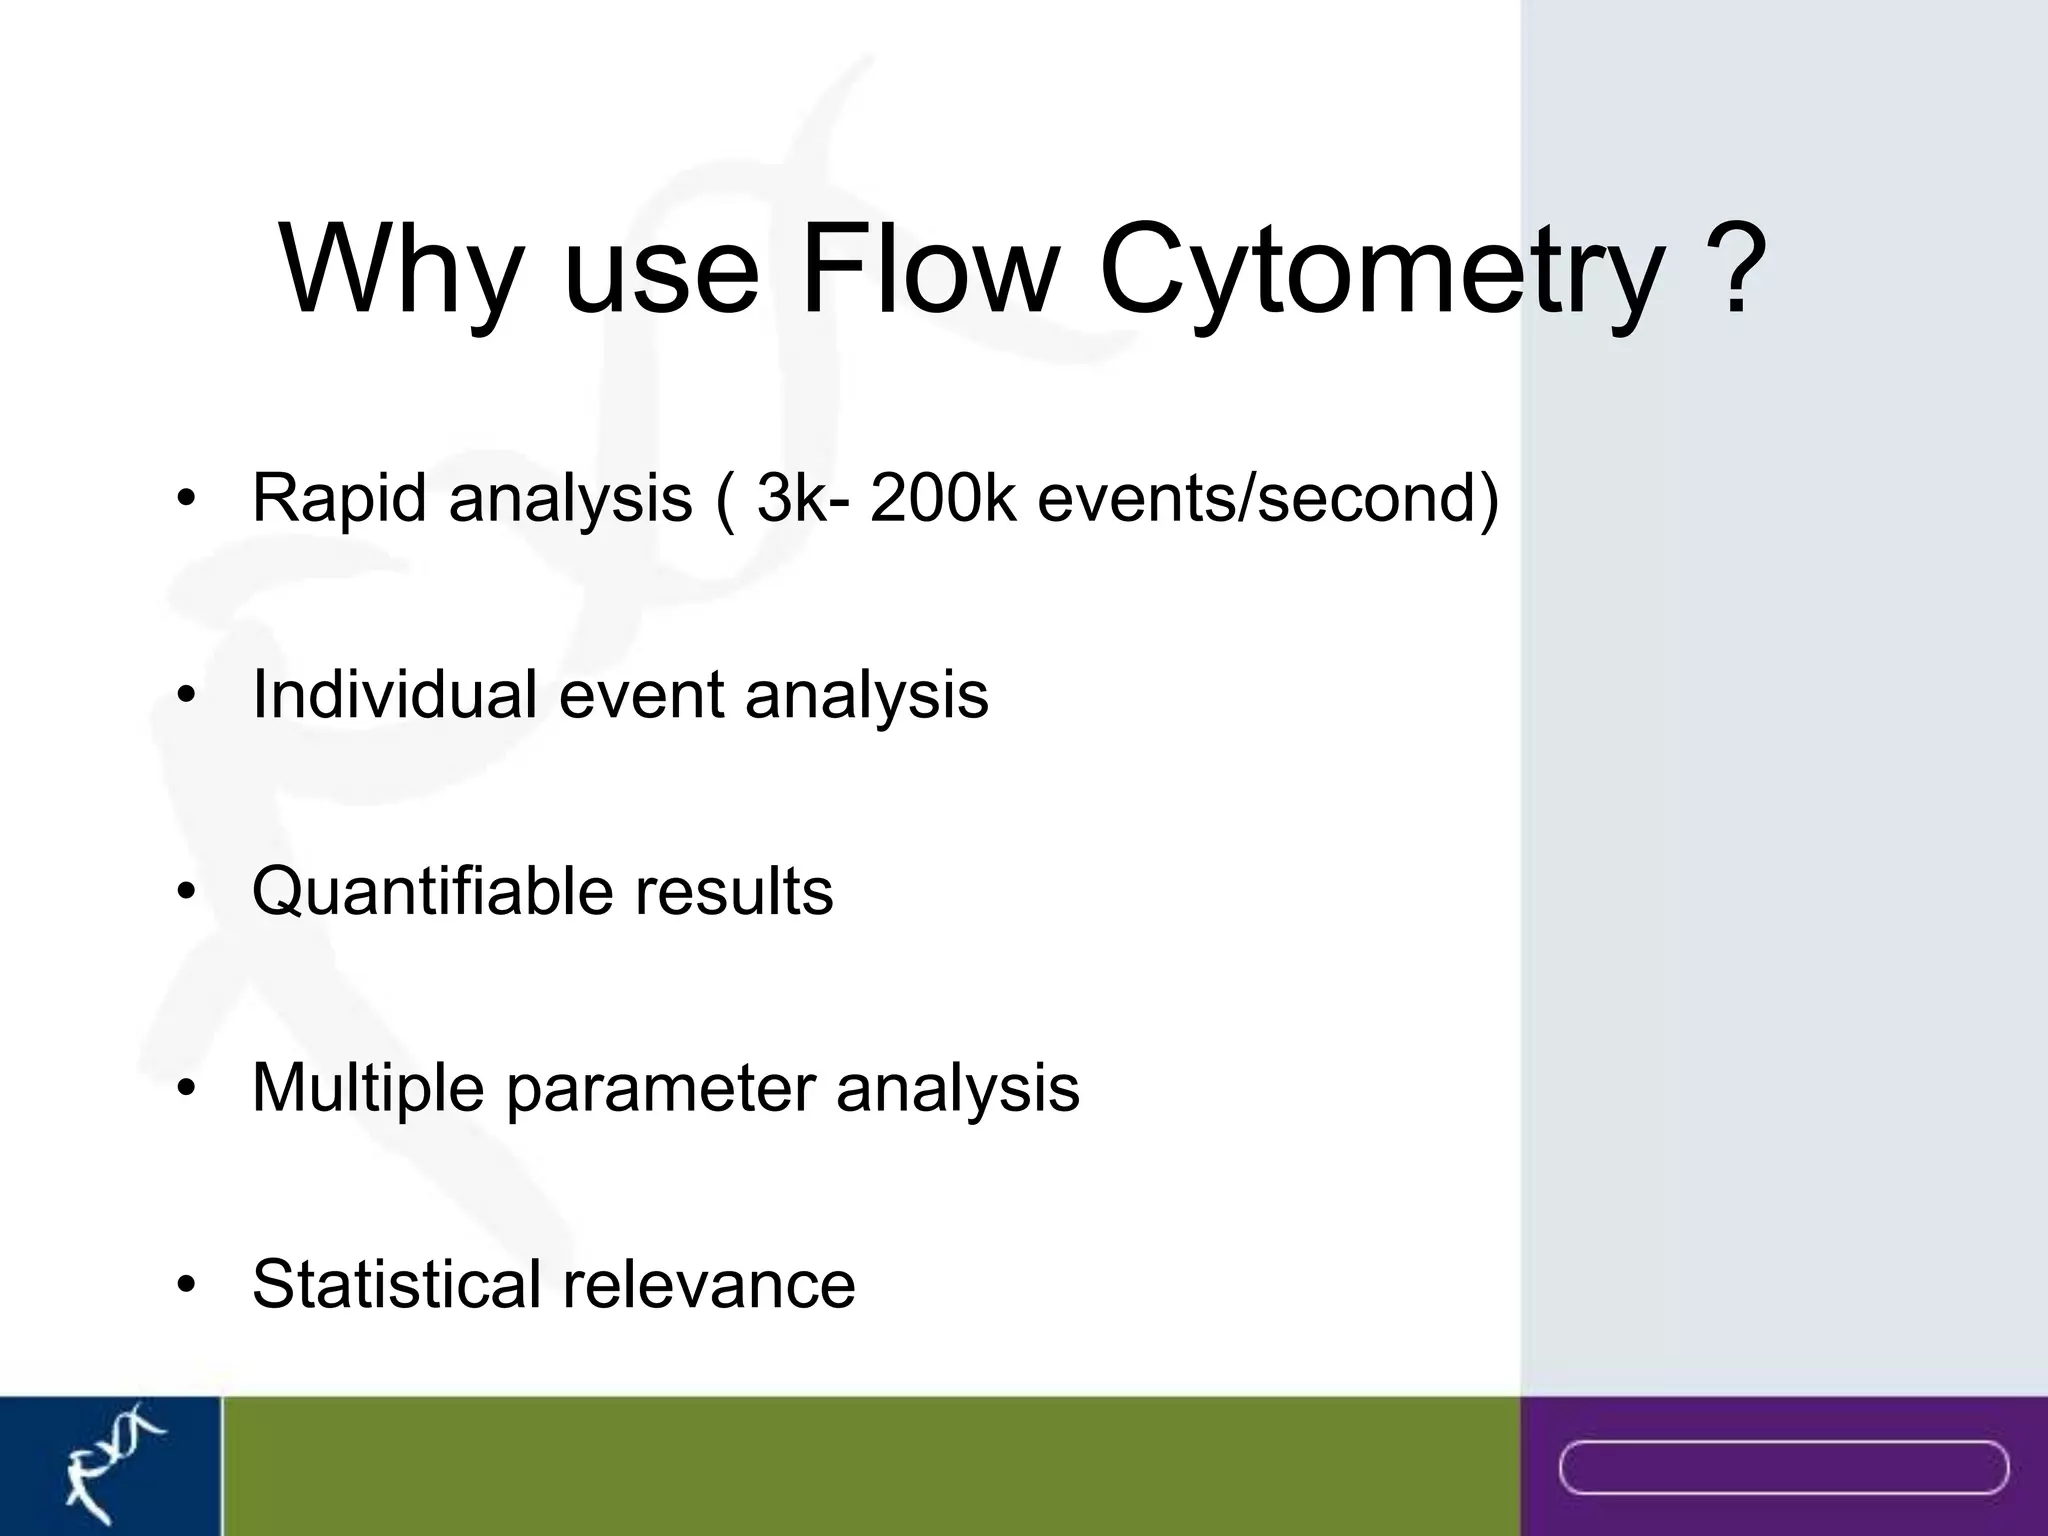
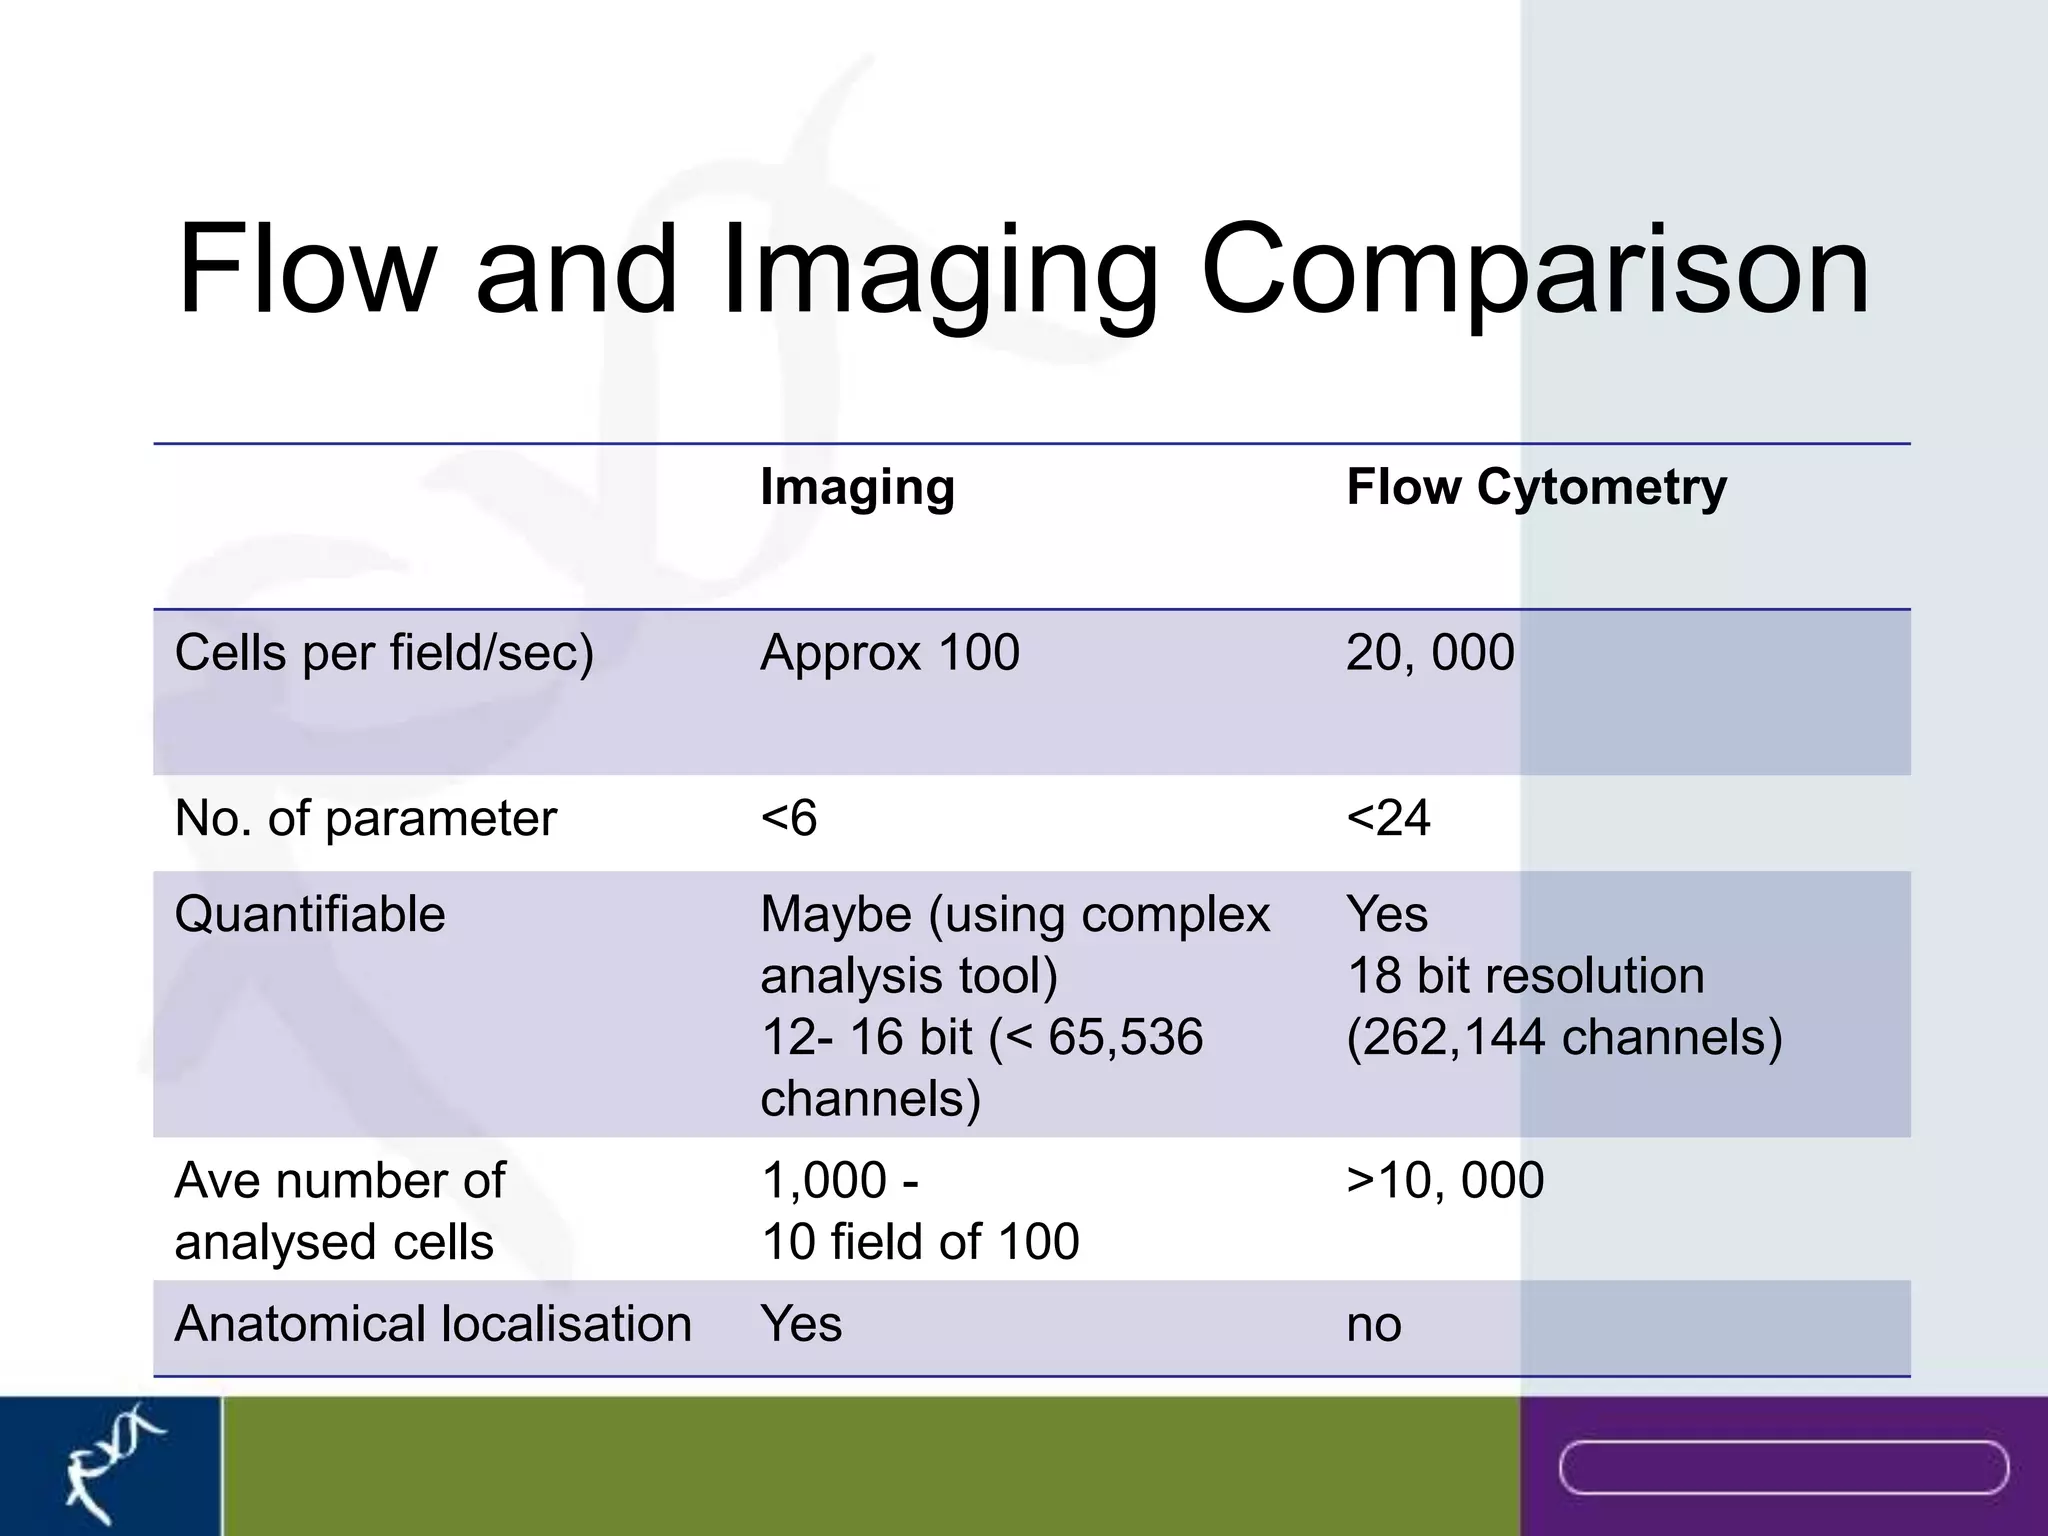
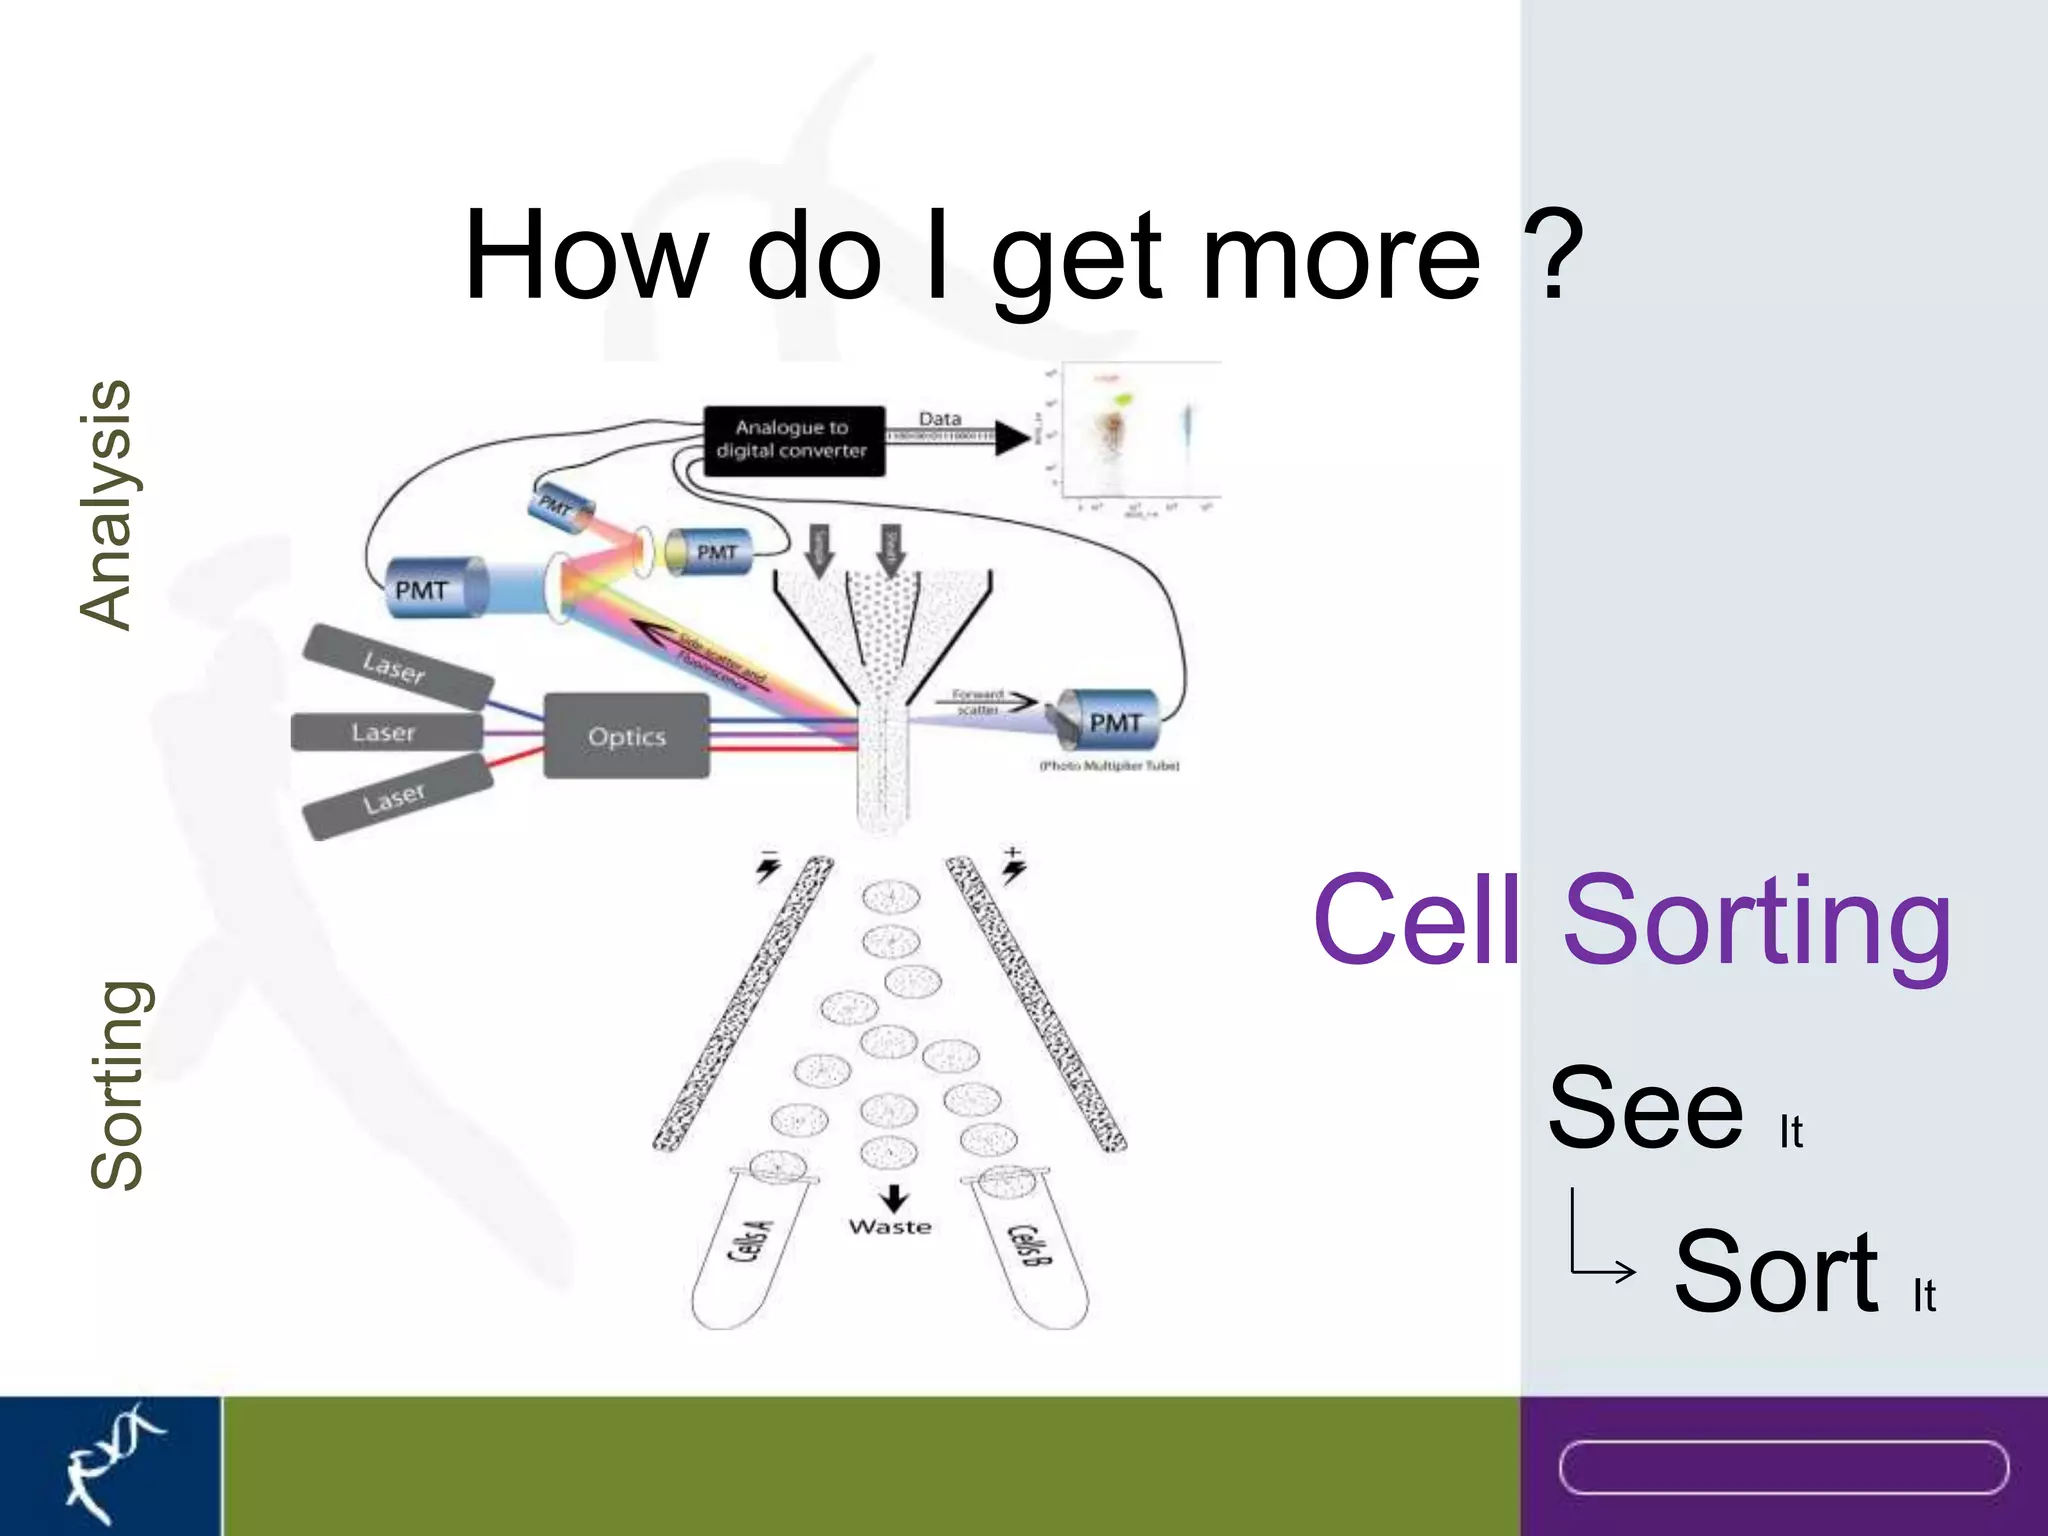


This document provides an introduction to flow cytometry. It defines flow cytometry as the measurement of physical and chemical characteristics of cells as they flow in a fluid stream through a beam of light. It describes the key components of a flow cytometer including fluidics to deliver cells to the laser, optics to excite and collect light, and electronics to amplify and process signals. It explains the different types of signals detected including light scatter and fluorescence, and how these can be used to characterize cells. The document provides guidance on choosing fluorochromes and considerations for multi-color panels such as spectral overlap. It outlines some common applications of flow cytometry and contact details.


