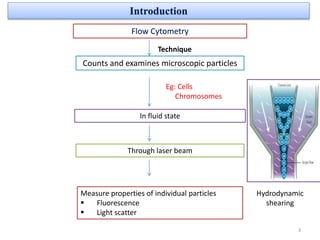
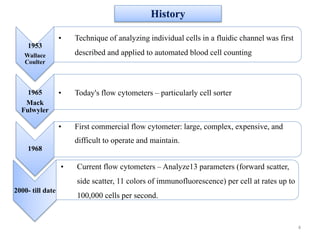
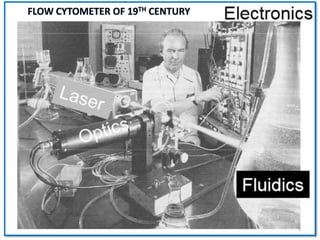
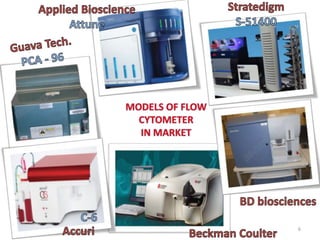
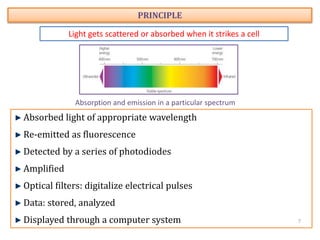
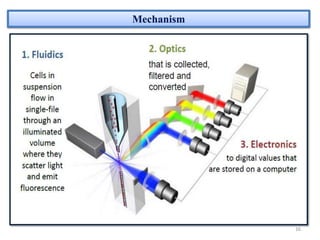
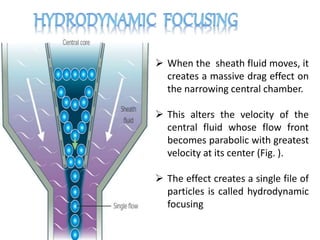
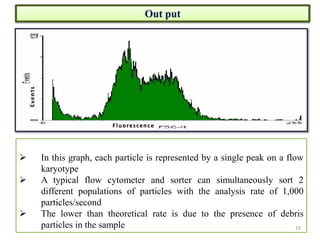
This document provides an introduction to flow cytometry. It defines flow cytometry as the measurement of physical and chemical characteristics of cells as they flow in a fluid stream through a beam of light. It describes the key components of a flow cytometer including fluidics to deliver cells to the laser, optics to excite and collect light, and electronics to amplify and process signals. It explains the different types of signals detected including light scatter and fluorescence, and how these can be used to characterize cells. The document provides guidance on choosing fluorochromes and considerations for multi-color panels such as spectral overlap. It outlines some common applications of flow cytometry and contact details.
Flow cytometry is a technique that allows for the analysis of individual cells passing in a fluid stream through a laser. Cells are labeled with fluorescent markers that are excited by the laser and detected. This allows for quantification of cell characteristics like size, granularity, and marker expression. Data is analyzed using histograms, dot plots, density plots, and contour plots. Flow cytometry has applications in fields like immunology, hematology, and cancer research by analyzing cell populations.
This document provides an overview of flow cytometry, including its history, principles, components, applications, and quality control. Flow cytometry involves measuring physical and chemical properties of cells or particles as they pass through a fluid stream. Key developments included Moldavan's early work in 1934 and the coinage of the term "flow cytometry" in the mid-1970s. The three main systems of a flow cytometer are fluidics to transport particles, optics like lasers and detectors, and electronics to convert light signals to data. Applications include clinical uses like detection of bacteria and characterization of cells and particles across many fields.
This document provides an overview of flow cytometry. It begins by defining flow cytometry as a technique for quantitative single cell analysis that counts, examines, and sorts cells based on optical properties like light scattering and fluorescence. It then describes the basic principles, components, and working of a flow cytometer. Key components include lasers, optical filters, and detectors. Cells in suspension pass through the laser one by one, with signals detected by photodiodes and photomultiplier tubes. Applications discussed include cell sorting, apoptosis analysis using markers like Annexin V and PI, and cell cycle analysis using DNA binding dyes or BrdU incorporation. Clinical uses involve hematologic malignancy diagnosis, residual disease detection, and monitoring treatments.
This document provides an overview of flow cytometry including:
- An introduction to flow cytometry techniques and applications from multiple speakers
- Descriptions of key components and parameters measured in flow cytometry like scatter, fluorescence, and fluorochromes
- Examples of flow cytometry applications in fields like cell viability, proliferation, and surface marker analysis
- A discussion of antibody conjugation methods and considerations for multi-color flow cytometry experiments
Principle and applications of flow cytometryDinesh Gangoda
Flow cytometry is a technique used to analyze physical and chemical characteristics of cells or particles in suspension as they flow in a fluid stream past a laser. It works by fluorescently labeling cells and components, then passing them in single file through a laser which detects scattered and fluorescent light. This allows for quantitative and qualitative analysis of cell populations. Properties like size, granularity, and fluorescence intensity can be measured. Main applications include immunophenotyping, cell sorting, cell cycle analysis, apoptosis analysis, and measuring intracellular calcium flux and cell proliferation in response to stimuli.
An introduction to flow cytometry- Ashwini.RAshwini R
The document provides an introduction to flow cytometry. It describes flow cytometry as a technique that allows simultaneous multiparametric analysis of physical and chemical characteristics of single cells suspended in a fluid stream. Key components of a flow cytometer include fluidics, optics, detectors, and electronics. Cells are hydrodynamically focused into a single file stream and pass through a laser beam, where light scattering and fluorescence emissions provide information about cellular properties. Photodetectors convert light signals into electrical pulses that are analyzed. Flow cytometry has various applications including immunophenotyping, cell sorting, DNA content analysis, and cell cycle/proliferation analysis.
Flow cytometry is an optical technique used to analyze physical and chemical characteristics of cells and other biological particles as they flow in a fluid stream through a beam of light. It allows for multiparameter analysis of cells based on light scattering, fluorescence, and other optical properties. Key components include a flow cell to hydrodynamically focus cells into a single file, lasers as light sources, optical collection systems, and detectors. Flow cytometry finds applications in research, clinical diagnostics, and agriculture.
This document discusses flow cytometry, which measures properties of cells as they flow through a fluid stream. It describes the principles and components of a flow cytometer, including the flow system that orders cells into a single-file stream, the optical system that illuminates cells and detects light scattering/fluorescence, and the electronic system that converts signals to digital data. The document outlines how flow cytometry is used to analyze physical/antigen characteristics of cells and identifies different cell types. It provides examples of clinical applications like leukemia diagnosis and CD4 counting in HIV/AIDS.
Flow cytometry allows for the quantitative and qualitative analysis of cell properties as cells flow in a fluid stream through a laser. Cells are labeled with fluorescent markers and pass through the laser one by one. Light scattering and fluorescence emission are converted to digital signals which provide information on cell size, granularity, and marker expression. Data is displayed as histograms, dot plots, or density plots to identify cell populations and phenotypes.
This document provides an overview of flow cytometry, including its history, components, principles, and applications. Flow cytometry involves passing cells in suspension through a laser beam to measure physical properties like size and granularity, as well as cell markers detected by fluorescent antibodies. This allows identification of cell types, lineages, and abnormalities. The document discusses sample preparation, common specimens analyzed, immunophenotyping using multiple fluorochromes, and applications like DNA content analysis, erythrocyte analysis, and reticulocyte counting.
Flow cytometry is a laser-based biophysical technology that measures physical and chemical characteristics of cells in a fluid stream, one cell at a time. Cells are fluorescently labeled and excited by lasers to emit light, which is detected and analyzed. It allows for rapid analysis of multiple cell parameters simultaneously. Flow cytometry is a powerful research tool used across many fields including immunology, molecular biology, and pathology. It is commonly used to diagnose pediatric leukemia by identifying unique cell surface markers and DNA characteristics of leukemia cells.
Flow cytometry works by passing cells in a fluid stream through a laser beam, which causes light scattering and fluorescence that is detected and analyzed. Cells are labeled with fluorescent markers and passed through the flow cell in a hydrodynamically focused stream. A laser excites the fluorescent molecules, which emit light at different wavelengths. Forward scatter detects cell size, side scatter detects internal complexity. Detectors convert light signals to digital data, which is analyzed through gating and dot plots to identify cell populations and properties. Flow cytometry allows rapid multi-parameter analysis of individual cells.
This document provides an introduction to flow cytometry. It defines flow cytometry as a method for sensing individual cells in a fluid stream as they pass through a laser beam, measuring light scattering and fluorescence. Key aspects of flow cytometry systems and methodology are described, including hydrodynamic focusing of cells, light scattering measurements, use of fluorescent markers, optical and electronic components, data acquisition and analysis techniques like gating and compensation. The history of technological developments in flow cytometry is also summarized.
FLOW CYTOMETRY, PRINCIPLE, APPLICATION, USE IN HAEMATOLOGY, COMPONENT OF FLOW CYTOMETRY, DATA INTERPRETATION, DATA ANALYSIS, CELL SHORTING ADVANTAGES AND DISADVANTAGES, IMMUNOLOGICAL CLASSIFICATION OF ACUTE
LEUKEMIA
The document provides an overview of the basic principles and components of flow cytometry. It discusses how flow cytometry works by measuring the properties of cells in fluid flow, using a combination of fluidics to introduce cells, optics to generate and collect light signals, and electronics to convert signals to digital data. Key aspects summarized include how cells are hydrodynamically focused and interrogated by light scatter and fluorescence to derive information on their size, granularity, and marker expression that can be analyzed using software.
Tandem mass spectrometry is a technique that uses two or more mass spectrometers coupled together to analyze chemical samples. There are two types - tandem in time and tandem in space. Tandem in time uses one instrument to select an ion for fragmentation and then analyze the daughter ions. Tandem in space uses separate instruments where the first selects an ion for fragmentation in the interaction cell, and the second analyzes the product ions. Common fragmentation techniques include collision induced dissociation, electron capture dissociation, and photodissociation. Tandem MS can be used to obtain product ion spectra to identify compounds or perform selected reaction monitoring for quantitative analysis.
This document provides information about mass spectrometry including definitions, principles, components, and methods of ionization. It defines mass spectrometry as a technique that ionizes chemical species and sorts them by mass-to-charge ratio. The key components of a mass spectrometer are described as the inlet system, ion source, mass analyzer, and detector. Common ionization methods like MALDI and electrospray ionization are explained in terms of how they work to ionize samples for analysis.
Microchip Electrophoresis is the new talk of the town, which revolutionize the field of electrophoresis. It is shown to be an attractive tool for time & cost saving development of a separation method for complex sample mixtures. It made possible the simultaneous separation of catecholamines and their cationic metabolites.
Flow cytometry is a technique used in cell biology that allows for the analysis of physical and chemical characteristics of cells as they flow in a fluid stream through a beam of light. It provides rapid multi-parametric analysis of cells based on light scattering, fluorescence, and other optical properties. Flow cytometry gives information about cell size, granularity, and the expression of cell surface markers or intracellular proteins through the use of fluorescent probes. It has many applications in fields like immunology, cancer research, and infectious disease.
In this presentation, you will learn everything you need to know to get started on flow cytometry. You will learn how it works, how to choose the right antibody for FACS, how to gate, and many more.
Ion chromatography is a technique used to separate and quantify ionic species through efficient peak separation. There are several types including ion-exchange, ion-exclusion, ion-pair, and ion-suppression chromatography. It is commonly used to analyze ions in foods, water quality, pharmaceuticals, and other applications. Sample preparation depends on the matrix, while analysis times typically range from 6-20 minutes. Ion chromatography systems cost approximately $35,000 and operate by pumping an eluent through a column and suppressor before detection.
The document discusses the implementation of a triple quadrupole mass spectrometry (TMS) system at BHH including its components and operating principles. It then provides details on the optimization and use of the system to develop LC-MS/MS methods for screening urine samples for drugs of abuse and developing steroid analysis services. The methods allow for the simultaneous detection of multiple analytes with high sensitivity and specificity.
The technique of flow cytometry is used to evaluate cells for a number of functions, such as cell counting, phenotyping, cell cycle analysis, and viability.
Flow cytometry allows for the quantitative and qualitative analysis of physical and chemical characteristics of cells as they flow in a fluid stream through a laser beam. It measures properties like cell size, granularity, and fluorescence. The main components are the fluidic system that orders cells into a single-file stream, the optical system that applies light and collects signals, and the electronic system that converts signals to digital data. As cells pass through the laser, they scatter and fluoresce light that is detected and analyzed to characterize cell populations and identify abnormal cells. It is used for applications like leukemia diagnosis and monitoring transplant engraftment.
This document summarizes flow cytometry, a technique used to count and examine microscopic particles suspended in fluid. It describes key components of modern flow cytometers including lasers, detectors, and computer systems that can analyze thousands of particles per second. The document outlines the principles of how each cell passes through a laser, scatters and emits light, which is detected and analyzed by software. Common applications like cell sorting, fluorescence detection using labeled antibodies, and measurable parameters are discussed. Terminology related to instrumentation, optical systems, data analysis and compensation are also introduced.
Flow cytometry allows for rapid analysis of physical and chemical characteristics of single cells. It measures properties like cell size, granularity, and surface antigens by passing single cells through a laser beam and detecting light scattering. This provides quantitative results on multiple cell parameters simultaneously. Cells are stained with fluorescent antibodies targeting specific antigens. When excited by lasers, the antibodies emit light of distinct wavelengths, allowing identification of cell types. Flow cytometry is useful for applications like phenotyping, cell cycle analysis, and measuring intracellular proteins. It requires cells in single suspension, fluorescent reagents, and a flow cytometer instrument.
Flow cytometry is a technique that allows for the measurement of physical and chemical characteristics of single cells flowing through a stream of fluid. It enables the simultaneous multiparametric analysis of thousands of cells per second. Cells are labeled with fluorescent markers and passed individually through a laser beam, where detectors measure the cells' light scattering and fluorescent properties. This information can be used to identify and sort cell subpopulations. Flow cytometry provides high-speed analysis of multiple parameters at a single-cell level and is widely used in research, clinical diagnosis, and other applications.
Flow cytometry allows for the quantitative and qualitative analysis of physical and chemical characteristics of cells and other particles. It works by passing cells in single file through a laser beam, where they scatter and fluoresce light. Detectors then measure these light signals to determine characteristics like cell size, granularity, and marker expression. Key components include a flow cell that hydrodynamically focuses cells, lasers and optical filters to excite and collect signals, and electronics to analyze resulting data. Flow cytometry finds applications in areas like immunophenotyping, disease diagnosis and monitoring treatment response.
Flow cytometry is a laser-based technology used to detect and measure physical and chemical characteristics of cells or particles. It allows for rapid analysis of multiple characteristics of cells, including size, granularity, and fluorescence intensity. The key components of a flow cytometer include lasers, optical filters, detectors, and fluidics and optics systems to analyze cells in suspension. As cells pass through the laser beam, light is scattered or absorbed, detected, and converted to digital signals for analysis. Applications include cell sorting, cell cycle analysis, and clinical diagnostics. Detection of apoptosis can be done based on changes in light scattering, membrane asymmetry detected by annexin V binding, and other markers.
Flow cytometry and fluorescence-activated cell sorting (FACS) are techniques that analyze and sort cells based on their optical and fluorescence characteristics. Flow cytometry works by passing cells in single file past a laser, detecting the light scattered and emitted. FACS allows cells to be sorted one by one into containers based on their light scattering and fluorescence properties measured using flow cytometry. The process involves hydrodynamically focusing cells into a stream, labeling with fluorescent markers, exciting with a laser, and using charged plates to deflect droplets containing sorted cells into collection tubes. These techniques are commonly used for cell analysis, sorting, and isolation in research and bioprocess applications.
The document is a 17 page paper on flow cytometry. It begins with an introduction and overview of flow cytometry, including its basic concepts, parameters measured, and how fluorescence is involved. It then reviews a research paper on microfluidic flow cytometry, summarizing the paper's introduction, theory, design of experiment, fabrication, results, and conclusions. The paper achieved over 94% accuracy compared to flow cytometry in determining the percentages of CD4+ and CD8+ T cell subpopulations in mixed samples. It demonstrates the potential for a microchip-based system to perform label-free immune cell analysis in real-time. In the future, the measurement throughput could be improved by revising the fluidic design to lower hydraulic resistance
This document provides an overview of flow cytometry and fluorescence-activated cell sorting (FACS). It describes flow cytometry as a technique for measuring physical and chemical characteristics of cells as they flow in a fluid stream, allowing for single cell analysis. FACS extends this by using fluorescence to identify cell characteristics and sort cells into separate collections based on these characteristics. The key components of a flow cytometer are described as lasers, optics including filters and detectors, fluidics to hydrodynamically focus cells, and electronics to convert optical signals to digital data. Applications including cell phenotyping, apoptosis analysis, and cell cycle analysis are discussed. Cell sorting and quantitative analysis of cell cycle phases are also summarized.
Introduction
Definition
Basic mechanism
Prerequisite of flow cytometer
Components of flow cytometry
Flow system
Optics system
Concept of scattering
Advantage
Limitation
Application
Conclusion
References
Flow cytometry definition, principle, parts, steps, types, usesGayathri Devi S
Flow cytometry is a technique that uses lasers to detect and measure physical and chemical characteristics of cells or particles in fluid suspension. Cells pass through a laser beam, which scatters light and causes fluorescence that is detected by sensors. Measurements of scattered and fluorescent light provide information about cell size, granularity, and expression of targeted proteins or nucleic acids. Flow cytometry allows rapid multi-parameter analysis of individual cells in heterogeneous populations and is widely used for clinical, research, and industrial applications.
This document provides an overview of microfluidics presented by Rajan Arora. It defines microfluidics as manipulating small amounts of fluids using channels 10-100 micrometers in size. Typical microfluidic systems are described including a DNA separation system and lab-on-a-chip for diagnosing heart attacks. The origins and history of microfluidics are discussed from Richard Feynman's 1959 talk to developments in the 1990s. Key components, physics principles, and flow mechanisms of microfluidic systems are explained. Various applications are highlighted such as lab-on-a-chip, low-cost paper and plastic-based microfluidics, and emerging uses in textiles, optofluidics and acou
The document provides an overview of characterization techniques for nanoparticles. It discusses how characterization refers to studying the features, composition, structure and properties of materials. Nanoparticles are defined as particles between 1 to 100 nanometers in at least one dimension. Their small size results in unique physical, chemical and biological properties compared to bulk materials. A variety of characterization techniques are described including optical microscopy techniques like dynamic light scattering, electron microscopy techniques like scanning electron microscopy, and other methods like photon spectroscopy. The techniques allow analyzing properties of nanoparticles like size, shape, structure and chemical composition.
Wallace Coulter developed the Coulter Principle for counting and sizing microscopic particles like blood cells in the late 1940s-early 1950s. Modern cell counters use various technologies including impedance, absorbance spectrophotometry, optics, fluorescence, conductivity, and monoclonal antibodies. Cell counters must run within specifications to provide accurate results.
Wallace Coulter developed the Coulter Principle for counting and sizing blood cells using impedance technology in the late 1940s. Modern cell counters use various technologies including impedance, absorbance spectrophotometry, optical light scattering, fluorescence, radio frequency, and monoclonal antibodies to provide complete blood cell counts, differentials, reticulocyte counts, and other parameters from small blood samples. Cell counters must operate within quality control standards to provide accurate and precise results.
DNA Barcoding of Stone Fish Uranoscopus Oligolepis: Intra Species Delineation...journal ijrtem
Abstract: The present study addresses this issue by examining the patterning of Cytochrome Oxidase I diversity in the stone fish Uranoscopus oligolepis the structurally diverse group of Family Uranoscopidae. The sequences were analyzed for their species identification using BOLD’s identification engine. The COI sequences of U. oligolepis from different geographical regions were extracted from NCBI for intra species variation analysis. All sequences were aligned using Clustal W. The sequences were trimmed using software and phylogenetic tree was constructed with bootstrap test. The results showed that the cytosine content was high (31%). The least molar concentration was observed in guanine (19.5%) and Adenine (19.6%). Thymine was the second predominant in molar concentration next to thymine which is followed by adenine. The G+C content was found to be 49.6% and A+T content was 50.4%. Leucine and Alanine content was high in the amino acid composition. From the study it is assumed that the mitochondrial gene COI can be the potential barcoding region to identify an organism up to the species level. Keywords: COI, intra species, Uranoscopus oligolepis, barcoding, phylogenetic
Flow Cytometry Training talks - part 1
This forms the first session of the Garvan Flow , Flow Cytometry Training course. this is a 1 1/2 day training course aimed at giving new and experienced researchers a better understanding of cytometry in medical and biological research.
1) Flow cytometry is used to measure multiple physical and chemical properties of cells in a fluid stream at a rate of thousands of cells per second. It is used to diagnose and classify leukemias based on antigen expression.
2) In leukemias, abnormal antigen expression patterns can include gain of antigens not normally expressed, abnormally increased or decreased levels of expression, or asynchronous antigen expression.
3) Flow cytometry utilizes light scattering and fluorescence to identify cell size, granularity, lineage, and maturation stage based on antigen expression. This immunophenotyping is essential for diagnosing and distinguishing between different types of leukemias.
This document describes the design and testing of a fiber optic probe to measure metabolic properties of human carotid plaque. The probe was designed to interrogate a small tissue volume (<1 mm3) and determine pH and lactate concentration in vitro. Monte Carlo simulations were used to optimize probe geometry for depth penetration. Several probe designs were tested and a final probe with a 50 micron source-receiver separation was chosen. Human carotid plaques were studied in vitro to validate experimental stability over 4 hours. The probe and experimental methods achieved the stability criteria of less than 0.03 pH change and 0.4°C temperature change per hour, demonstrating feasibility for optical spectroscopy of plaque metabolism.
Compositions of iron-meteorite parent bodies constrainthe structure of the pr...Sérgio Sacani
Magmatic iron-meteorite parent bodies are the earliest planetesimals in the Solar System,and they preserve information about conditions and planet-forming processes in thesolar nebula. In this study, we include comprehensive elemental compositions andfractional-crystallization modeling for iron meteorites from the cores of five differenti-ated asteroids from the inner Solar System. Together with previous results of metalliccores from the outer Solar System, we conclude that asteroidal cores from the outerSolar System have smaller sizes, elevated siderophile-element abundances, and simplercrystallization processes than those from the inner Solar System. These differences arerelated to the formation locations of the parent asteroids because the solar protoplane-tary disk varied in redox conditions, elemental distributions, and dynamics at differentheliocentric distances. Using highly siderophile-element data from iron meteorites, wereconstruct the distribution of calcium-aluminum-rich inclusions (CAIs) across theprotoplanetary disk within the first million years of Solar-System history. CAIs, the firstsolids to condense in the Solar System, formed close to the Sun. They were, however,concentrated within the outer disk and depleted within the inner disk. Future modelsof the structure and evolution of the protoplanetary disk should account for this dis-tribution pattern of CAIs.
TOPIC OF DISCUSSION: CENTRIFUGATION SLIDESHARE.pptxshubhijain836
Centrifugation is a powerful technique used in laboratories to separate components of a heterogeneous mixture based on their density. This process utilizes centrifugal force to rapidly spin samples, causing denser particles to migrate outward more quickly than lighter ones. As a result, distinct layers form within the sample tube, allowing for easy isolation and purification of target substances.
Microbial interaction
Microorganisms interacts with each other and can be physically associated with another organisms in a variety of ways.
One organism can be located on the surface of another organism as an ectobiont or located within another organism as endobiont.
Microbial interaction may be positive such as mutualism, proto-cooperation, commensalism or may be negative such as parasitism, predation or competition
Types of microbial interaction
Positive interaction: mutualism, proto-cooperation, commensalism
Negative interaction: Ammensalism (antagonism), parasitism, predation, competition
I. Mutualism:
It is defined as the relationship in which each organism in interaction gets benefits from association. It is an obligatory relationship in which mutualist and host are metabolically dependent on each other.
Mutualistic relationship is very specific where one member of association cannot be replaced by another species.
Mutualism require close physical contact between interacting organisms.
Relationship of mutualism allows organisms to exist in habitat that could not occupied by either species alone.
Mutualistic relationship between organisms allows them to act as a single organism.
Examples of mutualism:
i. Lichens:
Lichens are excellent example of mutualism.
They are the association of specific fungi and certain genus of algae. In lichen, fungal partner is called mycobiont and algal partner is called
II. Syntrophism:
It is an association in which the growth of one organism either depends on or improved by the substrate provided by another organism.
In syntrophism both organism in association gets benefits.
Compound A
Utilized by population 1
Compound B
Utilized by population 2
Compound C
utilized by both Population 1+2
Products
In this theoretical example of syntrophism, population 1 is able to utilize and metabolize compound A, forming compound B but cannot metabolize beyond compound B without co-operation of population 2. Population 2is unable to utilize compound A but it can metabolize compound B forming compound C. Then both population 1 and 2 are able to carry out metabolic reaction which leads to formation of end product that neither population could produce alone.
Examples of syntrophism:
i. Methanogenic ecosystem in sludge digester
Methane produced by methanogenic bacteria depends upon interspecies hydrogen transfer by other fermentative bacteria.
Anaerobic fermentative bacteria generate CO2 and H2 utilizing carbohydrates which is then utilized by methanogenic bacteria (Methanobacter) to produce methane.
ii. Lactobacillus arobinosus and Enterococcus faecalis:
In the minimal media, Lactobacillus arobinosus and Enterococcus faecalis are able to grow together but not alone.
The synergistic relationship between E. faecalis and L. arobinosus occurs in which E. faecalis require folic acid
BIRDS DIVERSITY OF SOOTEA BISWANATH ASSAM.ppt.pptxgoluk9330
Ahota Beel, nestled in Sootea Biswanath Assam , is celebrated for its extraordinary diversity of bird species. This wetland sanctuary supports a myriad of avian residents and migrants alike. Visitors can admire the elegant flights of migratory species such as the Northern Pintail and Eurasian Wigeon, alongside resident birds including the Asian Openbill and Pheasant-tailed Jacana. With its tranquil scenery and varied habitats, Ahota Beel offers a perfect haven for birdwatchers to appreciate and study the vibrant birdlife that thrives in this natural refuge.
Signatures of wave erosion in Titan’s coastsSérgio Sacani
The shorelines of Titan’s hydrocarbon seas trace flooded erosional landforms such as river valleys; however, it isunclear whether coastal erosion has subsequently altered these shorelines. Spacecraft observations and theo-retical models suggest that wind may cause waves to form on Titan’s seas, potentially driving coastal erosion,but the observational evidence of waves is indirect, and the processes affecting shoreline evolution on Titanremain unknown. No widely accepted framework exists for using shoreline morphology to quantitatively dis-cern coastal erosion mechanisms, even on Earth, where the dominant mechanisms are known. We combinelandscape evolution models with measurements of shoreline shape on Earth to characterize how differentcoastal erosion mechanisms affect shoreline morphology. Applying this framework to Titan, we find that theshorelines of Titan’s seas are most consistent with flooded landscapes that subsequently have been eroded bywaves, rather than a uniform erosional process or no coastal erosion, particularly if wave growth saturates atfetch lengths of tens of kilometers.
JAMES WEBB STUDY THE MASSIVE BLACK HOLE SEEDSSérgio Sacani
The pathway(s) to seeding the massive black holes (MBHs) that exist at the heart of galaxies in the present and distant Universe remains an unsolved problem. Here we categorise, describe and quantitatively discuss the formation pathways of both light and heavy seeds. We emphasise that the most recent computational models suggest that rather than a bimodal-like mass spectrum between light and heavy seeds with light at one end and heavy at the other that instead a continuum exists. Light seeds being more ubiquitous and the heavier seeds becoming less and less abundant due the rarer environmental conditions required for their formation. We therefore examine the different mechanisms that give rise to different seed mass spectrums. We show how and why the mechanisms that produce the heaviest seeds are also among the rarest events in the Universe and are hence extremely unlikely to be the seeds for the vast majority of the MBH population. We quantify, within the limits of the current large uncertainties in the seeding processes, the expected number densities of the seed mass spectrum. We argue that light seeds must be at least 103 to 105 times more numerous than heavy seeds to explain the MBH population as a whole. Based on our current understanding of the seed population this makes heavy seeds (Mseed > 103 M⊙) a significantly more likely pathway given that heavy seeds have an abundance pattern than is close to and likely in excess of 10−4 compared to light seeds. Finally, we examine the current state-of-the-art in numerical calculations and recent observations and plot a path forward for near-future advances in both domains.
Mending Clothing to Support Sustainable Fashion_CIMaR 2024.pdfSelcen Ozturkcan
Ozturkcan, S., Berndt, A., & Angelakis, A. (2024). Mending clothing to support sustainable fashion. Presented at the 31st Annual Conference by the Consortium for International Marketing Research (CIMaR), 10-13 Jun 2024, University of Gävle, Sweden.
3. Flow Cytometry
Technique
Counts and examines microscopic particles
Eg: Cells
Chromosomes
In fluid state
Measure properties of individual particles
Fluorescence
Light scatter
Through laser beam
Hydrodynamic
shearing
3
Introduction
4. History
1953
Wallace
Coulter
• Technique of analyzing individual cells in a fluidic channel was first
described and applied to automated blood cell counting
1965
Mack
Fulwyler
• Today's flow cytometers – particularly cell sorter
1968
• First commercial flow cytometer: large, complex, expensive, and
difficult to operate and maintain.
2000- till date
• Current flow cytometers – Analyze13 parameters (forward scatter,
side scatter, 11 colors of immunofluorescence) per cell at rates up to
100,000 cells per second.
4
7. Absorption and emission in a particular spectrum
Light gets scattered or absorbed when it strikes a cell
PRINCIPLE
Absorbed light of appropriate wavelength
Re-emitted as fluorescence
Detected by a series of photodiodes
Amplified
Optical filters: digitalize electrical pulses
Data: stored, analyzed
Displayed through a computer system 7
8. • Light scattering is dependent on the internal structure of the
cell, its size and shape
• Optical filters are essential to block unwanted light and
permit light of the desired wavelength to reach the photo
detector
Conti….
8
9. Fluorochrome
The process of emission follows extremely rapidly, commonly in the
order of nanoseconds is known as fluorescence.
Fluorescence
Fluorochromes are essentially dyes, which accept light energy (e.g.
from a laser) at a given wavelength and re-emit it at a longer
wavelength. These two processes are called excitation and
emission.
10.
11.
12.
13.
14. The magnitude of forward scatter is roughly proportional to the size of the cell
17. When the sheath fluid moves, it
creates a massive drag effect on
the narrowing central chamber.
This alters the velocity of the
central fluid whose flow front
becomes parabolic with greatest
velocity at its center (Fig. ).
The effect creates a single file of
particles is called hydrodynamic
focusing
18. The flow characteristics of the central fluid can be estimated
using Reynolds Number (Re):
Re = pVD/μ
Where,
D = tube diameter,
V = mean velocity of fluid,
p = density of fluid, and
μ = viscosity of fluid.
When Re < 2300, flow is always laminar. When Re > 2300, flow
can be turbulent, which accelerates diffusion.
Without hydrodynamic focusing the nozzle of the instrument
(typically 70 μm) would become blocked, and it would not be
possible to analyze one cell at a time.
19. In this graph, each particle is represented by a single peak on a flow
karyotype
A typical flow cytometer and sorter can simultaneously sort 2
different populations of particles with the analysis rate of 1,000
particles/second
The lower than theoretical rate is due to the presence of debris
particles in the sample
Out put
19
20. • Ploidy analysis
• Estimation of nuclear DNA content
• Cell-cycle analysis
• Physical mapping of genomes
• Flow cytogenetics
• Chromosome sorting (can process 1,000 intact mitotic
plant chromosomes per second)
• Screening and detection of transgenic pollens
• True-to-typeness/ Clonal fidelity
20
21. • Cell size
• Cell granularity
• Gene expression as the amount messenger RNA for a
particular gene
• Amounts of specific surface receptors
• Amounts of intracellular proteins, or transient signaling
events in living cells
21
22. Species Material n* References
Avena sativa Root meristems 21 Li et al. (2001)
Cicer arietinum Root meristems 8 Vla´c› ilova´ et al. (2002)
Haplopappus gracilis Suspension cells 2 de Laat & Blaas (1984),
de Laat & Schel (1986)
Hordeum vulgare Root meristems 7 Lysa´k et al. (1999), Lee et al. (2000)
Lycopersicon esculentum Suspension cells 12 Arumuganathan et al. (1991)
Lycopersicon pennellii Suspension cells 12 Arumuganathan et al. (1991, 1994)
Melandrium album Hairy root meristems 12 Veuskens et al. (1995), Kejnovsky et al. (2001
Nicotiana plumbaginifolia Mesophyll protoplasts 10 Conia et al. (1989)
Oryza sativa Root meristems 12 Lee & Arumuganathan (1999)
Petunia hybrida Mesophyll protoplasts 7 Conia et al. (1987)
Picea abies Root meristems 12 U¨ berall et al. (2003)
Pisum sativum Root meristems
Hairy root meristems
7
7
Gualberti et al. (1996), Neumann et al. (2002)
Secale cereale Root meristems 7 Neumann et al. (1998)
Triticum aestivum Suspension cells
Root meristems
21
21
Wang et al. (1992), Schwarzacher et al. (1997)
Lee et al. (1997), Gill et al. (1999),
Vra´na et al. (2000), Kubala´kova´ et al. (2002)
Triticum durum Root meristems 14 Kubala´kova´ et al. (2003b)
Vicia faba Root meristems 6 Lucretti et al. (1993), Doleel & Lucretti (1995)
Zea mays Root meristems 10 Lee et al. (1996, 2002) 22
24. Factors that affect the quality of the sample
Extraction buffer
Reference standard
Fluorochrome
Type of plant tissue used (chemical composition and the presence of
Anthocyanin, phenolic compounds that inhibit DNA staining)
Storage time of the plant tissue
Care in preparation
Sample analysis
24
25. 25
Extraction buffer
Function to release nuclei of intact cells
Preserving and ensuring stability and integrity of nuclei during experiment
Inhibiting activity of nucleases and providing optimal conditions for staining of DNA
TABLE 2. The most popular buffers used for preparation of nuclei suspensions
28. Sample ploidy Reference ploidy
mean position of the G1 sample peak
mean position of the G1 reference peak
Sample 2C value
DNA pg or Mbp
Reference 2C value
sample G1 peak mean
standard G1 peak mean
2. The amount of nuclear DNA of the unknown sample is calculated
as follows :
Formula for Ploidy level and DNA content esitmation of
unknown sample
1. Ploidy level of the unknown sample is calculated as follows:
28
Editor's Notes
8. Introduction to Flow Cytometry (4)
Essentially, the fluidics system consists of a central channel/core through which the sample is injected, enclosed by an outer sheath that contains faster flowing fluid. As the sheath fluid moves, it creates a massive drag effect on the narrowing central chamber. This alters the velocity of the central fluid whose flow front becomes parabolic with greatest velocity at its center and zero velocity at the wall (see Figure 1). The effect creates a single file of particles and is called hydrodynamic focusing.
Flow cytometry (ploidy determination, cell cycle analysis, DNA content per nucleus)