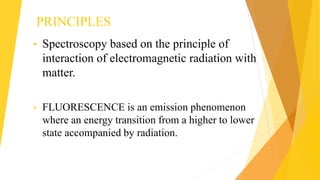
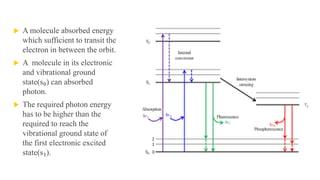
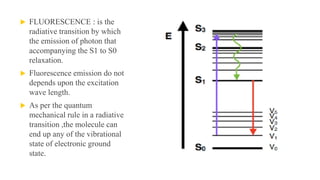
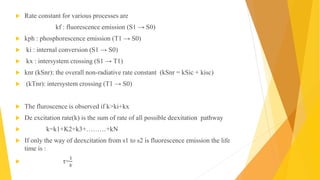
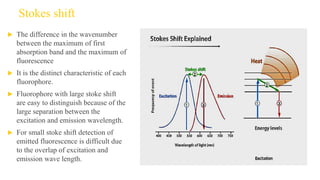
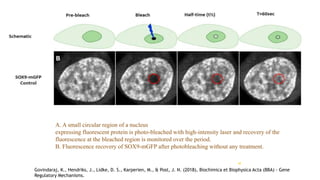
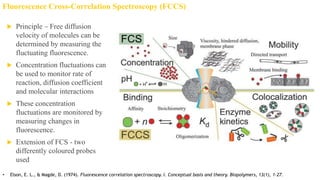
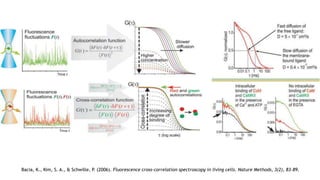
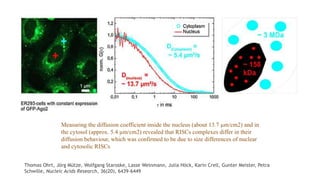
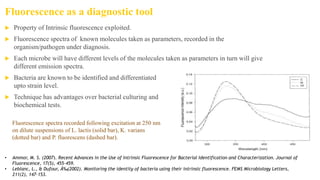
Fluorescence spectroscopy and its
applications-
Digital Assignment 1
Faculty - Dr. Podili Koteswaraiah
Movva Harsha Vardhan 18MSB0041
Arpitsen Paramar 18MSB0025
Subhasis Dash 18MSB0054
Atharva Damle 18MSB0099
Vaibhav Tiwari 18MSB0098
Contents
2
Title Slide no.
History 3-5
Introduction 6-12
Principle 13-29
Instrumentation 30-40
Applications 41-55
History of spectrum
 Newton is traditionally regarded as the founder of spectroscopy, but he was not the first
man of science who studied and reported on the solar spectrum.
 The Romans were already familiar with the ability of a prism to generate a rainbow of
colors
 His experiments demonstrated that white light could be split up into component colors
by means of a prism
 in the 1860s with the work of German physicist Gustav Kirchhoff and chemist Robert
Bunsen given a highly systematic experimental procedure to a detailed examination of
the spectra of chemical compounds.
3
Spectrometer
 In 1913, Niels Bohr discovered the emission of spectral lines by observing electrons
transitioning from different energy states within an atom. In 1937 "E. Lehrer created the
first fully-automated spectrometer" to help more accurately measure spectral lines.
4
Fluorescence spectroscopy
 It was the British scientist Sir George G. Stokes, Stokes is credited with the discovery
(1852) that fluorescence can be induced in certain substances by stimulation with
ultraviolet light.
 Fluorescence spectroscopy (also known as fluorimetry or spectrofluorometry) is a
type of electromagnetic spectroscopy that analyzes fluorescence from a sample. It
involves using a beam of light, usually ultraviolet light, that excites the electrons
in molecules of certain compounds and causes them to emit light
5
Perkin Elmer
FL-8500
INTRODUCTION
6
Overview
 Luminescence is the special character producing light with out any external energy
supply eg: sun is luminescence
 Any molecules has the characteristic of emission of light when they are supplied with
any external source like uv radiation or any electro magnetic energy this is called
fluorescence
 when the external energy is supplied some molecules emit immediate light this is
fluorescence
 Some molecules will emit the light after certain time this phenomenon is called
phosphorescence
7
Luminescence:
the emission of light with out any external energy supply to the the molecule and this by the
chemical reaction or photon absorption or any other kind of the action taken place in the molecule
normally this is used by the deep sea animals for attracting the mate or to protect from the
predator the fluorescence and phosphorescence are kind of luminescence.
Ref: Synthesis and luminescence of some rare earth metal complexes
M. N. Bochkarev Anatoly P. Pushkarev. 2016. research gate.
8
Phosphorescence:
The phosphorescence is the same phenomenon like fluorescence but the electron will stay in the high orbital for
Some more extent and losses its more energy as non light emitting radiation and this will reduces the emitting
of light when its is getting in to its ground state
Ref: Synthesis and luminescence of some rare earth metal complexes
M. N. Bochkarev Anatoly P. Pushkarev. 2016. research gate.
9
Fluorescence:
When the high energy source is focused on to the any kind of molecule the electrons present in it will get excited and
Move to its higher orbitals this high energy is not stable for the molecule so they looses the energy gained by the
Higher source and form stable.
When it is in the higher state it looses some of the energy in no radiation way according to newtons law of conservation
Of energy, the energy released during the stabilization is less than the absorbed energy this energy is different to the
different molecules
Ref:Fluorescence Microscopy in the Neurosciences
F.G. Wouterlood, A.J. Boekel . 2009., ELSEVIER.
1 mercury discharge
lamp,
2 diaphragm,
3 lens,
4 heat filter,
5 primary filter,
6 cuvette,
7 secondary filter
8 photodetector,
9 measurement at an
angle of 90° to the
incident light.
10
Principal of fluorescence spectroscopy:
The fluorescence spectroscopy works on the principal of emission of the light by the electrons that absorbed the energy
Supplied by the external source like light beam with intensity of 180 to 800 nm
Instrumentation :
Only three instruments are used
1 light beam
2 filters
3 detector
The light will be produced by the source and that will enter the filter and the required light will be selected and
passed through
The sample at the 900 angle the another filter is placed behind to this there is a detector that analyse the
information.
ref: Joseph R. Lakowicz: Principles of fluorescence spectroscopy
C Albrecht - Analytical and Bioanalytical chemistry, 2008 - Springer
11
Conclusion:
Due to its high sensitivity and selectivity, fluorescence spectroscopy is expected to remain as
one of The very revealing windows for observations on the complex biochemical reactions and
physiological processes.
For biologist, fluorescent probe remains the widely used tool to study molecules and their
interactions in vivo.
The spectroscopy has the many applications and also it is developing in to very high accuracy
technique in the analytical
Technique
12
PRINCIPLE
13
PRINCIPLES
• Spectroscopy based on the principle of
interaction of electromagnetic radiation with
matter.
• FLUORESCENCE is an emission phenomenon
where an energy transition from a higher to lower
state accompanied by radiation.
ELECROMAGNETIC
RADIATION
 Interaction of electromagnetic radiation
with matter depends on both the property
of the radiation as well as the structural
part of the sample involve.
 Electromagnetic radiation composed of
1. Electric field
2. Magnetic field
 An electromagnetic wave is an energy
wave that has both a magnetic field and
an electrical field.
 https://www.explainthatstuff.com/electromag
netic-spectrum.html
 Spectrum of electromagnetic radiation organised by increasing wavelength and
decrease in energy
 Photon is the elementary particle which responsible for electromagnetic phenomenon
 https://www.explainthatstuff.com/electromagnetic-spectrum.html
As a particle light interact with the matter by transferring its energy
𝐸 = ℎ𝑐/λ
h is planks constant(h=6.63×10⁻⁴)and v is the frequency.
 For a transition to occur in a system, energy must be absorbed.
 Electrons are distributed between several energy level in side the atom or
molecule .
 The electrons are reside in lower energy level that means at ground state
 In order to promote an electron to its higher energy level (excited state)
energy must be put into the system.
 By absorbing electromagnetic radiation energy electron are transferred from
its electronic ground state to the first electronic excited state.
ttps://chem.libretexts.org/Bookshelves/Physical_and_Theoretical_Chemistry_Textbook_Maps/Map%3A_Physical_Chemistry_(McQuarr
ie_and_Simon)/01%3A_The_Dawn_of_the_Quantum_Theory/1.3%3A_Photoelectric_Effect_Explained_with_Quantum_Hypothesis
 Absorption spectrum is the plot of absorption probability against
wavelength
 Probability of finding electron in an atom is more in its orbit. Electron in
binding orbital are usually paired with antiparallel spin orientation.
 Multiplicity(M)
M=2×S+1
Where S is the total spin of the in individual electron
 when M is 1 such a state is called singlet state ,where S=1 and a
multiplicity M is 3 such state is called Triplet state.
 According to QUANTUM MECHANICAL TRANSITION RULE
multiplicity as total spin not change during a transition
 Hence transition probability is high in S0 S1 than S0 T1
Jablonski diagram
 A molecule absorbed energy
which sufficient to transit the
electron in between the orbit.
 A molecule in its electronic
and vibrational ground
state(s₀) can absorbed
photon.
 The required photon energy
has to be higher than the
required to reach the
vibrational ground state of
the first electronic excited
state(s₁).
 The excess energy is absorbed as vibrational energy.
 VIBRATIONAL RELAXATION(NON-RADIATIVE
PROCESS): The energy deposited by the photon into
the electron is given away to other vibrational mode as
kinetic energy.
 This kinetic energy may stay within the same molecule,
or it may be transferred to other molecule around the
excited molecule during collision of the excited
molecule with the surrounding molecule.
 This relaxation process non-
radiating transition occur between
two electronic state of same spin
multiplicity is commonly known as
internal conversation(IC).
 Internal conversation occurs if the
vibrational level of the ground state
overlap with electronic excited
state.
 From s₁ internal conversion to S₀ is
possible but is less efficient than
conversion from S₂ to S₁, because
of the much larger energy gap
between S1 and S0.
 INTERSYSTEM CROSSING is a
non-radiative transition between
two isoenergetic vibrational level
belonging to electronic state of
different multiplicity.
 PHOSPHORESCENCE: is the
radiative transition from the
triplet state T1 to S0
 In solution at room temperature
non-radiative de-excitation is
predominant over
phosphorescence
 At this condition the numerous
collision with solvent molecule
favour intersystem crossing and
vibrational relaxation in s0.
 At low temperature,
phosphorescence can be
observed.
 FLUORESCENCE : is the
radiative transition by which
the emission of photon that
accompanying the S1 to S0
relaxation.
 Fluorescence emission do not
depends upon the excitation
wave length.
 As per the quantum
mechanical rule in a radiative
transition ,the molecule can
end up any of the vibrational
state of electronic ground
state.
 Radiative energy is lost in fluorescence as compare to the absorption.
 The fluorescence spectrum is located at higher wavelength than the
absorption spectrum .
 Stokes rule : The wavelength of a fluorescence emission should
always be higher than that of absorption.
 The emission of fluorescence photon is a spontaneous prosess.
 Fluorescence emission can be describe several parameters-
1. Rate constant
2. Quantum yield
3. Intensity
RATE CONSTANT
 The time a molecule spends in the excited state is determine by the
sum of the rate constant of all de-excitation process.
 Rate constant for various processes are
kf : fluorescence emission (S1 → S0)
 kph : phosphorescence emission (T1 → S0)
 ki : internal conversion (S1 → S0)
 kx : intersystem crossing (S1 → T1)
 knr (kSnr): the overall non-radiative rate constant (kSnr = kSic + kisc)
 (kTnr): intersystem crossing (T1 → S0)
 The fluroscence is observed if k>ki+kx
 De excitation rate(k) is the sum of rate of all possible deexitation pathway
 k=k1+K2+k3+………+kN
 If only the way of deexcitation from s1 to s2 is fluorescence emission the life
time is :
 τ=
1
𝑘
The fluorescence intensity
 It is defined as the amount of photon remitted per unit time per
unit volume.
I(t)=I₀.𝑒−𝑇/𝜏
 The life time τ is the time needed for the concentration of
molecular entities to decrease to 1/e of its original value.
 Fluorescence emission decrease exponentially with a
characteristic time, indicating the average lifetime of the molecule
in the s1 excited state.
Stokes shift
 The difference in the wavenumber
between the maximum of first
absorption band and the maximum of
fluorescence
 It is the distinct characteristic of each
fluorophore.
 Fluorophore with large stoke shift
are easy to distinguish because of the
large separation between the
excitation and emission wavelength.
 For small stoke shift detection of
emitted fluorescence is difficult due
to the overlap of excitation and
emission wave length.
 QUANTUM YIELD
 It is the ratio of photon emitted and photon absorbed by a
fluorophore.
 QY=
𝑃ℎ𝑜𝑡𝑜𝑛 𝑒𝑚𝑖𝑡𝑡𝑒𝑑
𝑝ℎ𝑜𝑡𝑜𝑛 𝑎𝑏𝑠𝑜𝑟𝑏𝑒𝑑
=
𝑁(𝑒𝑚)
𝑁(𝑎𝑏𝑠)
=
𝑘𝑟
𝑘
INSTRUMENTATION
30
Ultraviolet/visible spectrofluorimeter consists
of:
 Light source(lamp)
 Monochromator 1
 Sample cuvette
 Monochromator 2
 Detector
Schematic diagram of fluorescence
spectroscopy:
PHYSICAL BIOCHEMISTRY:PRINCIPLES AND APPLICATIONS, Second Edition, David Sheehan
Light Source (Lamp)
 Light sources are basically excitation
source
 Various light sources may be used lasers,
LED, and lamps; xenon arcs and mercury-
vapor lamps.
 If laser is used, monochromator is not
required as it emits light of high irradiance
at a very narrow wavelength interval,
typically under 0.01 nm.
 A xenon arc has a continuous emission
spectrum with nearly constant intensity in
the range from 300-800 nm, therefore very
useful. XENON ARC
 Commonly employed sources in fluorescence spectrometry have
spectral outputs either as a continuum of energy over a wide range
or as a series of discrete lines.
 An example of the first type is the tungsten-halogen lamp and of
the latter, a mercury lamp. Mercury lamps are the most commonly
employed line sources and have the property that their spectral
output depends upon the pressure of the filler gas.
 The output from a low-pressure mercury lamp is concentrated in
the UV range, whereas the most commonly employed lamps, of
medium and high pressure, have an output covering the whole
UV-visible spectrum.
https://www.chem.uci.edu/~dmitryf/manuals/Fundamentals/Fluorescence%20Spectroscopy.pdf
 All sources of UV radiation will produce ozone from atmospheric
oxygen, which should be dispersed, since it is not only toxic, but
also absorbs strongly in the region below 300 nm. For this reason,
most lamps will be operated in a current of air and, if the supply
fan fails, the lamp should be extinguished immediately. Lamps
must be handled with great care since fingermarks will seriously
decrease the UV output.
35
Monochromator
 A monochromator transmits light of an adjustable wavelength.
 The most common type of monochromator utilizes a diffraction
grating, that is, collimated, light illuminates a grating and exits
with a different angle depending on the wavelength. The
monochromator can then be adjusted to select which
wavelengths to transmit.
SOURCE: WIKIPEDIA
Two monochromators are used:
1. MONOCHROMATOR 1- for tuning the wavelength of the exciting
beam.
2. MONOCHROMATOR 2- for analysis of the fluorescence emission.
Due to the emitted light always having a lower energy than the exciting
light, the wavelength of the excitation monochromator is set at a lower
wavelength than the emission monochromator.
SOURCE: A biologist's guide to principles and techniques of practical biochemistry Textbook by K.
Wilson
Sample cuvette
• It is placed inside a compartment with
temperature control
• The cuvette is placed normal to the
incident beam. The resulting fluorescence
is given off equally in all directions, and
may be collected from either the front
surface of the cell, at right angles to the
incident beam, or in-line with the incident
beam.
• Cuvettes may be circular, square or
rectangular (the latter being uncommon)
• It must be constructed of a material that
will transmit both the incident and emitted
light.
https://www.chem.uci.edu/~dmitryf/manuals/Fundamentals/Fluorescence%20Spectroscopy.pdf ,
david sheenan, k.wilson
Detector
 The detector can either be single-channeled or multichanneled.
The single-channeled detector can only detect the intensity of one
wavelength at a time, while the multichanneled detects the
intensity of all wavelengths simultaneously, making the emission
monochromator or filter unnecessary.
 All commercial fluorescence instruments use photomultiplier
tubes as detectors and a wide variety of types are available. The
material from which the photocathode is made determines the
spectral range of the photomultiplier and generally two tubes are
required to cover the complete UV-visible range.
Introduction to Fluorescence Spectroscopy Ashutosh Sharma, Stephen G. Schulman
Wiley, 21-May-1999
READ- OUT DEVICES
 The output from the detector is amplified and displayed on a
readout device which may be a meter or digital display.
 It should be possible to change the sensitivity of the amplifier in
a series of discrete steps so that samples of widely differing
concentration can be compared.
 Microprocessor electronics provide outputs directly compatible
with printer systems and computers, eliminating any possibility of
operator error in transferring data.
DEPT OF CHEMISTRY
UNIVERSITY OF CALIFONIA
https://www.chem.uci.edu/~dmitryf/manuals/Fundamentals/Fluorescence%20Spectroscopy.pdf
APPLICATIONS
41
Fluorescence resonance energy transfer (FRET)
 Fluorescence resonance energy transfer (FRET) works on a
mechanism describing energy transfer between two light-
sensitive molecules (chromophores)
 Donor Chromophore – Electronic excited state.
 In the near-field region, the excited chromophore emits a
virtual photon that is instantly absorbed by a receiving
chromophore.
 These virtual photons are undetectable, since their existence
violates the conservation of energy and momentum, and
hence FRET is known as a radiationless mechanism
 Highly Affected by distance
 Used for –
 used to measure distances between domains in a single protein and therefore to provide
information about protein conformation
 can also detect interaction between proteins
 FRET has been used to detect the location and interactions of genes and cellular
structures including integrins and membrane proteins
 FRET can be used to obtain information about metabolic or signaling pathways
Helms, Volkhard (2008). "Fluorescence Resonance Energy Transfer". Principles of Computational Cell Biology. Weinheim:
Wiley-VCH. p. 202. ISBN 978-3-527-31555-0.
Bioluminescence resonance energy transfer (BRET)
• A limitation of FRET performed with fluorophore donors is the
requirement for external illumination to initiate the fluorescence
transfer, which can lead to background noise in the results from
direct excitation of the acceptor or to photobleaching
• To avoid this drawback, bioluminescence resonance energy
transfer (or BRET) has been developed
• Uses a bioluminescent luciferase rather than CFP to produce an
initial photon emission compatible with YFP
• Implemented using a different luciferase enzyme, engineered
from the deep-sea shrimp Oplophorus gracilirostris
• This luciferase is smaller (19 kD) and brighter than the more
commonly used luciferase from Renilla reniformis
Szöllősi, János; Alexander, Denis R. (2007). In Klumpp, Susanne; Krieglstein, Josef. Protein Phosphatases. Methods in Enzymology, Volume 366. Amsterdam:
Elsevier. pp. 203–224
Detection of Viruses
 Tryptophan which is fluorophore in UV is present in both viruses and host bacterial protein
 Tryptophan structural environment is not same within proteins and this structural difference is responsible for
specific spectroscopic signatures
Alimova, Alexandra, et al. "Virus Particles Monitored by Fluorescence Spectroscopy: A Potential Detection Assay for Macromolecular Assembly."
Photochemistry and photobiology 80.1 (2004): 41-46.
Protein-ligand interaction.
Fiber-optic sensors
• Optical fibers provide a passive means of transporting light
from one location to another due to which many conventional
spectroscopic techniques can be carried out with fiber-optic
sensors
• Fluorescence-based fiber-optic sensors have been described
for blood pH, pC02, bilirubin, pO2, metal ions, glucose, and
biomaterials
• The most exciting sensors are those directed toward the
determination of bioactive molecules.
• Eg - Determination of human immunoglobulin G (IgG)
Shahzad, Aamir, et al. "Emerging applications of fluorescence spectroscopy in medical
microbiology field." Journal of translational medicine 7.1 (2009): 99.
Fluorescence Recovery After Photobleaching (FRAP)
• Fluorescent-tagged molecules
• Photobleaching by high intensity laser
• Recovery of fluorescence and
increase in intensity monitored in relation
to time
• Process can be visualized using
microscope
• To study membrane dynamics,
protein mobility and transport in cells
48
A. A small circular region of a nucleus
expressing fluorescent protein is photo-bleached with high-intensity laser and recovery of the
fluorescence at the bleached region is monitored over the period.
B. Fluorescence recovery of SOX9-mGFP after photobleaching without any treatment.
Govindaraj, K., Hendriks, J., Lidke, D. S., Karperien, M., & Post, J. N. (2018), Biochimica et Biophysica Acta (BBA) - Gene
Regulatory Mechanisms.
Fluorescence Cross-Correlation Spectroscopy (FCCS)
 Principle – Free diffusion
velocity of molecules can be
determined by measuring the
fluctuating fluorescence.
 Concentration fluctuations can
be used to monitor rate of
reaction, diffusion coefficient
and molecular interactions
 These concentration
fluctuations are monitored by
measuring changes in
fluorescence.
 Extension of FCS - two
differently coloured probes
used
• Elson, E. L., & Magde, D. (1974). Fluorescence correlation spectroscopy. I. Conceptual basis and theory. Biopolymers, 13(1), 1–27.
Bacia, K., Kim, S. A., & Schwille, P. (2006). Fluorescence cross-correlation spectroscopy in living cells. Nature Methods, 3(2), 83–89.
Thomas Ohrt, Jörg Mütze, Wolfgang Staroske, Lasse Weinmann, Julia Höck, Karin Crell, Gunter Meister, Petra
Schwille, Nucleic Acids Research, 36(20), 6439–6449
Measuring the diffusion coefficient inside the nucleus (about 13.7 µm/cm2) and in
the cytosol (approx. 5.4 µm/cm2) revealed that RISCs complexes differ in their
diffusion behaviour, which was confirmed to be due to size differences of nuclear
and cytosolic RISCs
Fluorescence in Food Analysis
 FITC labelled antibodies against identification of
bacteria in food samples.
 DEFT used to count bacteria in milk samples using
acridine orange.
 Fluorescence spectrometer connected inline with
HPLC used to detect, identify and quantify
aflatoxins exploiting their intrinsic fluorescence
properties. ex - 360 nm for all four aflatoxins (em -
440 nm for aflatoxins B1 and B2 and 470 nm for
aflatoxins G1 and G2).
 Detection of food additives like antibiotic, flavours,
aspartame, etc.
Nakai, S., & Horimoto, Y. (2000). Fluorescence Spectroscopy in Food Analysis. Encyclopedia of Analytical Chemistry.
Fluorometric Assays
1. ATP-lite assay
 Cytotoxicity assay
 Cell survival-death analysis
 Light emitted measured by
luminometer
2. ELFA
 Enzyme linked Fluorescent Assay
 p-phenylhydroxyacetic acid converted into a
fluorescent product by HRP
 Short substrate incubation time, higher sensitivity,
higher stability of fluorescent product
https://www.promega.in/products/cell-health-assays/cell-viability-and-cytotoxicity-assays/celltiter_glo-luminescent-cell-viability-assay/?catNum=G7570
Sawant, P. , Kshar, A. , Byakodi, R. , & Paranjpe, A. (2014). Immunofluorescence in Oral Mucosal Diseases –A Review. Oral Surgery, Oral Medicine,
Oral Radiology, 2(1), 6-10.
Fluorescence as a diagnostic tool
 Property of Intrinsic fluorescence exploited.
 Fluorescence spectra of known molecules taken as parameters, recorded in the
organism/pathogen under diagnosis.
 Each microbe will have different levels of the molecules taken as parameters in turn will give
different emission spectra.
 Bacteria are known to be identified and differentiated
upto strain level.
 Technique has advantages over bacterial culturing and
biochemical tests.
• Ammor, M. S. (2007). Recent Advances in the Use of Intrinsic Fluorescence for Bacterial Identification and Characterization. Journal of
Fluorescence, 17(5), 455–459.
• Leblanc, L., & Dufour, É(2002). Monitoring the identity of bacteria using their intrinsic fluorescence. FEMS Microbiology Letters,
211(2), 147–153.
Fluorescence spectra recorded following excitation at 250 nm
on dilute suspensions of L. lactis (solid bar), K. varians
(dotted bar) and P. fluorescens (dashed bar).
Fluorescence as a Therapeutic Tool-Photodynamic Therapy
 Non invasive therapeutic strategy for treatment of acne, sun damage, cancer.
 Use of a photosensitizer drug which is activated by irradiation. (5-aminolevulinic acid)
 Electrons in PS in triplet state interact with substrate to create superoxide, hydroxide radicals or
singlet oxygen.
 Advantages over radiotherapy and chemotherapy such as high target specificity and lower side-
effects
Schematic illustration of
(a) the basic mechanism of PDT
(b) The general procedure for PDT in a
clinical setting.
Li, X., Lee, S., & Yoon, J. (2018). Supramolecular photosensitizers rejuvenate photodynamic therapy. Chemical Society Reviews, 47(4),
1174–1188.
THANK YOU
56

Fluorescence

  • 1.
    Fluorescence spectroscopy andits applications- Digital Assignment 1 Faculty - Dr. Podili Koteswaraiah Movva Harsha Vardhan 18MSB0041 Arpitsen Paramar 18MSB0025 Subhasis Dash 18MSB0054 Atharva Damle 18MSB0099 Vaibhav Tiwari 18MSB0098
  • 2.
    Contents 2 Title Slide no. History3-5 Introduction 6-12 Principle 13-29 Instrumentation 30-40 Applications 41-55
  • 3.
    History of spectrum Newton is traditionally regarded as the founder of spectroscopy, but he was not the first man of science who studied and reported on the solar spectrum.  The Romans were already familiar with the ability of a prism to generate a rainbow of colors  His experiments demonstrated that white light could be split up into component colors by means of a prism  in the 1860s with the work of German physicist Gustav Kirchhoff and chemist Robert Bunsen given a highly systematic experimental procedure to a detailed examination of the spectra of chemical compounds. 3
  • 4.
    Spectrometer  In 1913,Niels Bohr discovered the emission of spectral lines by observing electrons transitioning from different energy states within an atom. In 1937 "E. Lehrer created the first fully-automated spectrometer" to help more accurately measure spectral lines. 4
  • 5.
    Fluorescence spectroscopy  Itwas the British scientist Sir George G. Stokes, Stokes is credited with the discovery (1852) that fluorescence can be induced in certain substances by stimulation with ultraviolet light.  Fluorescence spectroscopy (also known as fluorimetry or spectrofluorometry) is a type of electromagnetic spectroscopy that analyzes fluorescence from a sample. It involves using a beam of light, usually ultraviolet light, that excites the electrons in molecules of certain compounds and causes them to emit light 5 Perkin Elmer FL-8500
  • 6.
  • 7.
    Overview  Luminescence isthe special character producing light with out any external energy supply eg: sun is luminescence  Any molecules has the characteristic of emission of light when they are supplied with any external source like uv radiation or any electro magnetic energy this is called fluorescence  when the external energy is supplied some molecules emit immediate light this is fluorescence  Some molecules will emit the light after certain time this phenomenon is called phosphorescence 7
  • 8.
    Luminescence: the emission oflight with out any external energy supply to the the molecule and this by the chemical reaction or photon absorption or any other kind of the action taken place in the molecule normally this is used by the deep sea animals for attracting the mate or to protect from the predator the fluorescence and phosphorescence are kind of luminescence. Ref: Synthesis and luminescence of some rare earth metal complexes M. N. Bochkarev Anatoly P. Pushkarev. 2016. research gate. 8
  • 9.
    Phosphorescence: The phosphorescence isthe same phenomenon like fluorescence but the electron will stay in the high orbital for Some more extent and losses its more energy as non light emitting radiation and this will reduces the emitting of light when its is getting in to its ground state Ref: Synthesis and luminescence of some rare earth metal complexes M. N. Bochkarev Anatoly P. Pushkarev. 2016. research gate. 9
  • 10.
    Fluorescence: When the highenergy source is focused on to the any kind of molecule the electrons present in it will get excited and Move to its higher orbitals this high energy is not stable for the molecule so they looses the energy gained by the Higher source and form stable. When it is in the higher state it looses some of the energy in no radiation way according to newtons law of conservation Of energy, the energy released during the stabilization is less than the absorbed energy this energy is different to the different molecules Ref:Fluorescence Microscopy in the Neurosciences F.G. Wouterlood, A.J. Boekel . 2009., ELSEVIER. 1 mercury discharge lamp, 2 diaphragm, 3 lens, 4 heat filter, 5 primary filter, 6 cuvette, 7 secondary filter 8 photodetector, 9 measurement at an angle of 90° to the incident light. 10
  • 11.
    Principal of fluorescencespectroscopy: The fluorescence spectroscopy works on the principal of emission of the light by the electrons that absorbed the energy Supplied by the external source like light beam with intensity of 180 to 800 nm Instrumentation : Only three instruments are used 1 light beam 2 filters 3 detector The light will be produced by the source and that will enter the filter and the required light will be selected and passed through The sample at the 900 angle the another filter is placed behind to this there is a detector that analyse the information. ref: Joseph R. Lakowicz: Principles of fluorescence spectroscopy C Albrecht - Analytical and Bioanalytical chemistry, 2008 - Springer 11
  • 12.
    Conclusion: Due to itshigh sensitivity and selectivity, fluorescence spectroscopy is expected to remain as one of The very revealing windows for observations on the complex biochemical reactions and physiological processes. For biologist, fluorescent probe remains the widely used tool to study molecules and their interactions in vivo. The spectroscopy has the many applications and also it is developing in to very high accuracy technique in the analytical Technique 12
  • 13.
  • 14.
    PRINCIPLES • Spectroscopy basedon the principle of interaction of electromagnetic radiation with matter. • FLUORESCENCE is an emission phenomenon where an energy transition from a higher to lower state accompanied by radiation.
  • 15.
    ELECROMAGNETIC RADIATION  Interaction ofelectromagnetic radiation with matter depends on both the property of the radiation as well as the structural part of the sample involve.  Electromagnetic radiation composed of 1. Electric field 2. Magnetic field  An electromagnetic wave is an energy wave that has both a magnetic field and an electrical field.  https://www.explainthatstuff.com/electromag netic-spectrum.html
  • 16.
     Spectrum ofelectromagnetic radiation organised by increasing wavelength and decrease in energy  Photon is the elementary particle which responsible for electromagnetic phenomenon  https://www.explainthatstuff.com/electromagnetic-spectrum.html
  • 17.
    As a particlelight interact with the matter by transferring its energy 𝐸 = ℎ𝑐/λ h is planks constant(h=6.63×10⁻⁴)and v is the frequency.  For a transition to occur in a system, energy must be absorbed.  Electrons are distributed between several energy level in side the atom or molecule .  The electrons are reside in lower energy level that means at ground state  In order to promote an electron to its higher energy level (excited state) energy must be put into the system.  By absorbing electromagnetic radiation energy electron are transferred from its electronic ground state to the first electronic excited state. ttps://chem.libretexts.org/Bookshelves/Physical_and_Theoretical_Chemistry_Textbook_Maps/Map%3A_Physical_Chemistry_(McQuarr ie_and_Simon)/01%3A_The_Dawn_of_the_Quantum_Theory/1.3%3A_Photoelectric_Effect_Explained_with_Quantum_Hypothesis
  • 18.
     Absorption spectrumis the plot of absorption probability against wavelength  Probability of finding electron in an atom is more in its orbit. Electron in binding orbital are usually paired with antiparallel spin orientation.  Multiplicity(M) M=2×S+1 Where S is the total spin of the in individual electron  when M is 1 such a state is called singlet state ,where S=1 and a multiplicity M is 3 such state is called Triplet state.  According to QUANTUM MECHANICAL TRANSITION RULE multiplicity as total spin not change during a transition  Hence transition probability is high in S0 S1 than S0 T1
  • 19.
  • 20.
     A moleculeabsorbed energy which sufficient to transit the electron in between the orbit.  A molecule in its electronic and vibrational ground state(s₀) can absorbed photon.  The required photon energy has to be higher than the required to reach the vibrational ground state of the first electronic excited state(s₁).
  • 21.
     The excessenergy is absorbed as vibrational energy.  VIBRATIONAL RELAXATION(NON-RADIATIVE PROCESS): The energy deposited by the photon into the electron is given away to other vibrational mode as kinetic energy.  This kinetic energy may stay within the same molecule, or it may be transferred to other molecule around the excited molecule during collision of the excited molecule with the surrounding molecule.
  • 22.
     This relaxationprocess non- radiating transition occur between two electronic state of same spin multiplicity is commonly known as internal conversation(IC).  Internal conversation occurs if the vibrational level of the ground state overlap with electronic excited state.  From s₁ internal conversion to S₀ is possible but is less efficient than conversion from S₂ to S₁, because of the much larger energy gap between S1 and S0.  INTERSYSTEM CROSSING is a non-radiative transition between two isoenergetic vibrational level belonging to electronic state of different multiplicity.
  • 23.
     PHOSPHORESCENCE: isthe radiative transition from the triplet state T1 to S0  In solution at room temperature non-radiative de-excitation is predominant over phosphorescence  At this condition the numerous collision with solvent molecule favour intersystem crossing and vibrational relaxation in s0.  At low temperature, phosphorescence can be observed.
  • 24.
     FLUORESCENCE :is the radiative transition by which the emission of photon that accompanying the S1 to S0 relaxation.  Fluorescence emission do not depends upon the excitation wave length.  As per the quantum mechanical rule in a radiative transition ,the molecule can end up any of the vibrational state of electronic ground state.
  • 25.
     Radiative energyis lost in fluorescence as compare to the absorption.  The fluorescence spectrum is located at higher wavelength than the absorption spectrum .  Stokes rule : The wavelength of a fluorescence emission should always be higher than that of absorption.  The emission of fluorescence photon is a spontaneous prosess.  Fluorescence emission can be describe several parameters- 1. Rate constant 2. Quantum yield 3. Intensity RATE CONSTANT  The time a molecule spends in the excited state is determine by the sum of the rate constant of all de-excitation process.
  • 26.
     Rate constantfor various processes are kf : fluorescence emission (S1 → S0)  kph : phosphorescence emission (T1 → S0)  ki : internal conversion (S1 → S0)  kx : intersystem crossing (S1 → T1)  knr (kSnr): the overall non-radiative rate constant (kSnr = kSic + kisc)  (kTnr): intersystem crossing (T1 → S0)  The fluroscence is observed if k>ki+kx  De excitation rate(k) is the sum of rate of all possible deexitation pathway  k=k1+K2+k3+………+kN  If only the way of deexcitation from s1 to s2 is fluorescence emission the life time is :  τ= 1 𝑘
  • 27.
    The fluorescence intensity It is defined as the amount of photon remitted per unit time per unit volume. I(t)=I₀.𝑒−𝑇/𝜏  The life time τ is the time needed for the concentration of molecular entities to decrease to 1/e of its original value.  Fluorescence emission decrease exponentially with a characteristic time, indicating the average lifetime of the molecule in the s1 excited state.
  • 28.
    Stokes shift  Thedifference in the wavenumber between the maximum of first absorption band and the maximum of fluorescence  It is the distinct characteristic of each fluorophore.  Fluorophore with large stoke shift are easy to distinguish because of the large separation between the excitation and emission wavelength.  For small stoke shift detection of emitted fluorescence is difficult due to the overlap of excitation and emission wave length.
  • 29.
     QUANTUM YIELD It is the ratio of photon emitted and photon absorbed by a fluorophore.  QY= 𝑃ℎ𝑜𝑡𝑜𝑛 𝑒𝑚𝑖𝑡𝑡𝑒𝑑 𝑝ℎ𝑜𝑡𝑜𝑛 𝑎𝑏𝑠𝑜𝑟𝑏𝑒𝑑 = 𝑁(𝑒𝑚) 𝑁(𝑎𝑏𝑠) = 𝑘𝑟 𝑘
  • 30.
  • 31.
    Ultraviolet/visible spectrofluorimeter consists of: Light source(lamp)  Monochromator 1  Sample cuvette  Monochromator 2  Detector
  • 32.
    Schematic diagram offluorescence spectroscopy: PHYSICAL BIOCHEMISTRY:PRINCIPLES AND APPLICATIONS, Second Edition, David Sheehan
  • 33.
    Light Source (Lamp) Light sources are basically excitation source  Various light sources may be used lasers, LED, and lamps; xenon arcs and mercury- vapor lamps.  If laser is used, monochromator is not required as it emits light of high irradiance at a very narrow wavelength interval, typically under 0.01 nm.  A xenon arc has a continuous emission spectrum with nearly constant intensity in the range from 300-800 nm, therefore very useful. XENON ARC
  • 34.
     Commonly employedsources in fluorescence spectrometry have spectral outputs either as a continuum of energy over a wide range or as a series of discrete lines.  An example of the first type is the tungsten-halogen lamp and of the latter, a mercury lamp. Mercury lamps are the most commonly employed line sources and have the property that their spectral output depends upon the pressure of the filler gas.  The output from a low-pressure mercury lamp is concentrated in the UV range, whereas the most commonly employed lamps, of medium and high pressure, have an output covering the whole UV-visible spectrum. https://www.chem.uci.edu/~dmitryf/manuals/Fundamentals/Fluorescence%20Spectroscopy.pdf
  • 35.
     All sourcesof UV radiation will produce ozone from atmospheric oxygen, which should be dispersed, since it is not only toxic, but also absorbs strongly in the region below 300 nm. For this reason, most lamps will be operated in a current of air and, if the supply fan fails, the lamp should be extinguished immediately. Lamps must be handled with great care since fingermarks will seriously decrease the UV output. 35
  • 36.
    Monochromator  A monochromatortransmits light of an adjustable wavelength.  The most common type of monochromator utilizes a diffraction grating, that is, collimated, light illuminates a grating and exits with a different angle depending on the wavelength. The monochromator can then be adjusted to select which wavelengths to transmit. SOURCE: WIKIPEDIA
  • 37.
    Two monochromators areused: 1. MONOCHROMATOR 1- for tuning the wavelength of the exciting beam. 2. MONOCHROMATOR 2- for analysis of the fluorescence emission. Due to the emitted light always having a lower energy than the exciting light, the wavelength of the excitation monochromator is set at a lower wavelength than the emission monochromator. SOURCE: A biologist's guide to principles and techniques of practical biochemistry Textbook by K. Wilson
  • 38.
    Sample cuvette • Itis placed inside a compartment with temperature control • The cuvette is placed normal to the incident beam. The resulting fluorescence is given off equally in all directions, and may be collected from either the front surface of the cell, at right angles to the incident beam, or in-line with the incident beam. • Cuvettes may be circular, square or rectangular (the latter being uncommon) • It must be constructed of a material that will transmit both the incident and emitted light. https://www.chem.uci.edu/~dmitryf/manuals/Fundamentals/Fluorescence%20Spectroscopy.pdf , david sheenan, k.wilson
  • 39.
    Detector  The detectorcan either be single-channeled or multichanneled. The single-channeled detector can only detect the intensity of one wavelength at a time, while the multichanneled detects the intensity of all wavelengths simultaneously, making the emission monochromator or filter unnecessary.  All commercial fluorescence instruments use photomultiplier tubes as detectors and a wide variety of types are available. The material from which the photocathode is made determines the spectral range of the photomultiplier and generally two tubes are required to cover the complete UV-visible range. Introduction to Fluorescence Spectroscopy Ashutosh Sharma, Stephen G. Schulman Wiley, 21-May-1999
  • 40.
    READ- OUT DEVICES The output from the detector is amplified and displayed on a readout device which may be a meter or digital display.  It should be possible to change the sensitivity of the amplifier in a series of discrete steps so that samples of widely differing concentration can be compared.  Microprocessor electronics provide outputs directly compatible with printer systems and computers, eliminating any possibility of operator error in transferring data. DEPT OF CHEMISTRY UNIVERSITY OF CALIFONIA https://www.chem.uci.edu/~dmitryf/manuals/Fundamentals/Fluorescence%20Spectroscopy.pdf
  • 41.
  • 42.
    Fluorescence resonance energytransfer (FRET)  Fluorescence resonance energy transfer (FRET) works on a mechanism describing energy transfer between two light- sensitive molecules (chromophores)  Donor Chromophore – Electronic excited state.  In the near-field region, the excited chromophore emits a virtual photon that is instantly absorbed by a receiving chromophore.  These virtual photons are undetectable, since their existence violates the conservation of energy and momentum, and hence FRET is known as a radiationless mechanism  Highly Affected by distance
  • 43.
     Used for–  used to measure distances between domains in a single protein and therefore to provide information about protein conformation  can also detect interaction between proteins  FRET has been used to detect the location and interactions of genes and cellular structures including integrins and membrane proteins  FRET can be used to obtain information about metabolic or signaling pathways Helms, Volkhard (2008). "Fluorescence Resonance Energy Transfer". Principles of Computational Cell Biology. Weinheim: Wiley-VCH. p. 202. ISBN 978-3-527-31555-0.
  • 44.
    Bioluminescence resonance energytransfer (BRET) • A limitation of FRET performed with fluorophore donors is the requirement for external illumination to initiate the fluorescence transfer, which can lead to background noise in the results from direct excitation of the acceptor or to photobleaching • To avoid this drawback, bioluminescence resonance energy transfer (or BRET) has been developed • Uses a bioluminescent luciferase rather than CFP to produce an initial photon emission compatible with YFP • Implemented using a different luciferase enzyme, engineered from the deep-sea shrimp Oplophorus gracilirostris • This luciferase is smaller (19 kD) and brighter than the more commonly used luciferase from Renilla reniformis Szöllősi, János; Alexander, Denis R. (2007). In Klumpp, Susanne; Krieglstein, Josef. Protein Phosphatases. Methods in Enzymology, Volume 366. Amsterdam: Elsevier. pp. 203–224
  • 45.
    Detection of Viruses Tryptophan which is fluorophore in UV is present in both viruses and host bacterial protein  Tryptophan structural environment is not same within proteins and this structural difference is responsible for specific spectroscopic signatures Alimova, Alexandra, et al. "Virus Particles Monitored by Fluorescence Spectroscopy: A Potential Detection Assay for Macromolecular Assembly." Photochemistry and photobiology 80.1 (2004): 41-46.
  • 46.
    Protein-ligand interaction. Fiber-optic sensors •Optical fibers provide a passive means of transporting light from one location to another due to which many conventional spectroscopic techniques can be carried out with fiber-optic sensors • Fluorescence-based fiber-optic sensors have been described for blood pH, pC02, bilirubin, pO2, metal ions, glucose, and biomaterials • The most exciting sensors are those directed toward the determination of bioactive molecules. • Eg - Determination of human immunoglobulin G (IgG) Shahzad, Aamir, et al. "Emerging applications of fluorescence spectroscopy in medical microbiology field." Journal of translational medicine 7.1 (2009): 99.
  • 47.
    Fluorescence Recovery AfterPhotobleaching (FRAP) • Fluorescent-tagged molecules • Photobleaching by high intensity laser • Recovery of fluorescence and increase in intensity monitored in relation to time • Process can be visualized using microscope • To study membrane dynamics, protein mobility and transport in cells
  • 48.
    48 A. A smallcircular region of a nucleus expressing fluorescent protein is photo-bleached with high-intensity laser and recovery of the fluorescence at the bleached region is monitored over the period. B. Fluorescence recovery of SOX9-mGFP after photobleaching without any treatment. Govindaraj, K., Hendriks, J., Lidke, D. S., Karperien, M., & Post, J. N. (2018), Biochimica et Biophysica Acta (BBA) - Gene Regulatory Mechanisms.
  • 49.
    Fluorescence Cross-Correlation Spectroscopy(FCCS)  Principle – Free diffusion velocity of molecules can be determined by measuring the fluctuating fluorescence.  Concentration fluctuations can be used to monitor rate of reaction, diffusion coefficient and molecular interactions  These concentration fluctuations are monitored by measuring changes in fluorescence.  Extension of FCS - two differently coloured probes used • Elson, E. L., & Magde, D. (1974). Fluorescence correlation spectroscopy. I. Conceptual basis and theory. Biopolymers, 13(1), 1–27.
  • 50.
    Bacia, K., Kim,S. A., & Schwille, P. (2006). Fluorescence cross-correlation spectroscopy in living cells. Nature Methods, 3(2), 83–89.
  • 51.
    Thomas Ohrt, JörgMütze, Wolfgang Staroske, Lasse Weinmann, Julia Höck, Karin Crell, Gunter Meister, Petra Schwille, Nucleic Acids Research, 36(20), 6439–6449 Measuring the diffusion coefficient inside the nucleus (about 13.7 µm/cm2) and in the cytosol (approx. 5.4 µm/cm2) revealed that RISCs complexes differ in their diffusion behaviour, which was confirmed to be due to size differences of nuclear and cytosolic RISCs
  • 52.
    Fluorescence in FoodAnalysis  FITC labelled antibodies against identification of bacteria in food samples.  DEFT used to count bacteria in milk samples using acridine orange.  Fluorescence spectrometer connected inline with HPLC used to detect, identify and quantify aflatoxins exploiting their intrinsic fluorescence properties. ex - 360 nm for all four aflatoxins (em - 440 nm for aflatoxins B1 and B2 and 470 nm for aflatoxins G1 and G2).  Detection of food additives like antibiotic, flavours, aspartame, etc. Nakai, S., & Horimoto, Y. (2000). Fluorescence Spectroscopy in Food Analysis. Encyclopedia of Analytical Chemistry.
  • 53.
    Fluorometric Assays 1. ATP-liteassay  Cytotoxicity assay  Cell survival-death analysis  Light emitted measured by luminometer 2. ELFA  Enzyme linked Fluorescent Assay  p-phenylhydroxyacetic acid converted into a fluorescent product by HRP  Short substrate incubation time, higher sensitivity, higher stability of fluorescent product https://www.promega.in/products/cell-health-assays/cell-viability-and-cytotoxicity-assays/celltiter_glo-luminescent-cell-viability-assay/?catNum=G7570 Sawant, P. , Kshar, A. , Byakodi, R. , & Paranjpe, A. (2014). Immunofluorescence in Oral Mucosal Diseases –A Review. Oral Surgery, Oral Medicine, Oral Radiology, 2(1), 6-10.
  • 54.
    Fluorescence as adiagnostic tool  Property of Intrinsic fluorescence exploited.  Fluorescence spectra of known molecules taken as parameters, recorded in the organism/pathogen under diagnosis.  Each microbe will have different levels of the molecules taken as parameters in turn will give different emission spectra.  Bacteria are known to be identified and differentiated upto strain level.  Technique has advantages over bacterial culturing and biochemical tests. • Ammor, M. S. (2007). Recent Advances in the Use of Intrinsic Fluorescence for Bacterial Identification and Characterization. Journal of Fluorescence, 17(5), 455–459. • Leblanc, L., & Dufour, É(2002). Monitoring the identity of bacteria using their intrinsic fluorescence. FEMS Microbiology Letters, 211(2), 147–153. Fluorescence spectra recorded following excitation at 250 nm on dilute suspensions of L. lactis (solid bar), K. varians (dotted bar) and P. fluorescens (dashed bar).
  • 55.
    Fluorescence as aTherapeutic Tool-Photodynamic Therapy  Non invasive therapeutic strategy for treatment of acne, sun damage, cancer.  Use of a photosensitizer drug which is activated by irradiation. (5-aminolevulinic acid)  Electrons in PS in triplet state interact with substrate to create superoxide, hydroxide radicals or singlet oxygen.  Advantages over radiotherapy and chemotherapy such as high target specificity and lower side- effects Schematic illustration of (a) the basic mechanism of PDT (b) The general procedure for PDT in a clinical setting. Li, X., Lee, S., & Yoon, J. (2018). Supramolecular photosensitizers rejuvenate photodynamic therapy. Chemical Society Reviews, 47(4), 1174–1188.
  • 56.