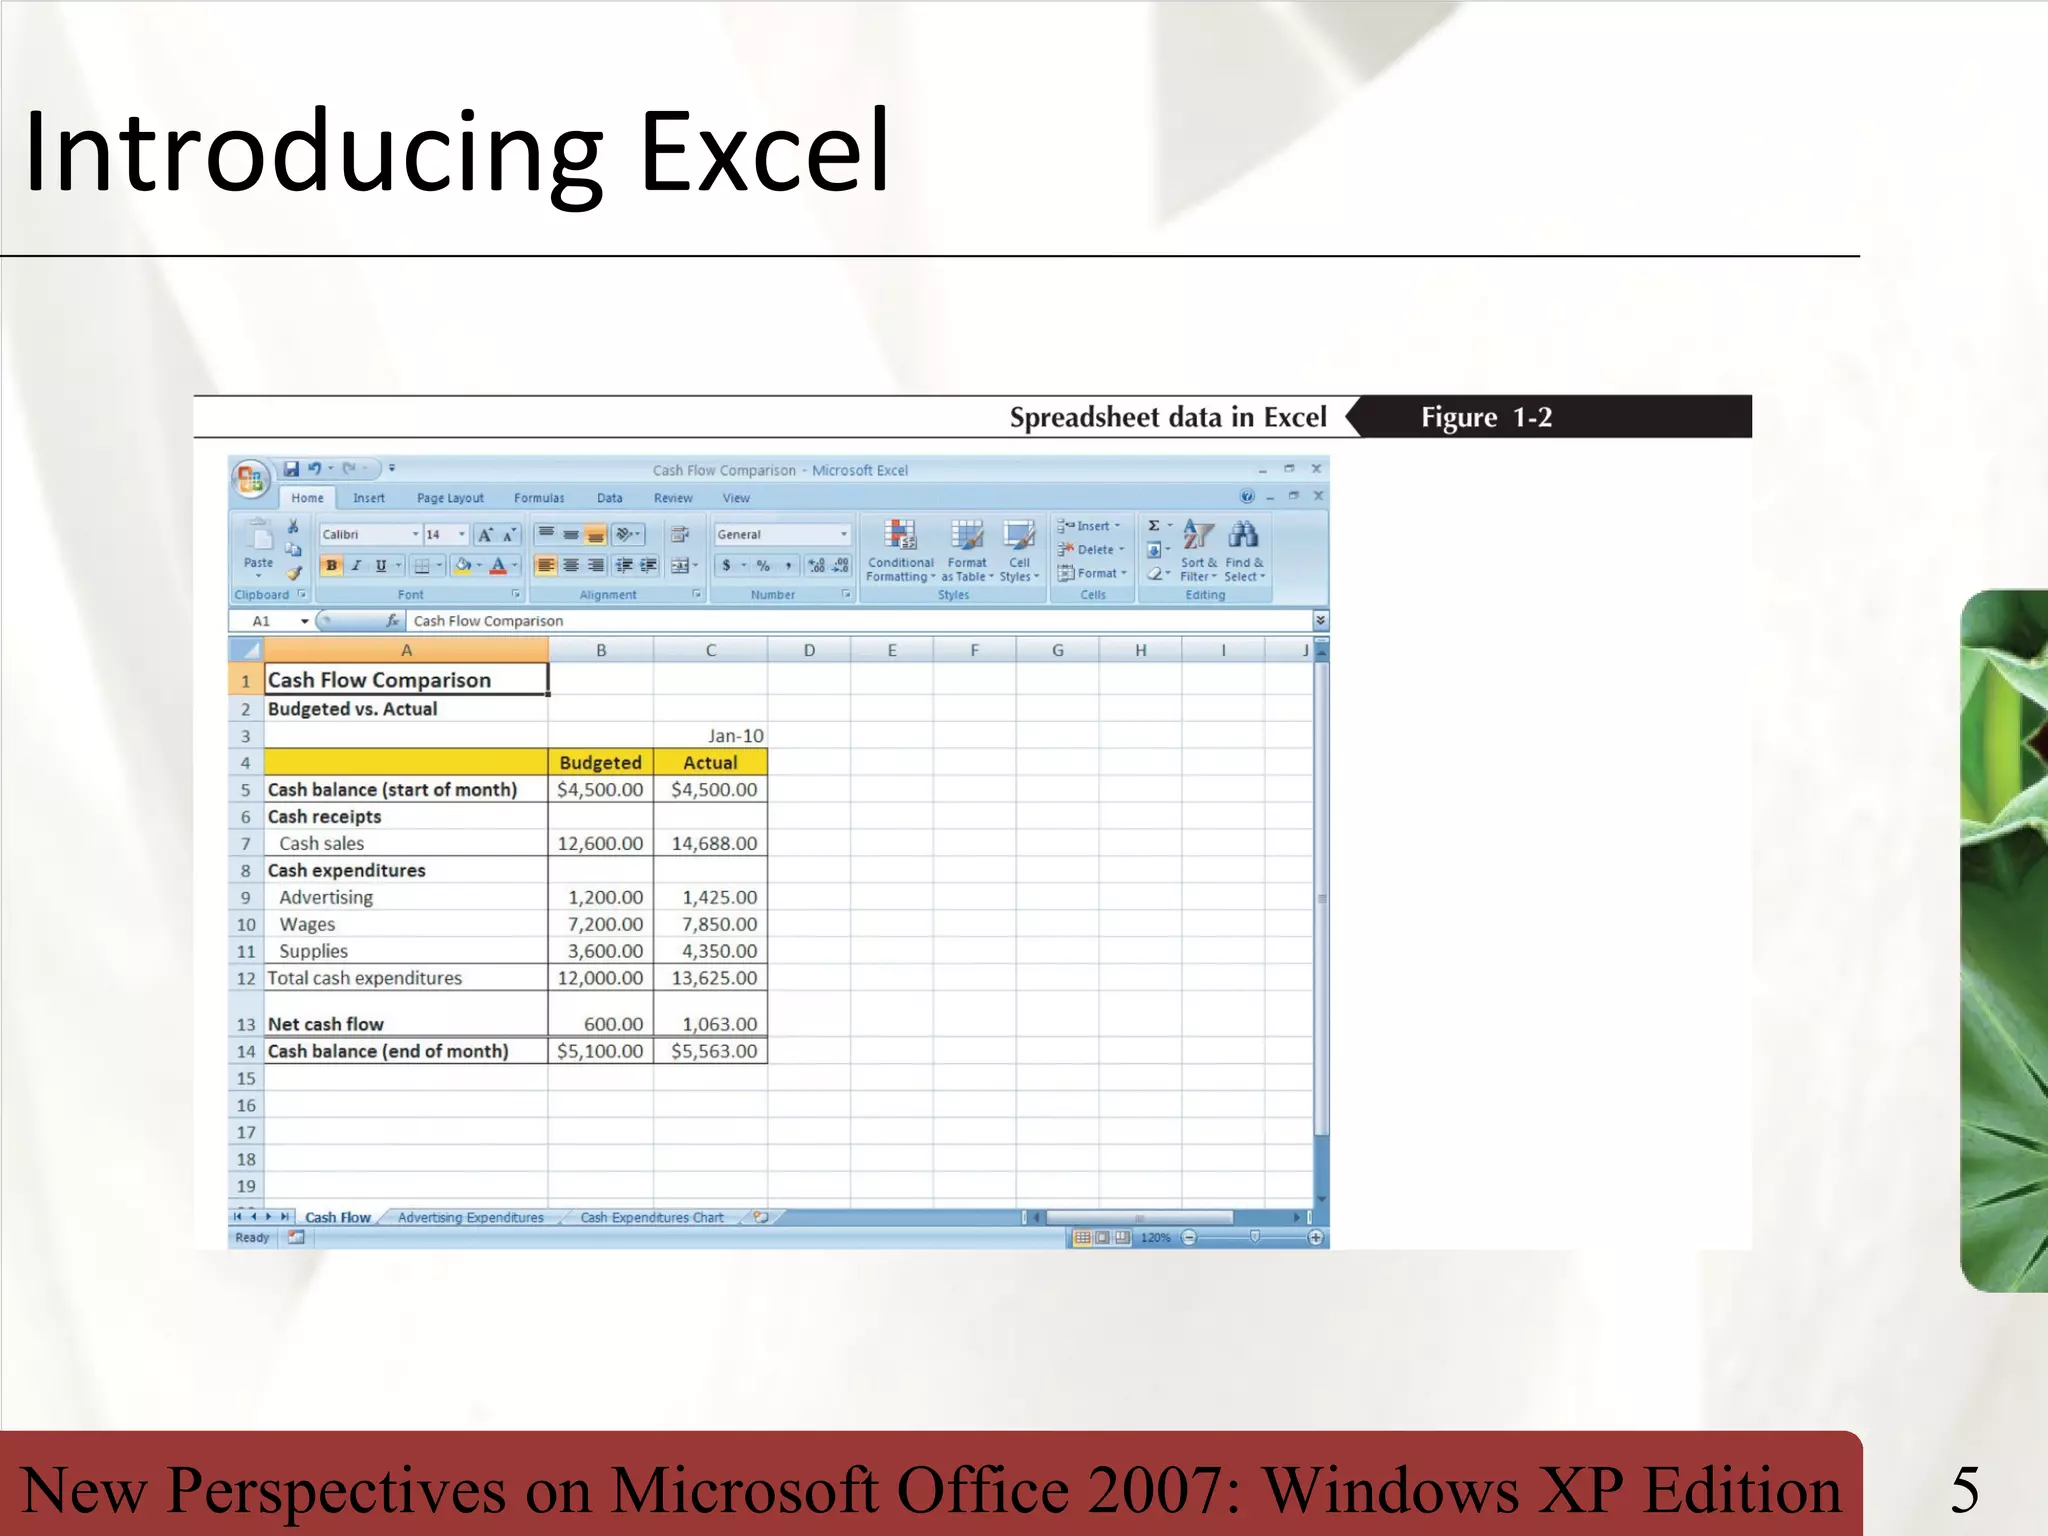
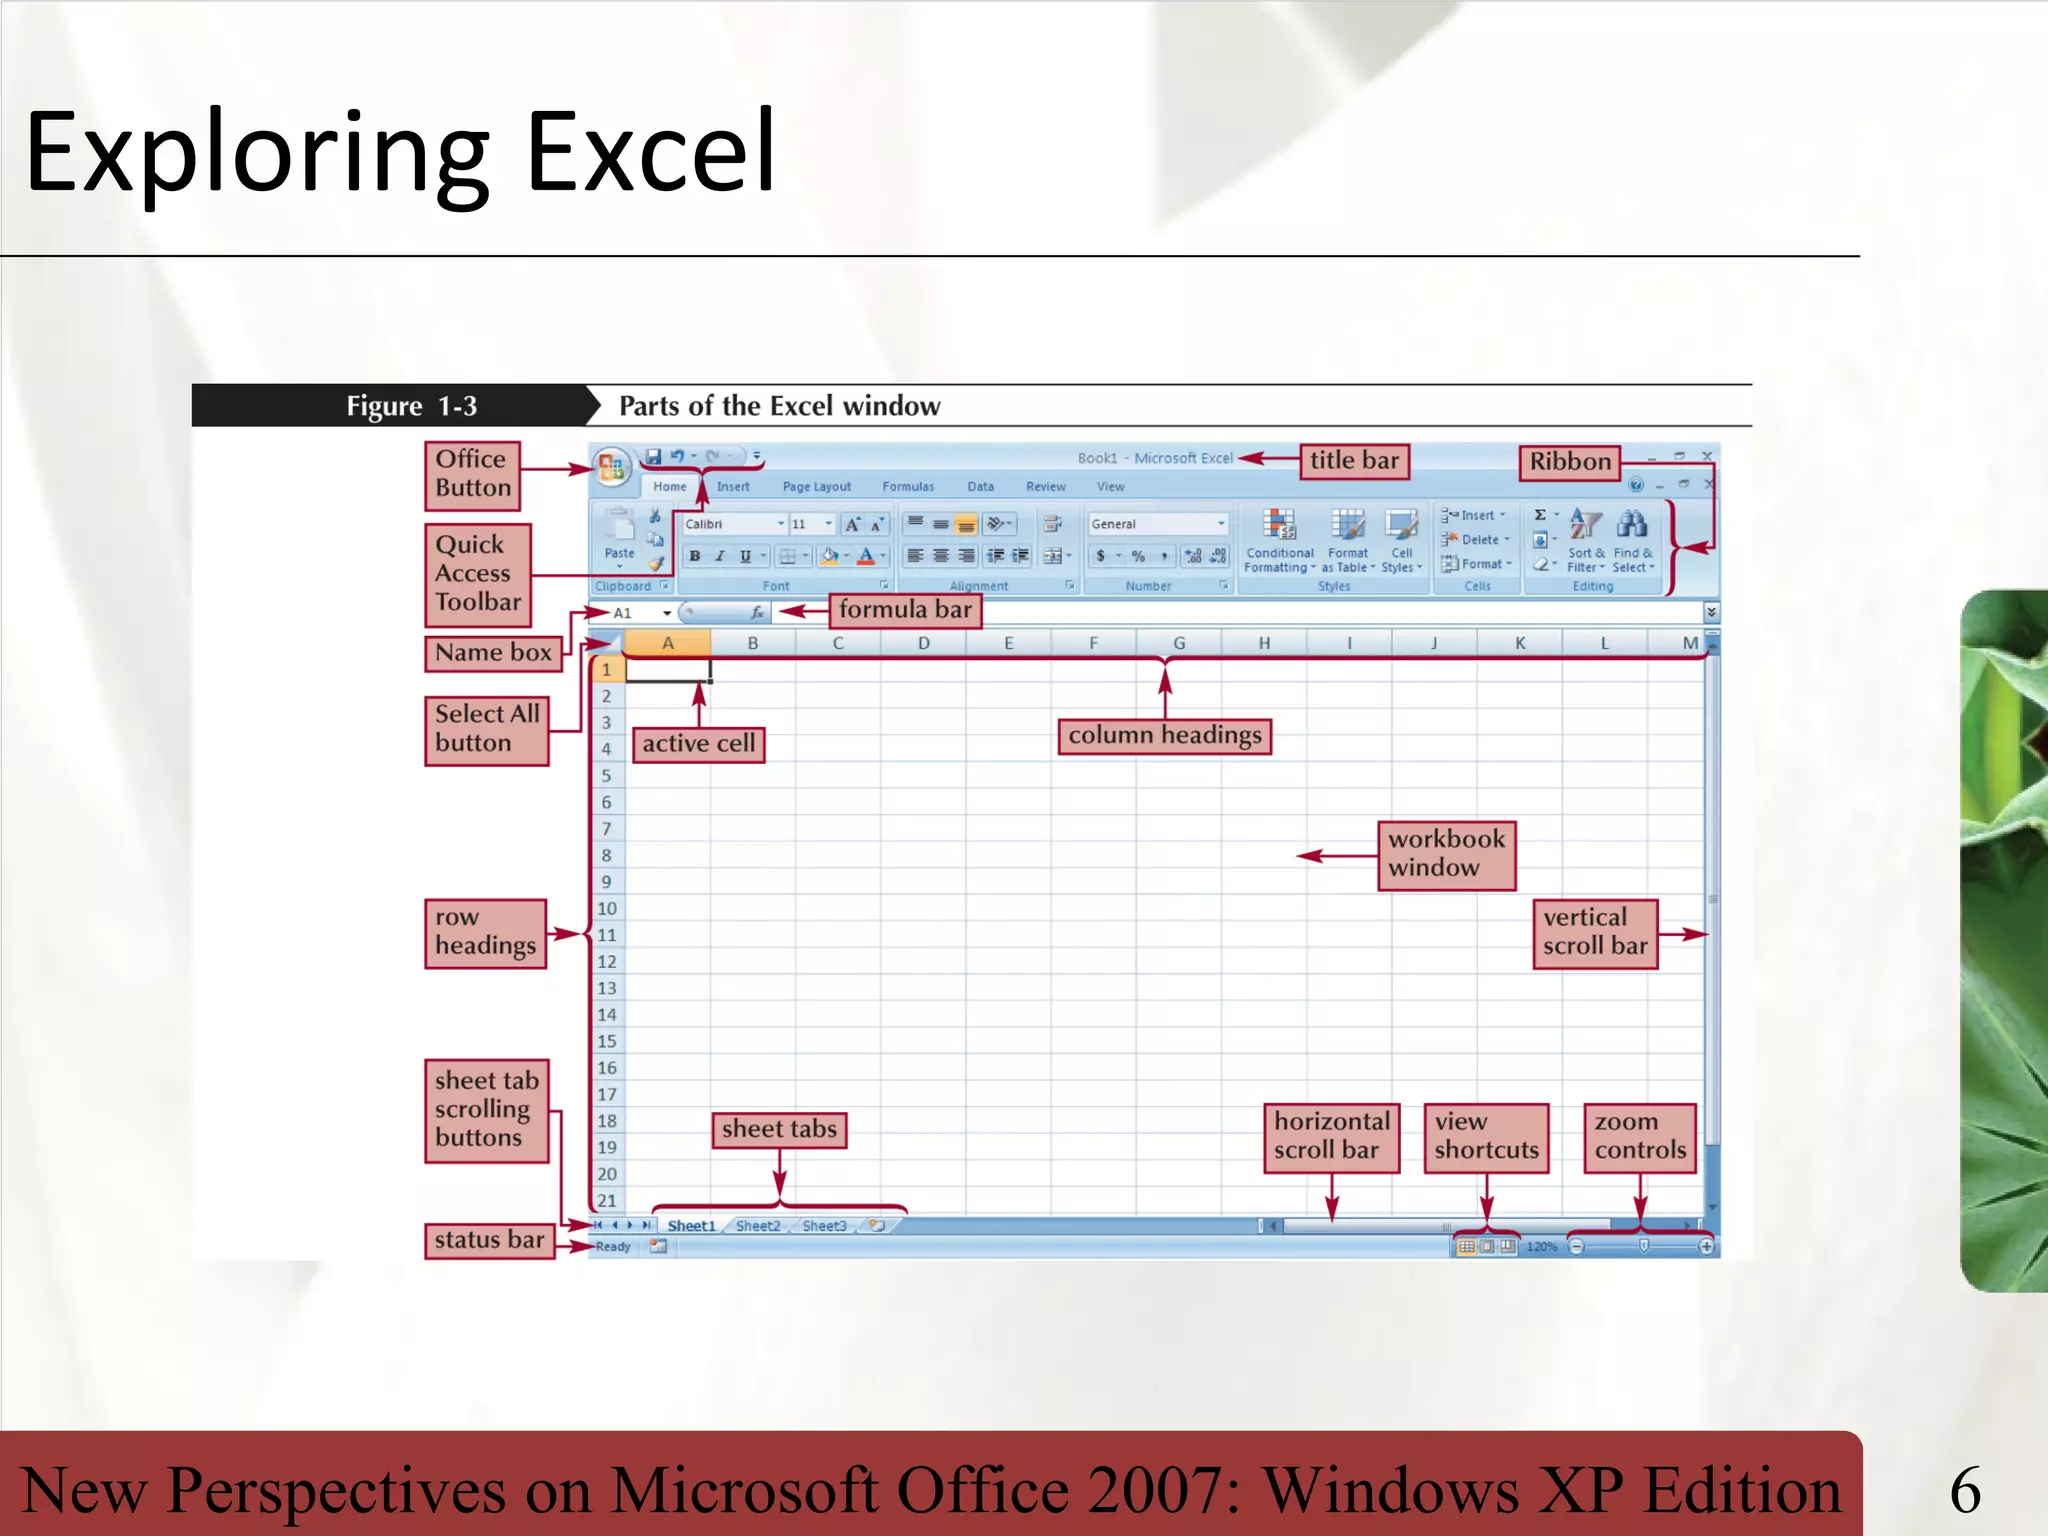
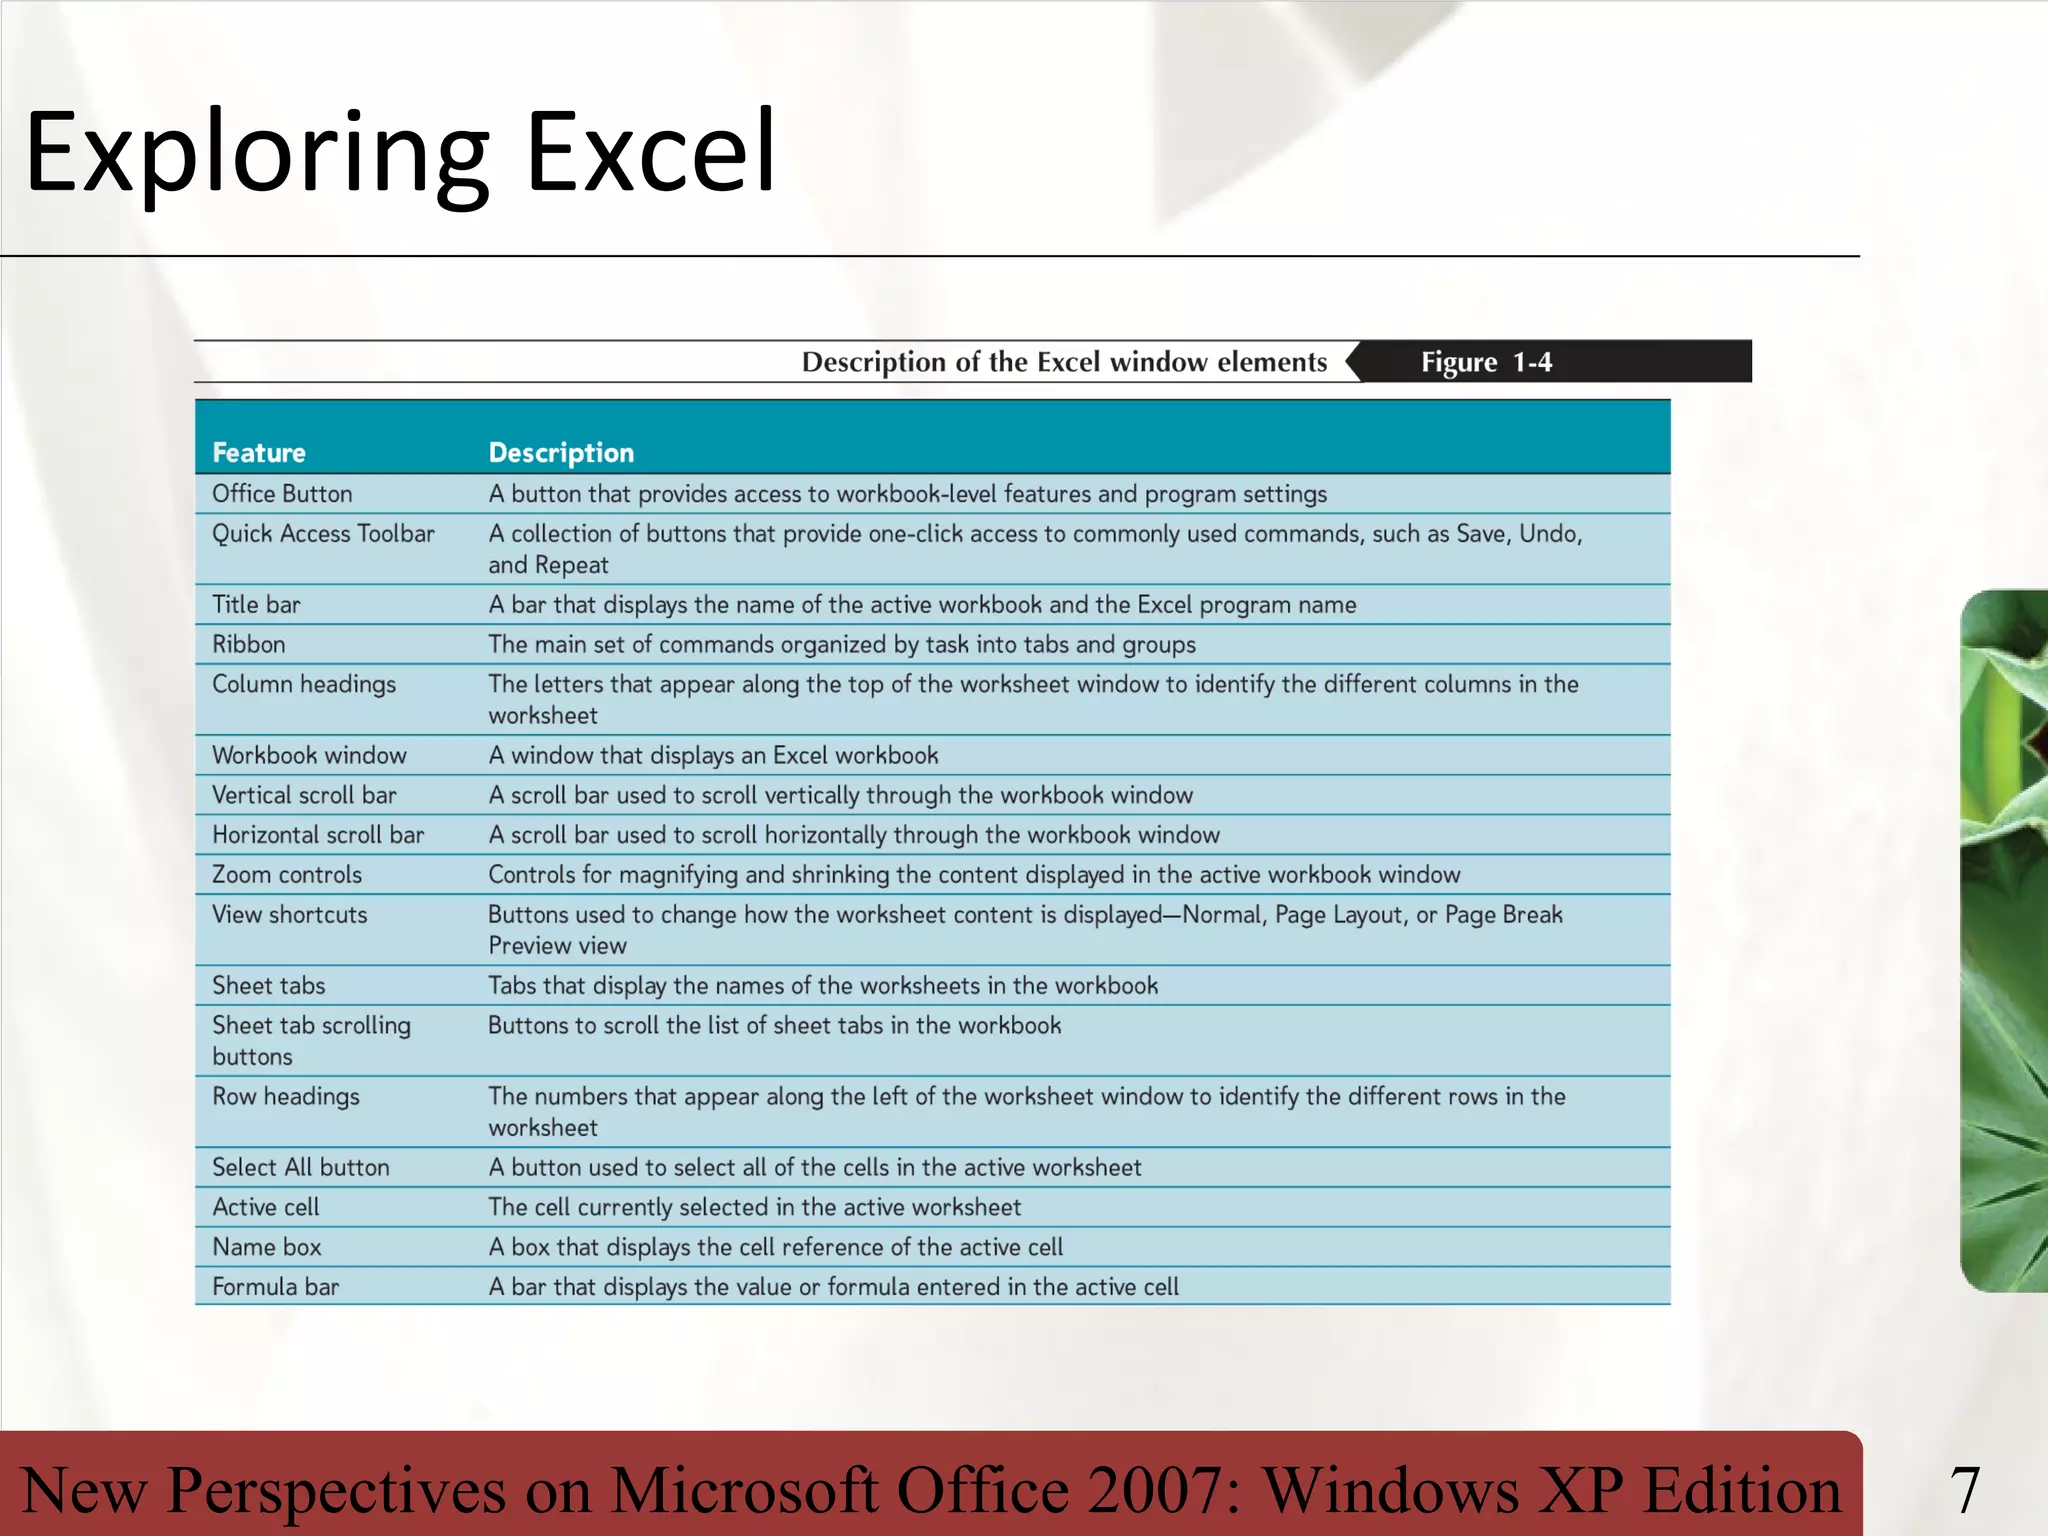
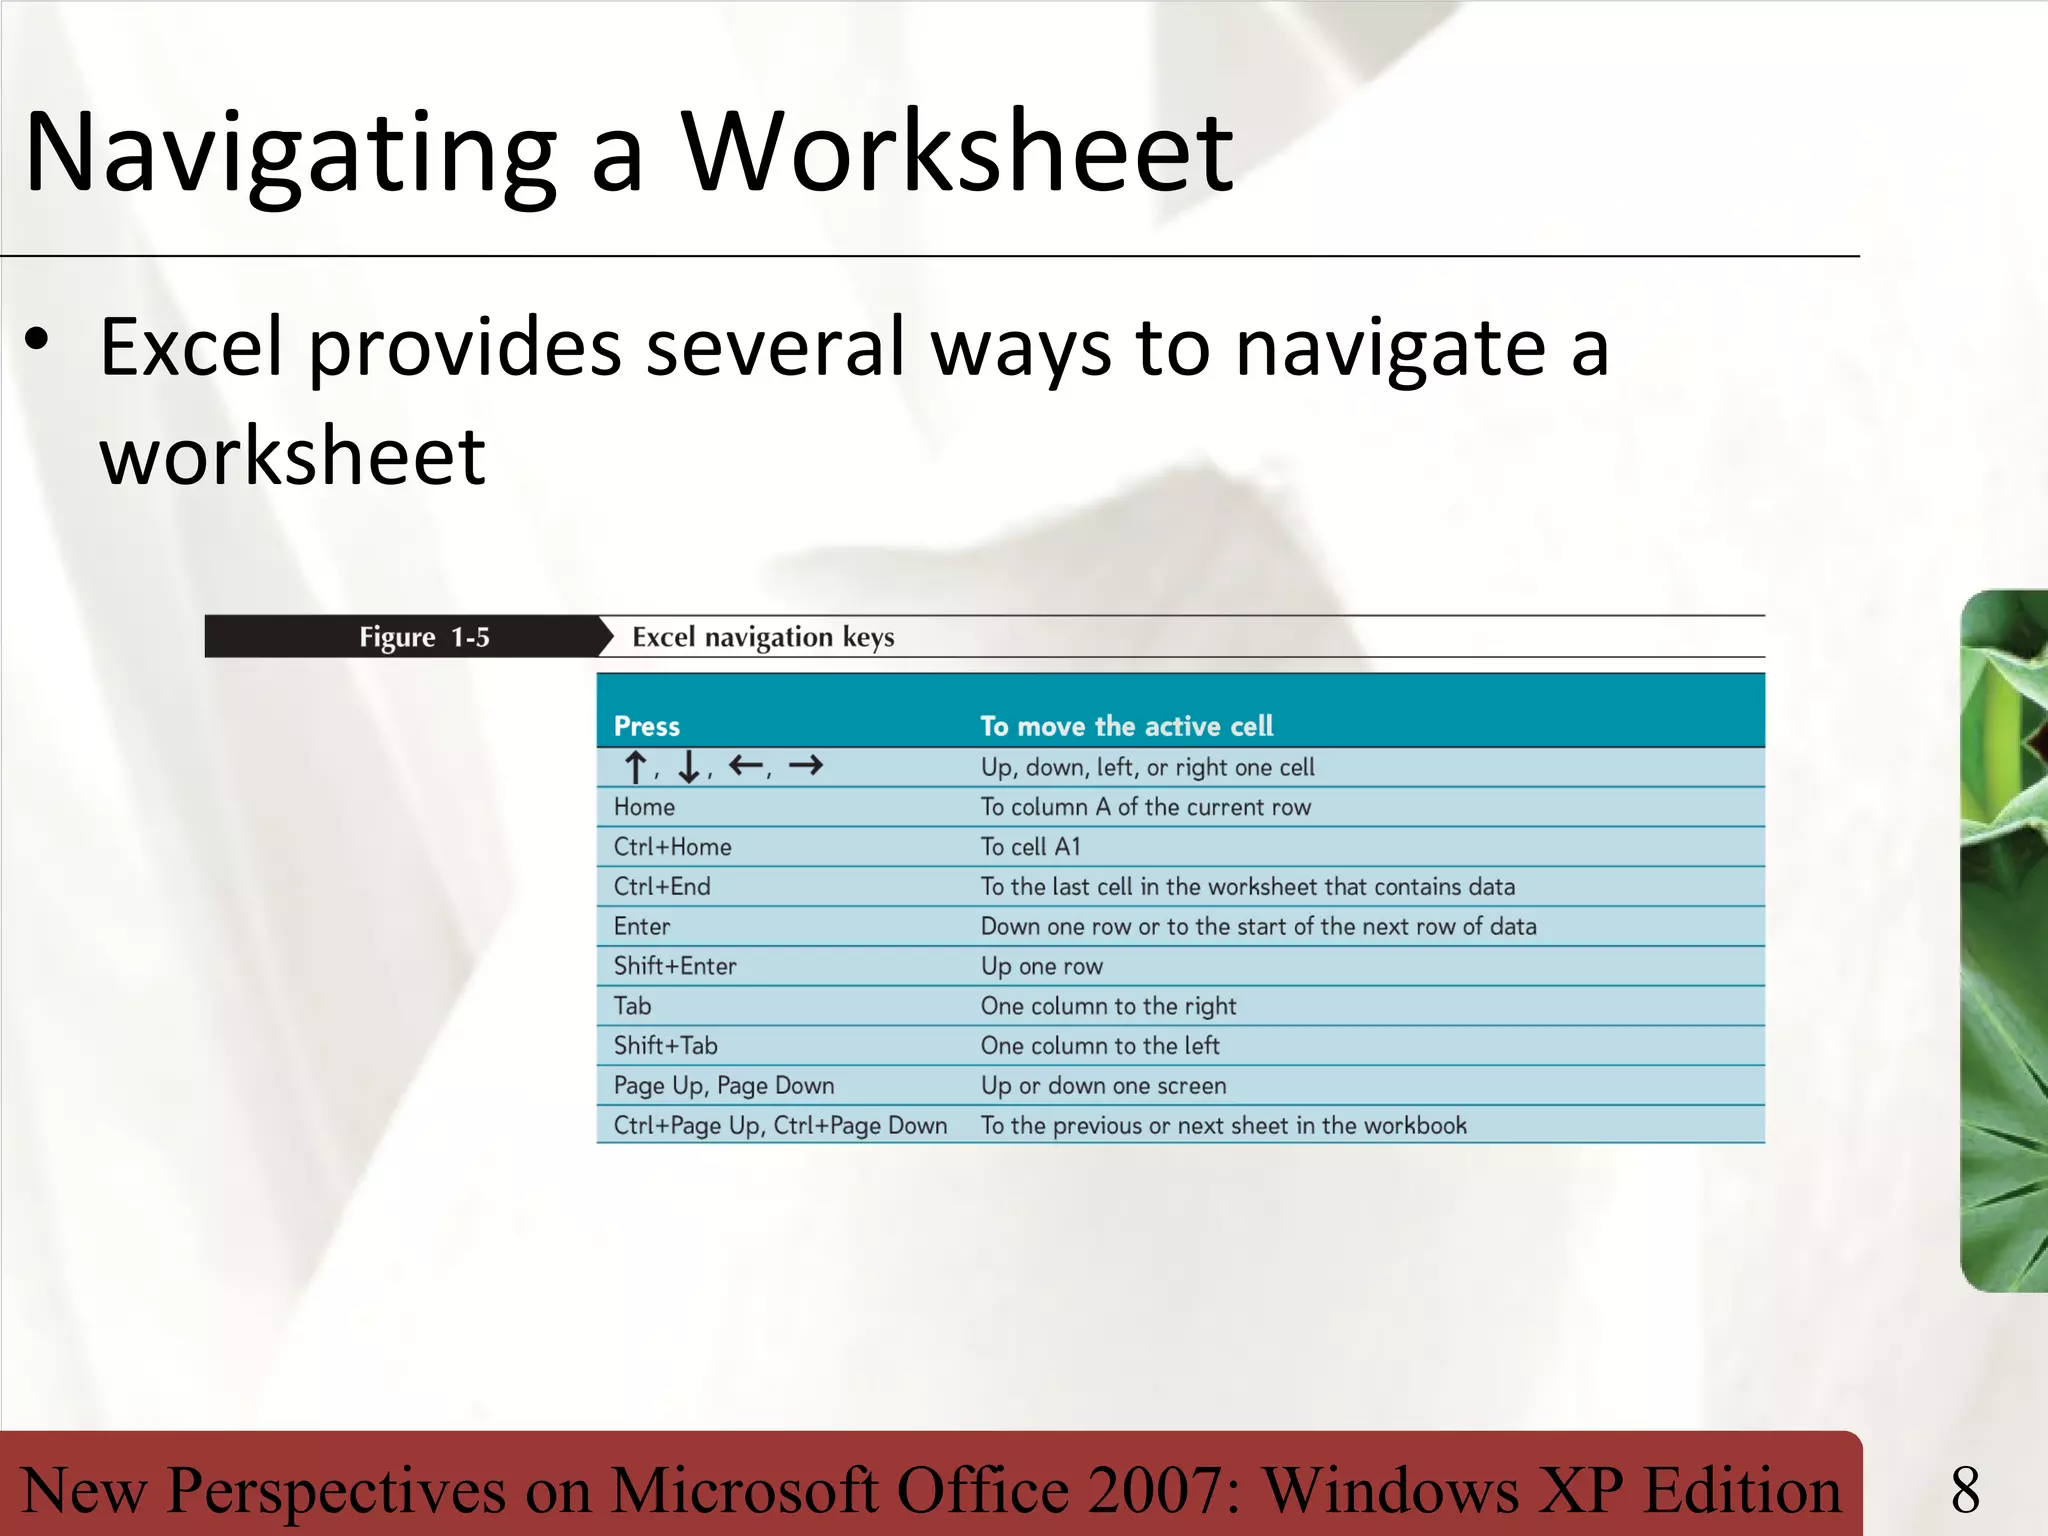
This document provides an overview of Excel and outlines the key topics covered in an Excel tutorial, including getting started with Excel, navigating and formatting worksheets, entering formulas and functions, working with multiple worksheets, editing data, and printing worksheets. The objectives are to learn the basic Excel interface and functions, enter and manipulate data, perform calculations with formulas and functions, and preview and print workbooks.
This document provides an overview of an Excel tutorial that covers:
- Understanding spreadsheets and the Excel interface
- Navigating and formatting worksheets
- Entering text, numbers, dates, and formulas into cells
- Inserting, deleting, copying, and moving cells and ranges
- Working with functions and AutoSum
- Inserting, deleting, renaming, and moving worksheets
- Editing cells, finding and replacing values, and checking spelling
- Changing views, orientation, and printing worksheets
This document provides an overview of the key topics and objectives covered in an Excel tutorial, including getting started with Excel, navigating and formatting worksheets, entering formulas and functions, working with multiple worksheets, and printing workbooks. The tutorial covers essential Excel skills such as understanding spreadsheets and the Excel interface, entering data, formatting cells, using formulas to calculate values, summarizing data with functions, and managing multiple worksheets. The objectives are designed to help users learn how to create, edit, and print Excel workbooks.
The document is a tutorial on getting started with Excel. It introduces spreadsheets and the Excel interface. It covers how to navigate within and between worksheets, enter text, numbers and formulas, format cells, and print worksheets. The objectives are to learn the basic Excel functions and features to create, edit, and format a workbook.
This document provides an overview of key Excel concepts and tasks, including:
1) Excel is a spreadsheet program used to enter, analyze, and present quantitative data in a grid format. It allows what-if analysis by changing values to assess effects.
2) The tutorial covers navigating and exploring worksheets, entering data, formatting cells, inserting formulas and functions, and printing worksheets.
3) Formulas use operators to combine values from cells and return a single result. Functions are predefined formulas like SUM to simplify calculations.
This document provides an overview of using Microsoft Excel to manage data. It identifies the major components of the Excel window and describes how Excel stores and organizes data in workbooks and worksheets. It also discusses how to enter and format data, use formulas and functions, navigate and select cells and ranges, insert and delete rows and columns, and print worksheets. The goal is to introduce the basic features and capabilities of Excel for setting up and working with spreadsheets.
This document provides an overview of key concepts for getting started with Microsoft Excel, including:
1. Excel is a spreadsheet program used to enter, analyze, and present quantitative data in a grid-like format. It allows for what-if analysis by changing values to assess effects.
2. The document explores the Excel interface and teaches how to navigate worksheets, plan workbooks, enter text/numbers/dates, adjust columns and rows, and insert/delete columns and rows.
3. Formulas can be entered to calculate values using cell references and functions provide pre-built formulas for common tasks like summing a range. Worksheets can also be inserted, deleted, moved, and renamed.
This document provides an overview of the key skills and concepts covered in an Excel 2010 tutorial, including: understanding spreadsheets and the Excel interface; navigating, entering data, and formatting worksheets; working with formulas and functions; managing multiple worksheets; previewing and printing workbooks; and viewing worksheet formulas. The tutorial objectives are to learn the basics of using Excel to create, edit, analyze, and share spreadsheet data.
The document provides instructions on how to use basic and advanced features in Microsoft Excel. It discusses how to navigate and format spreadsheets, enter formulas and functions, insert and delete cells and rows, work with worksheets, use editing tools, and preview and print workbooks. The goal is to teach users how to understand, create, edit, analyze and share Excel spreadsheet files.
This document provides an overview of a Microsoft Excel 2010 training course. The course goals are to learn how to use the ribbon, File menu, and perform essential tasks like opening, creating, and formatting workbooks. It covers the Excel interface, ribbon tabs, available rows and columns, workbooks and worksheets. It also reviews functions, formulas, formatting cells, printing, saving, and other basic tasks. Resources for additional learning include books and Microsoft websites.
This document provides 35 tips for using Microsoft Excel spreadsheets more efficiently. Some of the key tips include:
1) Convert rows to columns and vice versa using Copy, Paste Special and selecting the Transpose option.
2) Calculate time differences between dates by subtracting one date from another and formatting the cell as a number.
3) Prevent URLs from becoming hyperlinks by adding an apostrophe before the web address when typing it into a cell.
The document offers many shortcuts and functions to make common spreadsheet tasks faster through keyboard shortcuts, formatting options, calculations and more.
This document provides an overview of creating and formatting various types of charts and graphs in Microsoft Excel 2010, including pie charts, column charts, line charts, 3D charts, and more. It discusses how to select data ranges, choose chart types, modify elements like titles and legends, switch between chart tools tabs, move charts between sheets, and more. The document also covers sparklines, data bars, and creating a dedicated chart sheet.
Pie charts are very useful for comparing values to each other in a data series. Pie charts have five elements that are common to most charts. You can select and format any chart element individually or you can apply a built-in style or chart layout to format all of these elements at once.
This document provides information about a two-day advanced Excel 2010 workshop, including details about the course facilitator and rules of the workshop. It also includes an exercise for participants to rate their Excel skills and get started with the training. The workshop will provide advanced training on features in Excel 2010/2013, including slicers, chart styles, conditional formatting, and the quick analysis tool. It discusses new capabilities in Excel like sparklines, pivot table slicers and formatting options, and 64-bit processing. The goal is to help participants analyze and visualize data more efficiently in Excel.
Migrating to Excel 2010 from Excel 2003 | MicrosoftAnatoliy Bakal
This document provides guidance for users familiar with Excel 2003 who are migrating to Excel 2010. It outlines key differences in the interface, especially the new ribbon interface which replaces menus and toolbars. It explains how to find common commands and features in the new interface and provides tips for working with others who may not yet have upgraded. Advanced or power-user features like the developer tab and enabling add-ins are also described. The document aims to help smooth the transition to the new version of Excel by addressing common questions and highlighting where to find familiar tools.
This document summarizes an Excel training session that covered various Excel topics including basics, formulas, charts, printing, and mail merges. The training was led by three organizers and included an overview of Excel components and functions, hands-on exercises to create a shopping list and chart, and demonstrations of how to print worksheets, insert formulas, and use mail merges to generate reports and send emails. Additional topics discussed how Pearl and Microsoft Access relate to accessing and analyzing organizational data stored in the database.
This chapter discusses different types of charts that can be used to visualize quantitative data in Excel. It covers basic chart types like line, column, and pie charts, as well as more advanced types like radar and bubble charts. The chapter also explores chart sub-types and how to combine multiple chart types into a single dashboard chart to analyze business data. The objectives are to determine the appropriate chart type for different situations, modify charts effectively, and create advanced visualizations like management dashboards.
De vry math 399 all ilabs latest 2016 novemberlenasour
This document provides information about obtaining assistance with coursework from an online service called ACEHOMEWORK.NET. It lists various courses and assignments they can help with, such as accounting, marketing, finance, economics, mathematics, statistics, programming, and more. It emphasizes they can help students get an A grade and provide original, plagiarism-free work by the deadline. Contact information is provided to obtain more details and pricing information.
This document provides objectives and instructions for using various features in Microsoft Excel 2010, including what-if analysis, charting, and working with large worksheets. It describes how to rotate text, create a series of month names, copy and paste cells, format numbers, freeze and unfreeze rows and columns, show the system date, use absolute and mixed cell references, use the IF function, create sparkline charts, format cells, create a 3D pie chart on a separate chart sheet, rearrange worksheet tabs, and perform what-if analysis and goal seeking. The document contains step-by-step instructions and screenshots to demonstrate each feature.
Microsoft Excel is an electronic spreadsheet used to manipulate numerical data with formulas and functions. It allows users to perform tasks like preparing monthly sales reports, making loan payment schedules, and more. Excel has rows, columns, cells and allows for formatting of text, numbers, dates, as well as inserting charts, pictures, and other visual elements. Formulas can be used to perform calculations on worksheet data by using functions like SUM, AVERAGE, and more. Workbooks can be saved, protected with passwords, and files can be inserted, deleted or renamed.
This document provides an overview of Chapter 2 which discusses using statistical analysis tools to solve problems. It introduces statistical functions that can determine values, structure data, and count/total data based on criteria. These functions include AVERAGE, AVERAGEIF, COUNTIF, LARGE, MEDIAN, MODE.SNGL, RAND, RANDBETWEEN, RANK.EQ, ROUND, SMALL, STDEV.S, and SUMIF. The chapter also covers performing what-if analysis, goal seek, simulation, and custom formatting. Level 1 objectives focus on understanding basic statistics and using functions to calculate mean, median, mode and standard deviation. Level 2 objectives involve evaluating data rankings, extremes, and counts/
Tutorial 5: Excel Tables, PivotTables, and Pivot Chartscios135
This document provides an overview of working with Excel tables, PivotTables, and PivotCharts. It discusses how to structure data in Excel tables, create PivotTables to analyze and summarize table data, filter and rearrange PivotTables, and create PivotCharts to visualize PivotTable data. The document also covers sorting and filtering table data, calculating subtotals, and refreshing PivotTables when the source data is updated.
The document provides an overview of the tools and interface in Microsoft PowerPoint 2007, explaining the various sections like the toolbar, slide pane, outline pane, and animation tools that allow users to design and lay out slides, add text, graphics, animations and transitions between slides, and view or share their presentations. It describes the different options available under the Office button to open, save, print or share presentations and provides a brief introduction on how to get started creating presentations using PowerPoint 2007.
This document provides an introduction to basic computer hardware and software components. It begins with a brief history of computers, including early computers like ENIAC and key developments like the Apple II and IBM PC. It then defines hardware as the physical parts of a computer like the monitor, keyboard, mouse, CPU, printer, and modem. Software is defined as the instructions that make hardware work, like operating systems and applications. The document provides tutorials on using a mouse, starting programs, working with windows, and the start menu. It teaches mouse techniques, how to minimize, maximize and close windows.
This document provides an overview and tutorial for using Microsoft PowerPoint 2007. It covers topics such as the screen elements, tabs and ribbon interface, creating and designing presentations, adding text, images, tables and charts, organizing and animating slides, and tips for effective design. The goal is to introduce the fundamentals of PowerPoint 2007 and supplement textbook discussions of visual aids.
This document provides an introduction to using Microsoft Word. It covers launching and closing Word, identifying the interface, typing and saving documents, and reopening saved files. It also discusses basic formatting such as changing font, size, style and color, and paragraph justification, indentation and spacing. Formatting techniques like selecting, cutting, copying and pasting text are also demonstrated.
Learn to identify parts of a computer, hardware and software, operate the mouse and keyboard and become familiar with the MS Windows X/P Operating System.
This document provides an overview of word processing software and Microsoft Word. It describes the basic components of the MS Word interface and how to perform common word processing tasks like creating, editing, formatting and printing documents. Functions covered include saving, viewing and retrieving documents, as well as editing features, character formatting, paragraph formatting, page formatting, and tools to enhance document accuracy.
The document provides an overview of basic computer systems. It discusses the main types of computers including personal computers, mainframes, minicomputers, and supercomputers. It then describes the typical components of a computer system including the central processing unit, memory, control unit, arithmetic logic unit, and input/output devices. Finally, it discusses operating systems and how they control the hardware and allow users to interact with applications and the computer.
This document provides an overview of an Excel tutorial that covers:
- Understanding spreadsheets and the Excel interface
- Navigating and formatting worksheets
- Entering text, numbers, dates, and formulas into cells
- Inserting, deleting, copying, and moving cells and ranges
- Working with functions and AutoSum
- Inserting, deleting, renaming, and moving worksheets
- Editing cells, finding and replacing values, and checking spelling
- Changing views, orientation, and printing worksheets
This document provides an overview of key Excel concepts and tasks, including:
1) Excel is a program used to enter and analyze quantitative data in spreadsheets. It allows what-if analysis by changing values to assess impacts.
2) The tutorial covers navigating and exploring Excel, entering data, formulas and functions, formatting cells, inserting and deleting rows/columns/worksheets, and printing worksheets.
3) Formulas use operators to combine values from cells and return a single result. Functions are predefined formulas like SUM to simplify calculations.
This document provides an overview of formatting options in Excel workbooks. It discusses how to format text, numbers, dates, cell alignment and indentation. It also covers applying borders, styles, themes, conditional formatting, and hiding and organizing worksheet elements. The document describes setting print options like orientation, areas, titles and adding headers and footers. The overall purpose is to teach the reader how to change a workbook's appearance through various formatting features in Excel.
This document provides an outline for a lecture on introducing Microsoft Excel 2010. It discusses the Excel interface and various functions for navigating, selecting, editing, formatting and arranging cells, rows and columns. These include moving between worksheets, renaming worksheets, inserting and deleting rows and columns, changing row heights and column widths, hiding and unhiding rows and columns, and switching between different Excel views. The learning objectives are to understand and apply skills for exploring the Excel user interface and performing common tasks like formatting numbers and cells.
Excel is an application used to create spreadsheets containing numerical values, formulas, and charts. It allows users to enter data into cells organized into rows and columns and perform calculations on that data. The basic elements of an Excel file include worksheets containing grids of cells organized by column letters and row numbers, grouped together in workbooks. Formulas and functions can be used to calculate and analyze the data in cells. Common tasks like formatting, sorting, conditional formatting, and summarizing data help users understand and visualize information in Excel spreadsheets.
This document provides an introduction and overview of Microsoft Excel. It discusses key aspects of Excel including its use as a spreadsheet program to record and analyze numerical data in columns and rows. It describes the Office button, formatting text, inserting rows and columns, sorting and editing data, using formulas and functions, and some shortcut keys.
This document provides an outline for a training course on using Microsoft Excel. It includes learning objectives, topics that will be covered such as navigating worksheets, inserting and deleting rows and columns, and formatting cells. The document contains details on how to perform tasks like changing column widths, selecting cells and ranges, and editing and formatting worksheets. It also provides overviews of the Excel interface and different views within Excel.
Excel 2007 Training 2012 Module 1 (Self Study Materials)Amann Group
This presentation is designed for the Beginners in Excel 2007. I also published the outline of my next Two Modules. My two modules for Intermediate & Advance Learners will be coming soon. For some excel based application, I would suggest you to visit my LinkedIn Profiles\' Box Application.
This document provides an introduction to using Microsoft Excel 2007 spreadsheets. It outlines how to open Excel, enter different types of data into cells, perform basic tasks like copying/pasting and selecting cells, add/delete rows and columns, sort data, insert charts and formulas, and print spreadsheets. The key components covered include entering text, numbers, and formulas into cells; cutting/pasting and selecting data; adjusting column/row sizes; sorting data; renaming/deleting worksheets; and using functions and formulas in calculations.
Advanced Excel Study Materials | Sourav Sir Academy.pptxSBOfficial2
This document outlines the curriculum for a 14-chapter Microsoft Advanced Excel certification training program. The curriculum covers topics such as formatting cells, sorting and filtering data, formulas and functions, charts, pivot tables, macros, and more. Chapter 1 provides an introduction to Excel and covers basic elements like worksheets, cells, formatting, navigating, and views. It describes Excel as a program for creating spreadsheets to enter and analyze data using functions and formulas.
This document provides an overview of operations and functions in Microsoft Excel 2010. It outlines topics like moving around and selecting cells/rows/columns, editing and formatting worksheets, inserting and deleting rows/columns, changing row heights and column widths, hiding and unhiding rows/columns, navigating between worksheets, and using views and templates. The document is intended to help users understand and apply skills related to common Excel tasks.
This document outlines the content of a 6-lesson Microsoft Excel 2003 basic course. Lesson 1 covers the Excel interface, navigating and formatting worksheets, entering formulas and functions. Lesson 2 focuses on entering dates and times, editing cells, and cutting/copying/pasting. Lesson 3 is about formatting data, conditional formatting, and styles. Lesson 4 teaches how to create and modify charts. Lessons 5 and 6 cover sorting/filtering data, functions, and inserting images. The course provides step-by-step instructions on essential Excel tasks.
This document provides an introduction and tutorial for Microsoft Excel. It begins with an overview of Excel and what it can be used for, such as budget creation, data analysis, and presenting information. It then discusses key Excel components like the ribbon menu, cells, columns, rows, and worksheets. The document provides instructions for common tasks like navigating, entering data, formatting text and cells, inserting and deleting rows and columns, sorting data, and printing. It concludes by explaining how to copy and paste formatting between cells using tools like the format painter.
This document provides an overview of creating a multiple-page report in Microsoft Word 2010, including how to work with headings in the Navigation pane, create and format tables, sort table rows, insert footnotes and endnotes, divide the document into sections, create SmartArt graphics, add headers and footers, and insert a cover page. The document contains step-by-step instructions and screenshots for each task.
This document provides an overview of Microsoft Excel and its various features and functions. It discusses the layout and components of a spreadsheet, including rows, columns, cells, worksheets and ribbons. It describes how to enter and modify cell data, insert and delete rows and columns, and use basic formulas and functions like SUM. The document is intended as a guide for using Excel and highlights its applications in fields like accounting, auditing, taxation and data analysis.
This document provides objectives and instructions for using Excel 2013 to work with large worksheets, create charts and perform what-if analysis. It covers topics such as rotating text, creating month name series, formatting cells, inserting sparkline charts, applying chart filters, and using goal seek for what-if questions. The objectives are to learn skills for managing large worksheets, visualizing data through charts, and analyzing data through various what-if scenarios.
MS Excel and Visual Basic Applications.pptxsurekha1287
Microsoft Excel can be used to solve engineering problems by integrating Excel and Visual Basic for Applications (VBA). The course aims to teach students how to perform calculations in Excel, solve civil engineering problems using VBA, and design structural elements by combining Excel and VBA. Students will learn functions, charts, and how to write macros in VBA. Conditional formatting and sorting data in Excel are also covered.
Epistemic Interaction - tuning interfaces to provide information for AI supportAlan Dix
Paper presented at SYNERGY workshop at AVI 2024, Genoa, Italy. 3rd June 2024
https://alandix.com/academic/papers/synergy2024-epistemic/
As machine learning integrates deeper into human-computer interactions, the concept of epistemic interaction emerges, aiming to refine these interactions to enhance system adaptability. This approach encourages minor, intentional adjustments in user behaviour to enrich the data available for system learning. This paper introduces epistemic interaction within the context of human-system communication, illustrating how deliberate interaction design can improve system understanding and adaptation. Through concrete examples, we demonstrate the potential of epistemic interaction to significantly advance human-computer interaction by leveraging intuitive human communication strategies to inform system design and functionality, offering a novel pathway for enriching user-system engagements.
Climate Impact of Software Testing at Nordic Testing DaysKari Kakkonen
My slides at Nordic Testing Days 6.6.2024
Climate impact / sustainability of software testing discussed on the talk. ICT and testing must carry their part of global responsibility to help with the climat warming. We can minimize the carbon footprint but we can also have a carbon handprint, a positive impact on the climate. Quality characteristics can be added with sustainability, and then measured continuously. Test environments can be used less, and in smaller scale and on demand. Test techniques can be used in optimizing or minimizing number of tests. Test automation can be used to speed up testing.
GridMate - End to end testing is a critical piece to ensure quality and avoid...ThomasParaiso2
End to end testing is a critical piece to ensure quality and avoid regressions. In this session, we share our journey building an E2E testing pipeline for GridMate components (LWC and Aura) using Cypress, JSForce, FakerJS…
Full-RAG: A modern architecture for hyper-personalizationZilliz
Mike Del Balso, CEO & Co-Founder at Tecton, presents "Full RAG," a novel approach to AI recommendation systems, aiming to push beyond the limitations of traditional models through a deep integration of contextual insights and real-time data, leveraging the Retrieval-Augmented Generation architecture. This talk will outline Full RAG's potential to significantly enhance personalization, address engineering challenges such as data management and model training, and introduce data enrichment with reranking as a key solution. Attendees will gain crucial insights into the importance of hyperpersonalization in AI, the capabilities of Full RAG for advanced personalization, and strategies for managing complex data integrations for deploying cutting-edge AI solutions.
In his public lecture, Christian Timmerer provides insights into the fascinating history of video streaming, starting from its humble beginnings before YouTube to the groundbreaking technologies that now dominate platforms like Netflix and ORF ON. Timmerer also presents provocative contributions of his own that have significantly influenced the industry. He concludes by looking at future challenges and invites the audience to join in a discussion.
How to Get CNIC Information System with Paksim Ga.pptxdanishmna97
Pakdata Cf is a groundbreaking system designed to streamline and facilitate access to CNIC information. This innovative platform leverages advanced technology to provide users with efficient and secure access to their CNIC details.
Enchancing adoption of Open Source Libraries. A case study on Albumentations.AIVladimir Iglovikov, Ph.D.
Presented by Vladimir Iglovikov:
- https://www.linkedin.com/in/iglovikov/
- https://x.com/viglovikov
- https://www.instagram.com/ternaus/
This presentation delves into the journey of Albumentations.ai, a highly successful open-source library for data augmentation.
Created out of a necessity for superior performance in Kaggle competitions, Albumentations has grown to become a widely used tool among data scientists and machine learning practitioners.
This case study covers various aspects, including:
People: The contributors and community that have supported Albumentations.
Metrics: The success indicators such as downloads, daily active users, GitHub stars, and financial contributions.
Challenges: The hurdles in monetizing open-source projects and measuring user engagement.
Development Practices: Best practices for creating, maintaining, and scaling open-source libraries, including code hygiene, CI/CD, and fast iteration.
Community Building: Strategies for making adoption easy, iterating quickly, and fostering a vibrant, engaged community.
Marketing: Both online and offline marketing tactics, focusing on real, impactful interactions and collaborations.
Mental Health: Maintaining balance and not feeling pressured by user demands.
Key insights include the importance of automation, making the adoption process seamless, and leveraging offline interactions for marketing. The presentation also emphasizes the need for continuous small improvements and building a friendly, inclusive community that contributes to the project's growth.
Vladimir Iglovikov brings his extensive experience as a Kaggle Grandmaster, ex-Staff ML Engineer at Lyft, sharing valuable lessons and practical advice for anyone looking to enhance the adoption of their open-source projects.
Explore more about Albumentations and join the community at:
GitHub: https://github.com/albumentations-team/albumentations
Website: https://albumentations.ai/
LinkedIn: https://www.linkedin.com/company/100504475
Twitter: https://x.com/albumentations
Securing your Kubernetes cluster_ a step-by-step guide to success !KatiaHIMEUR1
Today, after several years of existence, an extremely active community and an ultra-dynamic ecosystem, Kubernetes has established itself as the de facto standard in container orchestration. Thanks to a wide range of managed services, it has never been so easy to set up a ready-to-use Kubernetes cluster.
However, this ease of use means that the subject of security in Kubernetes is often left for later, or even neglected. This exposes companies to significant risks.
In this talk, I'll show you step-by-step how to secure your Kubernetes cluster for greater peace of mind and reliability.
Encryption in Microsoft 365 - ExpertsLive Netherlands 2024Albert Hoitingh
In this session I delve into the encryption technology used in Microsoft 365 and Microsoft Purview. Including the concepts of Customer Key and Double Key Encryption.
Sudheer Mechineni, Head of Application Frameworks, Standard Chartered Bank
Discover how Standard Chartered Bank harnessed the power of Neo4j to transform complex data access challenges into a dynamic, scalable graph database solution. This keynote will cover their journey from initial adoption to deploying a fully automated, enterprise-grade causal cluster, highlighting key strategies for modelling organisational changes and ensuring robust disaster recovery. Learn how these innovations have not only enhanced Standard Chartered Bank’s data infrastructure but also positioned them as pioneers in the banking sector’s adoption of graph technology.
GraphSummit Singapore | The Art of the Possible with Graph - Q2 2024Neo4j
Neha Bajwa, Vice President of Product Marketing, Neo4j
Join us as we explore breakthrough innovations enabled by interconnected data and AI. Discover firsthand how organizations use relationships in data to uncover contextual insights and solve our most pressing challenges – from optimizing supply chains, detecting fraud, and improving customer experiences to accelerating drug discoveries.
Generative AI Deep Dive: Advancing from Proof of Concept to ProductionAggregage
Join Maher Hanafi, VP of Engineering at Betterworks, in this new session where he'll share a practical framework to transform Gen AI prototypes into impactful products! He'll delve into the complexities of data collection and management, model selection and optimization, and ensuring security, scalability, and responsible use.
Unlock the Future of Search with MongoDB Atlas_ Vector Search Unleashed.pdfMalak Abu Hammad
Discover how MongoDB Atlas and vector search technology can revolutionize your application's search capabilities. This comprehensive presentation covers:
* What is Vector Search?
* Importance and benefits of vector search
* Practical use cases across various industries
* Step-by-step implementation guide
* Live demos with code snippets
* Enhancing LLM capabilities with vector search
* Best practices and optimization strategies
Perfect for developers, AI enthusiasts, and tech leaders. Learn how to leverage MongoDB Atlas to deliver highly relevant, context-aware search results, transforming your data retrieval process. Stay ahead in tech innovation and maximize the potential of your applications.
#MongoDB #VectorSearch #AI #SemanticSearch #TechInnovation #DataScience #LLM #MachineLearning #SearchTechnology
Essentials of Automations: The Art of Triggers and Actions in FMESafe Software
In this second installment of our Essentials of Automations webinar series, we’ll explore the landscape of triggers and actions, guiding you through the nuances of authoring and adapting workspaces for seamless automations. Gain an understanding of the full spectrum of triggers and actions available in FME, empowering you to enhance your workspaces for efficient automation.
We’ll kick things off by showcasing the most commonly used event-based triggers, introducing you to various automation workflows like manual triggers, schedules, directory watchers, and more. Plus, see how these elements play out in real scenarios.
Whether you’re tweaking your current setup or building from the ground up, this session will arm you with the tools and insights needed to transform your FME usage into a powerhouse of productivity. Join us to discover effective strategies that simplify complex processes, enhancing your productivity and transforming your data management practices with FME. Let’s turn complexity into clarity and make your workspaces work wonders!
Why You Should Replace Windows 11 with Nitrux Linux 3.5.0 for enhanced perfor...SOFTTECHHUB
The choice of an operating system plays a pivotal role in shaping our computing experience. For decades, Microsoft's Windows has dominated the market, offering a familiar and widely adopted platform for personal and professional use. However, as technological advancements continue to push the boundaries of innovation, alternative operating systems have emerged, challenging the status quo and offering users a fresh perspective on computing.
One such alternative that has garnered significant attention and acclaim is Nitrux Linux 3.5.0, a sleek, powerful, and user-friendly Linux distribution that promises to redefine the way we interact with our devices. With its focus on performance, security, and customization, Nitrux Linux presents a compelling case for those seeking to break free from the constraints of proprietary software and embrace the freedom and flexibility of open-source computing.
2. New Perspectives on Microsoft Office 2007: Windows XP Edition 2
XPObjectives
• Understand the use of spreadsheets and Excel
• Learn the parts of the Excel window
• Scroll through a worksheet and navigate between
worksheets
• Create and save a workbook file
• Enter text, numbers, and dates into a worksheet
• Resize, insert, and remove columns and rows
3. New Perspectives on Microsoft Office 2007: Windows XP Edition 3
XPObjectives
• Select and move cell ranges
• Insert formulas and functions
• Insert, delete, move, and rename
worksheets
• Work with editing tools
• Preview and print a workbook
4. New Perspectives on Microsoft Office 2007: Windows XP Edition 4
XPIntroducing Excel
• Microsoft Office Excel 2007 (or Excel) is a computer
program used to enter, analyze, and present
quantitative data
• A spreadsheet is a collection of text and numbers laid
out in a rectangular grid.
– Often used in business for budgeting, inventory management,
and decision making
• What-if analysis lets you change one or more values in a
spreadsheet and then assess the effect those changes
have on the calculated values
5. New Perspectives on Microsoft Office 2007: Windows XP Edition 5
XPIntroducing Excel
6. New Perspectives on Microsoft Office 2007: Windows XP Edition 6
XPExploring Excel
7. New Perspectives on Microsoft Office 2007: Windows XP Edition 7
XPExploring Excel
8. New Perspectives on Microsoft Office 2007: Windows XP Edition 8
XPNavigating a Worksheet
• Excel provides several ways to navigate a
worksheet
9. New Perspectives on Microsoft Office 2007: Windows XP Edition 9
XPPlanning a Workbook
• Before you begin to enter data into a workbook,
you should develop a plan
– Planning analysis sheet
10. New Perspectives on Microsoft Office 2007: Windows XP Edition 10
XP
Entering Text, Numbers, and Dates
in Cells
• The formula bar displays the content of the
active cell
• Text data is a combination of letters, numbers,
and some symbols
• Number data is any numerical value that can be
used in a mathematical calculation
• Date and time data are commonly recognized
formats for date and time values
11. New Perspectives on Microsoft Office 2007: Windows XP Edition 11
XP
Entering Multiple Lines of Text
Within a Cell
• Click the cell in which you want to enter the text
• Type the first line of text
• For each additional line of text, press the
Alt+Enter keys (that is, hold down the Alt key as
you press the Enter key), and then type the text
12. New Perspectives on Microsoft Office 2007: Windows XP Edition 12
XP
Changing Column Width
and Row Height
• A pixel is a single point on a computer monitor
or printout
• The default column width is 8.38 standard-sized
characters
• Row heights are expressed in points or pixels,
where a point is 1⁄72 of an inch
• Autofitting eliminates any empty space by
matching the column to the width of its longest
cell entry or the row to the height of its tallest
cell entry
13. New Perspectives on Microsoft Office 2007: Windows XP Edition 13
XP
Changing the Column Width
and Row Height
• Drag the right border of the column heading left to decrease the
column width or right to increase the column width
• Drag the bottom border of the row heading up to decrease the row
height or down to increase the row height
or
• Double-click the right border of a column heading or the bottom border
of a row heading to AutoFit the column or row to the cell contents (or
select one or more column or rows, click the Home tab on the Ribbon,
click the Format button in the Cells group, and then click AutoFit
Column Width or AutoFit Row Height)
or
• Select one or more columns or rows
• Click the Home tab on the Ribbon, click the Format button in the Cells
group, and then click Column Width or Row Height
• Enter the column width or row height you want, and then click the OK
button
14. New Perspectives on Microsoft Office 2007: Windows XP Edition 14
XPInserting a Column or Row
• Select the column(s) or row(s) where you want
to insert the new column(s) or row(s); Excel will
insert the same number of columns or rows as
you select
• In the Cells group on the Home tab, click the
Insert button (or right-click a column or row
heading or selected column and row headings,
and then click Insert on the shortcut menu)
15. New Perspectives on Microsoft Office 2007: Windows XP Edition 15
XPInserting a Column or Row
16. New Perspectives on Microsoft Office 2007: Windows XP Edition 16
XPDeleting and Clearing a Row or Column
• Clearing data from a worksheet removes the
data but leaves the blank cells
• Deleting data from the worksheet removes both
the data and the cells
17. New Perspectives on Microsoft Office 2007: Windows XP Edition 17
XPWorking with Cells and Cell Ranges
• A group of cells is called a cell range or range
• An adjacent range is a single rectangular block of
cells
• A nonadjacent range consists of two or more
distinct adjacent ranges
• A range reference indicates the location and size
of a cell range
18. New Perspectives on Microsoft Office 2007: Windows XP Edition 18
XPSelecting Cell Ranges
To select an adjacent range:
• Click the cell in the upper-left corner of the adjacent range, drag
the pointer to the cell in the lower-right corner of the adjacent
range, and then release the mouse button
or
• Click the cell in the upper-left corner of the adjacent range, press
the Shift key as you click the cell in the lower-right corner of the
adjacent range, and then release the Shift key
To select a nonadjacent range of cells:
• Select a cell or an adjacent range, press the Ctrl key as you select
each additional cell or adjacent range, and then release the Ctrl
key
To select all the cells in a worksheet:
• Click the Select All button located at the intersection of the row
and column headings (or press the Ctrl+A keys)
19. New Perspectives on Microsoft Office 2007: Windows XP Edition 19
XPSelecting Cell Ranges
20. New Perspectives on Microsoft Office 2007: Windows XP Edition 20
XPMoving or Copying a Cell or Range
• Select the cell or range you want to move or copy
• Move the mouse pointer over the border of the selection until
the pointer changes shape
• To move the range, click the border and drag the selection to a
new location (or, to copy the range, hold down the Ctrl key and
drag the selection to a new location)
or
• Select the cell or range you want to move or copy
• In the Clipboard group on the Home tab, click the Cut button or
the Copy button (or right-click the selection, and then click Cut or
Copy on the shortcut menu)
• Select the cell or upper-left cell of the range where you want to
move or copy the content
• In the Clipboard group, click the Paste button (or right-click the
selection, and then click Paste on the shortcut menu)
21. New Perspectives on Microsoft Office 2007: Windows XP Edition 21
XPMoving or Copying a Cell or Range
22. New Perspectives on Microsoft Office 2007: Windows XP Edition 22
XPInserting and Deleting a Cell Range
23. New Perspectives on Microsoft Office 2007: Windows XP Edition 23
XPInserting or Deleting a Cell Range
• Select a range that matches the range you want to insert or
delete
• In the Cells group on the Home tab, click the Insert button or the
Delete button
or
• Select the range that matches the range you want to insert or
delete
• In the Cells group, click the Insert button arrow and then click the
Insert Cells button or click the Delete button arrow and then click
the Delete Cells command (or right-click the selected range, and
then click Insert or Delete on the shortcut menu)
• Click the option button for the direction in which you want to
shift the cells, columns, or rows
• Click the OK button
24. New Perspectives on Microsoft Office 2007: Windows XP Edition 24
XPEntering a Formula
• A formula is an expression that returns a value
• A formula is written using operators that
combine different values, returning a single value
that is then displayed in the cell
– The most commonly used operators are arithmetic
operators
• The order of precedence is a set of predefined
rules used to determine the sequence in which
operators are applied in a calculation
25. New Perspectives on Microsoft Office 2007: Windows XP Edition 25
XPEntering a Formula
26. New Perspectives on Microsoft Office 2007: Windows XP Edition 26
XPEntering a Formula
27. New Perspectives on Microsoft Office 2007: Windows XP Edition 27
XPEntering a Formula
• Click the cell in which you want the formula
results to appear
• Type = and an expression that calculates a value
using cell references and arithmetic operators
• Press the Enter key or press the Tab key to
complete the formula
28. New Perspectives on Microsoft Office 2007: Windows XP Edition 28
XPEntering a Formula
29. New Perspectives on Microsoft Office 2007: Windows XP Edition 29
XPCopying and Pasting Formulas
• With formulas, however, Excel adjusts the
formula’s cell references to reflect the new
location of the formula in the worksheet
30. New Perspectives on Microsoft Office 2007: Windows XP Edition 30
XPIntroducing Functions
• A function is a named operation that returns a
value
• For example, to add the values in the range
A1:A10, you could enter the following long
formula:
=A1+A2+A3+A4+A5+A6+A7+A8+A9+A10
Or, you could use the SUM function to
accomplish the same thing:
=SUM(A1:A10)
31. New Perspectives on Microsoft Office 2007: Windows XP Edition 31
XPEntering a Function
32. New Perspectives on Microsoft Office 2007: Windows XP Edition 32
XPEntering Functions with AutoSum
• The AutoSum button quickly inserts Excel
functions that summarize all the values in a
column or row using a single statistic
– Sum of the values in the column or row
– Average value in the column or row
– Total count of numeric values in the column or row
– Minimum value in the column or row
– Maximum value in the column or row
33. New Perspectives on Microsoft Office 2007: Windows XP Edition 33
XPEntering Functions with AutoSum
34. New Perspectives on Microsoft Office 2007: Windows XP Edition 34
XPInserting and Deleting a Worksheet
• To insert a new worksheet into the workbook, right-click
a sheet tab, click Insert on the shortcut menu, select a
sheet type, and then click the OK button
• You can delete a worksheet from a workbook in two
ways:
– You can right-click the sheet tab of the worksheet you
want to delete, and then click Delete on the shortcut
menu
– You can also click the Delete button arrow in the Cells
group on the Home tab, and then click Delete Sheet
35. New Perspectives on Microsoft Office 2007: Windows XP Edition 35
XPRenaming a Worksheet
• To rename a worksheet, you double-click the
sheet tab to select the sheet name, type a new
name for the sheet, and then press the Enter key
• Sheet names cannot exceed 31 characters in
length, including blank spaces
• The width of the sheet tab adjusts to the length
of the name you enter
36. New Perspectives on Microsoft Office 2007: Windows XP Edition 36
XPMoving and Copying a Worksheet
• You can change the placement of the worksheets
in a workbook
• To reposition a worksheet, you click and drag the
sheet tab to a new location relative to other
worksheets in the workbook
• To copy a worksheet, just press the Ctrl key as
you drag and drop the sheet tab
37. New Perspectives on Microsoft Office 2007: Windows XP Edition 37
XPEditing Your Work
• To edit the cell contents, you can work in editing
mode
• You can enter editing mode in several ways:
– double-clicking the cell
– selecting the cell and pressing the F2 key
– selecting the cell and clicking anywhere within the
formula bar
38. New Perspectives on Microsoft Office 2007: Windows XP Edition 38
XPEditing Your Work
39. New Perspectives on Microsoft Office 2007: Windows XP Edition 39
XPUsing Find and Replace
• You can use the Find command to locate
numbers and text in the workbook and the
Replace command to overwrite them
40. New Perspectives on Microsoft Office 2007: Windows XP Edition 40
XPUsing the Spelling Checker
• The spelling checker verifies the words in the
active worksheet against the program’s
dictionary
41. New Perspectives on Microsoft Office 2007: Windows XP Edition 41
XPChanging Worksheet Views
• You can view a worksheet in three ways:
– Normal view simply shows the contents of the
worksheet
– Page Layout view shows how the worksheet will
appear on the page or pages sent to the printer
– Page Break Preview displays the location of the
different page breaks within the worksheet
42. New Perspectives on Microsoft Office 2007: Windows XP Edition 42
XPChanging Worksheet Views
43. New Perspectives on Microsoft Office 2007: Windows XP Edition 43
XPChanging Worksheet Views
44. New Perspectives on Microsoft Office 2007: Windows XP Edition 44
XP
Working with Portrait
and Landscape Orientation
• In portrait orientation, the page is taller than it
is wide
• In landscape orientation, the page is wider than
it is tall
• By default, Excel displays pages in portrait
orientation
45. New Perspectives on Microsoft Office 2007: Windows XP Edition 45
XP
Working with Portrait
and Landscape Orientation
• To change the page orientation:
– Click the Page Layout tab on the Ribbon
– In the Page Setup group, click the Orientation button,
and then click Landscape
– The page orientation switches to landscape
46. New Perspectives on Microsoft Office 2007: Windows XP Edition 46
XPPrinting the Workbook
• You can print the contents of your workbook by
using the Print command on the Office Button
• The Print command provides three options:
– You can open the Print dialog box from which you
can specify the printer settings, including which
printer to use, which worksheets to include in the
printout, and the number of copies to print
– You can perform a Quick Print using the print options
currently set in the Print dialog box
– Finally, you can preview the workbook before you
send it to the printer
47. New Perspectives on Microsoft Office 2007: Windows XP Edition 47
XP
Viewing and Printing Worksheet
Formulas
• You can view the formulas in a workbook by
switching to formula view, a view of the
workbook contents that displays formulas
instead of the resulting values
• To change the worksheet to formula view, press
the Ctrl+` keys
• Scaling a printout reduces the width and the
height of the printout to fit the number of pages
you specify by shrinking the text size as needed
48. New Perspectives on Microsoft Office 2007: Windows XP Edition 48
XP
Viewing and Printing Worksheet
Formulas
49. New Perspectives on Microsoft Office 2007: Windows XP Edition 49
XP
Viewing and Printing Worksheet
Formulas