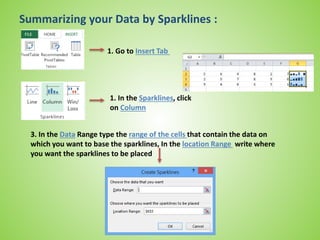
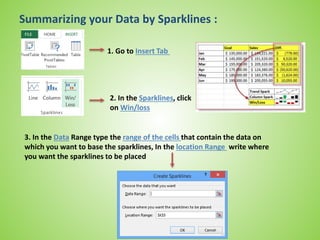
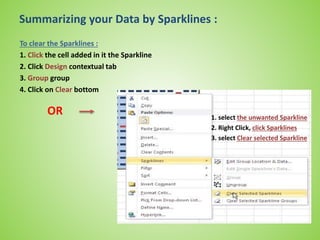
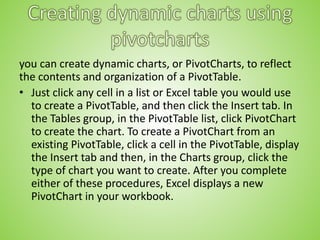
This document provides instructions for creating and customizing various types of charts and diagrams in Excel, including: bar charts, line charts, and other basic chart types; formatting charts; creating sparklines to summarize data; dynamic PivotCharts linked to PivotTables; SmartArt diagrams; basic shapes; and equations. It covers tasks like selecting data, changing chart layouts and styles, filtering PivotCharts, adding and arranging shapes, and inserting equations into shapes. The goal is to help users learn how to visually represent and analyze their data in Excel.