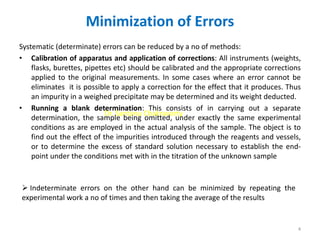
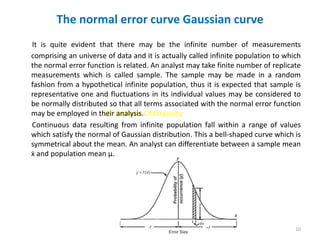
SlideShare a Scribd company logo
Dr. Santanu Chakravorty
CHEMISTRY-DSE: ANALYTICAL METHODS IN
CHEMISTRY
Dr. Santanu Chakravorty
Assistant Professor
Mathabhanga College
1
Dr. Santanu Chakravorty
Syllabus
Qualitative and quantitative aspects of analysis:
Sampling, evaluation of analytical data, errors, accuracy and precision,
methods of their expression, normal law of distribution if indeterminate
errors, statistical test of data; F, Q and t test, rejection of data, and confidence
intervals.
2
Dr. Santanu Chakravorty
Errors
• Determinate (systematic) Errors: These are errors which can be avoided or whose
magnitude can be determined. These are definite or constant errors which include
instrumental, operational, personal, reagent, additive and proportional.
• Indeterminate (random) Errors: If a particular person carried out the analysis of a
substances in the same laboratory and under similar sets of conditions, most of
the time there is slight variation in the results obtains over which the analyst has
no controls. Such errors are called indeterminate errors.
Main Differences: Determinate errors are those errors which have definite values
whereas indeterminate errors are those which possess indefinite value and follow
law and invariably have fluctuating values.
•Determinate errors are of various kinds depending upon their origin viz. methodic,
operational, instrumental etc. Indeterminate errors arise from variation of
indeterminate errors or which are erratic in occurrence.
•The determinate errors can be reduced by controlling the origin of the error but
the analyst has no control over indeterminate errors.
3
Dr. Santanu Chakravorty
Minimization of Errors
Systematic (determinate) errors can be reduced by a no of methods:
• Calibration of apparatus and application of corrections: All instruments (weights,
flasks, burettes, pipettes etc) should be calibrated and the appropriate corrections
applied to the original measurements. In some cases where an error cannot be
eliminates it is possible to apply a correction for the effect that it produces. Thus
an impurity in a weighed precipitate may be determined and its weight deducted.
• Running a blank determination: This consists of in carrying out a separate
determination, the sample being omitted, under exactly the same experimental
conditions as are employed in the actual analysis of the sample. The object is to
find out the effect of the impurities introduced through the reagents and vessels,
or to determine the excess of standard solution necessary to establish the end-
point under the conditions met with in the titration of the unknown sample
 Indeterminate errors on the other hand can be minimized by repeating the
experimental work a no of times and then taking the average of the results
4
Dr. Santanu Chakravorty
Absolute and Relative Errors
• When a quantity is measured even with extreme care, it is found that the results
of successive determinations differ among themselves. The average value is
accepted as the most probable. This may not always be the true value.
• The absolute error of a determination is the difference between the observed (or
measured) value and the true value of the quantity measured. It is a measure of
the accuracy of the measurement.
• The relative error is the absolute error divided by the true value. It is usually
expressed in terms of percentage. The true or absolute values of a quantity can
not be compared with the most probable value.
• If x is the actual value of a quantity, x0 is the measured value of the quantity and
Δx is the absolute error, then the relative error can be measured using the below
formula.
• Relative error = (x0-x)/x = (Δx)/x
5
Dr. Santanu Chakravorty
Precision
Precision is defined as the degree of agreement between a numerical value and other
values of measurement. Precision doe not by any means imply accuracy it is used to
describe the reproducibility of results. It also implies nothing about their relation to the
true values. It is the close agreement of values among a group of experimental results
carried out by different persons on the same method or by different person on different
methods on the same measurement. The results may show a high degree of precision
or good agreement with one another, yet have poor accuracy or agreement with the
true value. The precision of a measurement is evaluated from data itself, by the
agreement among separate values. Various methods are used to describe the precision
of measurements. Precision is commonly evaluates by the application of statistical
methods to deviations among measurements, like average deviation, standard
deviation , range etc. Accuracy on the other hand is the agreement between the
observed value and most probable (true) values.
• Median: The median is the average or middle value of in a set. For an odd number of
values, the middle value is the median, and for an even no values, the average of the
two middle values is the median. The median is more likely to be closer to the true
value than the mean, because a single bad result may influence the mean more than
the median.
For the odd values 18,19, 20, 21, 22, the median = 20
For the even values 18, 19, 20, 21, 22, 23 the median = 20+21/2 = 20.5
6
Dr. Santanu Chakravorty
Continued……
• Arithmetic mean or average: The mean ( x̄ ) is the sum of the individual
measurements (xi) of some quantity divided by the number of measurements (n).
The mean is calculated by the formula:
where x̄ is the ith measured value of x.
• Mode: The mode is the frequency or no of occasion upon which a given value
appears in the data. For example, for a set of observations 5, 4, 6, 6, 4, 5, 6, 6, 3,
the mode is 6 and the frequency of this value is 4.
• Deviation: The difference between any results of an analysis and the mean of a
series of results is called the deviation from the mean. The deviation is positive if
the value is greater than the mean, and negative if it is less than the mean. It is
denoted by d.
• Average deviation: It is the average of the absolute value of deviations in a series
of determinations. Its relative magnitude is indicative of the precision of a series of
determinations. The smaller the average deviation, the greater is the precision.
The average deviation is represented by the given formula:
7
Dr. Santanu Chakravorty
Continued……
• Standard deviation: When there are four or more determinations, we often use
the term standard deviation instead of average deviation. The standard deviation
carries more statistical significance than the average deviation. The standard
deviation is represented as s and is given by:
• Range: The range is the arithmetical differences between the smallest and the
largest values of a series
• Variance: The square of the standard deviation is called variance. The coefficient
of variance is an accurate measure of the precision and is given by
8
Dr. Santanu Chakravorty
Frequency Distribution: Distribution of Experimental
Data
It is a method to represent large number of finite population of organized data after
proper correction of determinate errors, the remaining fluctuations in the data are
found to be random in nature. These data may be associated with undetectable random
errors that are attributable to uncontrollable variable in the experiment. This small
random errors in most of the cases cancel one another and their effect is minimum.
However, these errors may be unidirectional and thus they produce large positive or
negative net error. The sources of random errors may be due to the visual judgment,
temperature fluctuation, time variation. We cannot identify the contribution of any one
of these sources of error in the measurement so that their combined effect is
responsible for the scatter of data around the mean.
These unrecognized data are organized to form the frequency distribution data which
consist of range from the lowest to the highest value into a convenient number of
intervals or range and then count the number of values falling within each range. In this
process there involves some loss of information of the data but this is more convenient
to represent the data in condensed form. Usually the range is divided into equal
intervals and sometimes confusion is avoided by choosing range boundaries halfway
between possible observed data.
A plot of the frequency distribution data is known as frequency distribution curve or
histogram. This is also known as bar graph or frequency polygon curve in which the
percentage of measured values are plotted against the range values. This curve also
known as Gaussian Curve.
9
Dr. Santanu Chakravorty
The normal error curve Gaussian curve
It is quite evident that there may be the infinite number of measurements
comprising an universe of data and it is actually called infinite population to which
the normal error function is related. An analyst may take finite number of replicate
measurements which is called sample. The sample may be made in a random
fashion from a hypothetical infinite population, thus it is expected that sample is
representative one and fluctuations in its individual values may be considered to
be normally distributed so that all terms associated with the normal error function
may be employed in their analysis.
Continuous data resulting from infinite population fall within a range of values
which satisfy the normal of Gaussian distribution. This a bell-shaped curve which is
symmetrical about the mean. An analyst can differentiate between a sample mean
ẋ and population mean μ.
10
Dr. Santanu Chakravorty
Statistical Evaluation of Analytical data
The statistical evaluation of analytical data is based on experimental
measurements and the judgment of these experiment data is made trough sample
mean (ẋ), population mean (μ), population standard deviation (Ϭ) etc. , which are
already discussed. In the case of replicate data we have to consider statically the
following aspect:
1. confidence interval and confidence limit of replicate data
2. establishment of confidence interval of the mean of the experimental data
3. determination of probability whether an experimental mean is different from
accepted value.
4. establishment of a given probability level whether two experimental mean are
different.
5. to establish the probability level whether the precision of two sets of
measurements differ
6. to establish the detection limits for a measurement etc.
11
Dr. Santanu Chakravorty
Confidence limit, confidence level and
confidence interval
• A confidence interval (CI) is a type of interval estimate, computed from the
statistics of the observed data, that might contain the true value of unknown
population parameter.
• Confidence level is quantities the level of confidence that the deterministic
parameter is captured by the interval. More strictly speaking, the confidence level
represents the frequency of possible confidence intervals that contain the true
value of the unknown population parameter.
• To calculate the confidence limits for a measurement variable, multiply the
standard error of the mean times the appropriate t-value. The t-value is
determined by the probability and the degree of freedom (n-1)
12
Dr. Santanu Chakravorty
t and F test
• A t-test is a form of the statistical hypothesis test, based on Student’s t-statistic
and t-distribution to find out the p-value (probability) which can be used to accept
or reject the null hypothesis.
• T-test analyses if the means of two data sets are greatly different from each other,
i.e. whether the population mean is equal to or different from the standard mean.
It can also be used to ascertain whether the regression line has a slope different
from zero. The test relies on a number of assumptions, which are:
• The population is infinite and normal.
• Population variance is unknown and estimated from the sample.
• The mean is known.
• Sample observations are random and independent.
• The sample size is small.
• Mean and standard deviation of the two samples are used to make comparison
between them, such that:
x̄1 = Mean of the first dataset, x̄2 = Mean of the second dataset
S1 = Standard deviation of the first dataset, S2 = Standard deviation of the second dataset, n1 = Size
of first dataset, n2 = Size of second dataset
13
Dr. Santanu Chakravorty
t and F test
• F-test is described as a type of hypothesis test, that is based on Snedecor f-
distribution, under the null hypothesis. The test is performed when it is not known
whether the two populations have the same variance.
• F-test can also be used to check if the data conforms to a regression model, which
is acquired through least square analysis. When there is multiple linear regression
analysis, it examines the overall validity of the model or determines whether any
of the independent variables is having a linear relationship with the dependent
variable. A number of predictions can be made through, the comparison of the
two datasets. The expression of the f-test value is in the ratio of variances of the
two observations, which is shown below:
Where, S2 = variance
• The assumptions on which f-test relies are:
• The population is normally distributed.
• Samples have been drawn randomly.
• Observations are independent.
14
Dr. Santanu Chakravorty
Key Differences Between T-test and F-test
• The difference between t-test and f-test can be drawn clearly on the following
grounds:
• A univariate hypothesis test that is applied when the standard deviation is not
known and the sample size is small is t-test. On the other hand, a statistical test,
which determines the equality of the variances of the two normal datasets, is
known as f-test.
• The t-test is based on T-statistic follows Student t-distribution, under the null
hypothesis. Conversely, the basis of the f-test is F-statistic follows Snedecor f-
distribution, under the null hypothesis.
• The t-test is used to compare the means of two populations. In contrast, f-test is
used to compare two population variances.
15
Dr. Santanu Chakravorty
Q test
In a set of replicate measurements of large number of data if one of the result may
vary excessively from the average value i.e. the value is either too high or two low
from the average, then a decision must be made whether we shall retain or reject
it. Several statistical test are performed for this. However there is no universal rule
can be applied to settle the question of retention or rejection of that particular
data. A simplified test which is widely used is called Q-test (quotient test)
described by Dean and Dixon. It involve the following steps:
(a) The results of measurements are arranged in decreasing order.
(b) The range of the results is calculated
(c) The difference between the questionable or suspected results xq and its
nearest neighbor xn is divided by the spread or range R of the entire set to obtain a
quantity Qexp as:
(d) The Qexp is then compared with the critical value of the rejection ratio Qcrit
found at appropriate confidence level
(e) If Qexp> Qcrit, the questionable or the suspected result can be discarded at the
appropriate confidence level
16
Dr. Santanu Chakravorty
Mathematical Problem
• Four sample of a silver alloy were analyzed and were found to have the following
percentages of silver Sample 1(Ag% 16.37), Sample 2 (Ag% 16.29), Sample 3 (Ag%
16.39), sample 4 (Ag% 16.35), calculate the average deviation and standard
deviation.
Average value ẋ = 16.37+ 16.29 + 16.39 +16.35/4 = 16.35%
The deviation d1 = 16.37-16.35 = 0.04
The deviation d2 = 16.29-16.35 = -0.06
The deviation d3 = 16.39-16.35 = 0.04
The deviation d4 = 16.35-16.35 = 0.00
Average deviation = d1+d2+d3+d4/4 = 0.02+0.06+0.04+0.00/4 = 0.03
Standard deviation
17
= 0.0435
• The normality of a solution determined by four separate titrations results being
0.2041, 0.2049, 0.2039 and 0.2043. Calculate mean, median, range, average,
deviation, relative average deviation, standard deviation and the coefficient of
variances (do it yourself)

More Related Content

Similar to DSE-2, ANALYTICAL METHODS.pptx

Standard deviation
Standard deviationStandard deviation
Standard deviation
M K
 
1625941932480.pptx
1625941932480.pptx1625941932480.pptx
1625941932480.pptx
MathiQueeny
 
linearity concept of significance, standard deviation, chi square test, stude...
linearity concept of significance, standard deviation, chi square test, stude...linearity concept of significance, standard deviation, chi square test, stude...
linearity concept of significance, standard deviation, chi square test, stude...
KavyasriPuttamreddy
 
STATISTICAL PARAMETERS
STATISTICAL  PARAMETERSSTATISTICAL  PARAMETERS
STATISTICAL PARAMETERS
Hasiful Arabi
 
Unit 3 Sampling
Unit 3 SamplingUnit 3 Sampling
Unit 3 Sampling
Rai University
 
Biostatistics
BiostatisticsBiostatistics
Biostatisticspriyarokz
 
Selection and calibration of analytical method & calibration methods
Selection and calibration  of analytical method & calibration methodsSelection and calibration  of analytical method & calibration methods
Selection and calibration of analytical method & calibration methods
Tapeshwar Yadav
 
MEASURES OF DISPERSION I BSc Botany .ppt
MEASURES OF DISPERSION I BSc Botany .pptMEASURES OF DISPERSION I BSc Botany .ppt
MEASURES OF DISPERSION I BSc Botany .ppt
aigil2
 
Parametric tests
Parametric testsParametric tests
Parametric tests
Dr. Yash Panchal
 
tests of significance
tests of significancetests of significance
tests of significance
benita regi
 
Basic Statistical Descriptions of Data.pptx
Basic Statistical Descriptions of Data.pptxBasic Statistical Descriptions of Data.pptx
Basic Statistical Descriptions of Data.pptx
Anusuya123
 
Measures of central tendency
Measures of central tendencyMeasures of central tendency
Measures of central tendency
Mmedsc Hahm
 
Non Parametric Test by Vikramjit Singh
Non Parametric Test by  Vikramjit SinghNon Parametric Test by  Vikramjit Singh
Non Parametric Test by Vikramjit Singh
Vikramjit Singh
 
Bio-Statistics in Bio-Medical research
Bio-Statistics in Bio-Medical researchBio-Statistics in Bio-Medical research
Bio-Statistics in Bio-Medical research
Shinjan Patra
 
Statistical Methods in Research
Statistical Methods in ResearchStatistical Methods in Research
Statistical Methods in Research
Manoj Sharma
 
Statistical Analysis and Hypothesis Tesing
Statistical Analysis and Hypothesis TesingStatistical Analysis and Hypothesis Tesing
Statistical Analysis and Hypothesis Tesing
ManishaPatil932723
 
UNIT I -Data and Data Collection1.ppt
UNIT I -Data and Data Collection1.pptUNIT I -Data and Data Collection1.ppt
UNIT I -Data and Data Collection1.ppt
NAGESH108233
 

Similar to DSE-2, ANALYTICAL METHODS.pptx (20)

Standard deviation
Standard deviationStandard deviation
Standard deviation
 
1625941932480.pptx
1625941932480.pptx1625941932480.pptx
1625941932480.pptx
 
linearity concept of significance, standard deviation, chi square test, stude...
linearity concept of significance, standard deviation, chi square test, stude...linearity concept of significance, standard deviation, chi square test, stude...
linearity concept of significance, standard deviation, chi square test, stude...
 
Bgy5901
Bgy5901Bgy5901
Bgy5901
 
Statistics
StatisticsStatistics
Statistics
 
STATISTICAL PARAMETERS
STATISTICAL  PARAMETERSSTATISTICAL  PARAMETERS
STATISTICAL PARAMETERS
 
Unit 3 Sampling
Unit 3 SamplingUnit 3 Sampling
Unit 3 Sampling
 
Biostatistics
BiostatisticsBiostatistics
Biostatistics
 
Selection and calibration of analytical method & calibration methods
Selection and calibration  of analytical method & calibration methodsSelection and calibration  of analytical method & calibration methods
Selection and calibration of analytical method & calibration methods
 
MEASURES OF DISPERSION I BSc Botany .ppt
MEASURES OF DISPERSION I BSc Botany .pptMEASURES OF DISPERSION I BSc Botany .ppt
MEASURES OF DISPERSION I BSc Botany .ppt
 
Parametric tests
Parametric testsParametric tests
Parametric tests
 
tests of significance
tests of significancetests of significance
tests of significance
 
Basic Statistical Descriptions of Data.pptx
Basic Statistical Descriptions of Data.pptxBasic Statistical Descriptions of Data.pptx
Basic Statistical Descriptions of Data.pptx
 
Advanced statistics
Advanced statisticsAdvanced statistics
Advanced statistics
 
Measures of central tendency
Measures of central tendencyMeasures of central tendency
Measures of central tendency
 
Non Parametric Test by Vikramjit Singh
Non Parametric Test by  Vikramjit SinghNon Parametric Test by  Vikramjit Singh
Non Parametric Test by Vikramjit Singh
 
Bio-Statistics in Bio-Medical research
Bio-Statistics in Bio-Medical researchBio-Statistics in Bio-Medical research
Bio-Statistics in Bio-Medical research
 
Statistical Methods in Research
Statistical Methods in ResearchStatistical Methods in Research
Statistical Methods in Research
 
Statistical Analysis and Hypothesis Tesing
Statistical Analysis and Hypothesis TesingStatistical Analysis and Hypothesis Tesing
Statistical Analysis and Hypothesis Tesing
 
UNIT I -Data and Data Collection1.ppt
UNIT I -Data and Data Collection1.pptUNIT I -Data and Data Collection1.ppt
UNIT I -Data and Data Collection1.ppt
 

More from Mathabhanga College

Chemical explosives.pptx
Chemical explosives.pptxChemical explosives.pptx
Chemical explosives.pptx
Mathabhanga College
 
Paints.pptx
Paints.pptxPaints.pptx
Paints.pptx
Mathabhanga College
 
glass.pptx
glass.pptxglass.pptx
Cement.pptx
Cement.pptxCement.pptx
Cement.pptx
Mathabhanga College
 
DSE-2, ANALYTICAL METHODS -Ch-II.pptx
DSE-2, ANALYTICAL METHODS -Ch-II.pptxDSE-2, ANALYTICAL METHODS -Ch-II.pptx
DSE-2, ANALYTICAL METHODS -Ch-II.pptx
Mathabhanga College
 
Pharmaceutical Chemistry - Last part.pptx
Pharmaceutical Chemistry - Last part.pptxPharmaceutical Chemistry - Last part.pptx
Pharmaceutical Chemistry - Last part.pptx
Mathabhanga College
 
Pharma New-1.pdf
Pharma New-1.pdfPharma New-1.pdf
Pharma New-1.pdf
Mathabhanga College
 
Pharmaceutical Chemistry.pptx
Pharmaceutical Chemistry.pptxPharmaceutical Chemistry.pptx
Pharmaceutical Chemistry.pptx
Mathabhanga College
 

More from Mathabhanga College (8)

Chemical explosives.pptx
Chemical explosives.pptxChemical explosives.pptx
Chemical explosives.pptx
 
Paints.pptx
Paints.pptxPaints.pptx
Paints.pptx
 
glass.pptx
glass.pptxglass.pptx
glass.pptx
 
Cement.pptx
Cement.pptxCement.pptx
Cement.pptx
 
DSE-2, ANALYTICAL METHODS -Ch-II.pptx
DSE-2, ANALYTICAL METHODS -Ch-II.pptxDSE-2, ANALYTICAL METHODS -Ch-II.pptx
DSE-2, ANALYTICAL METHODS -Ch-II.pptx
 
Pharmaceutical Chemistry - Last part.pptx
Pharmaceutical Chemistry - Last part.pptxPharmaceutical Chemistry - Last part.pptx
Pharmaceutical Chemistry - Last part.pptx
 
Pharma New-1.pdf
Pharma New-1.pdfPharma New-1.pdf
Pharma New-1.pdf
 
Pharmaceutical Chemistry.pptx
Pharmaceutical Chemistry.pptxPharmaceutical Chemistry.pptx
Pharmaceutical Chemistry.pptx
 

Recently uploaded

Salas, V. (2024) "John of St. Thomas (Poinsot) on the Science of Sacred Theol...
Salas, V. (2024) "John of St. Thomas (Poinsot) on the Science of Sacred Theol...Salas, V. (2024) "John of St. Thomas (Poinsot) on the Science of Sacred Theol...
Salas, V. (2024) "John of St. Thomas (Poinsot) on the Science of Sacred Theol...
Studia Poinsotiana
 
DMARDs Pharmacolgy Pharm D 5th Semester.pdf
DMARDs Pharmacolgy Pharm D 5th Semester.pdfDMARDs Pharmacolgy Pharm D 5th Semester.pdf
DMARDs Pharmacolgy Pharm D 5th Semester.pdf
fafyfskhan251kmf
 
原版制作(carleton毕业证书)卡尔顿大学毕业证硕士文凭原版一模一样
原版制作(carleton毕业证书)卡尔顿大学毕业证硕士文凭原版一模一样原版制作(carleton毕业证书)卡尔顿大学毕业证硕士文凭原版一模一样
原版制作(carleton毕业证书)卡尔顿大学毕业证硕士文凭原版一模一样
yqqaatn0
 
In silico drugs analogue design: novobiocin analogues.pptx
In silico drugs analogue design: novobiocin analogues.pptxIn silico drugs analogue design: novobiocin analogues.pptx
In silico drugs analogue design: novobiocin analogues.pptx
AlaminAfendy1
 
Unveiling the Energy Potential of Marshmallow Deposits.pdf
Unveiling the Energy Potential of Marshmallow Deposits.pdfUnveiling the Energy Potential of Marshmallow Deposits.pdf
Unveiling the Energy Potential of Marshmallow Deposits.pdf
Erdal Coalmaker
 
Orion Air Quality Monitoring Systems - CWS
Orion Air Quality Monitoring Systems - CWSOrion Air Quality Monitoring Systems - CWS
Orion Air Quality Monitoring Systems - CWS
Columbia Weather Systems
 
DERIVATION OF MODIFIED BERNOULLI EQUATION WITH VISCOUS EFFECTS AND TERMINAL V...
DERIVATION OF MODIFIED BERNOULLI EQUATION WITH VISCOUS EFFECTS AND TERMINAL V...DERIVATION OF MODIFIED BERNOULLI EQUATION WITH VISCOUS EFFECTS AND TERMINAL V...
DERIVATION OF MODIFIED BERNOULLI EQUATION WITH VISCOUS EFFECTS AND TERMINAL V...
Wasswaderrick3
 
erythropoiesis-I_mechanism& clinical significance.pptx
erythropoiesis-I_mechanism& clinical significance.pptxerythropoiesis-I_mechanism& clinical significance.pptx
erythropoiesis-I_mechanism& clinical significance.pptx
muralinath2
 
PRESENTATION ABOUT PRINCIPLE OF COSMATIC EVALUATION
PRESENTATION ABOUT PRINCIPLE OF COSMATIC EVALUATIONPRESENTATION ABOUT PRINCIPLE OF COSMATIC EVALUATION
PRESENTATION ABOUT PRINCIPLE OF COSMATIC EVALUATION
ChetanK57
 
THE IMPORTANCE OF MARTIAN ATMOSPHERE SAMPLE RETURN.
THE IMPORTANCE OF MARTIAN ATMOSPHERE SAMPLE RETURN.THE IMPORTANCE OF MARTIAN ATMOSPHERE SAMPLE RETURN.
THE IMPORTANCE OF MARTIAN ATMOSPHERE SAMPLE RETURN.
Sérgio Sacani
 
bordetella pertussis.................................ppt
bordetella pertussis.................................pptbordetella pertussis.................................ppt
bordetella pertussis.................................ppt
kejapriya1
 
Chapter 12 - climate change and the energy crisis
Chapter 12 - climate change and the energy crisisChapter 12 - climate change and the energy crisis
Chapter 12 - climate change and the energy crisis
tonzsalvador2222
 
NuGOweek 2024 Ghent - programme - final version
NuGOweek 2024 Ghent - programme - final versionNuGOweek 2024 Ghent - programme - final version
NuGOweek 2024 Ghent - programme - final version
pablovgd
 
Nucleic Acid-its structural and functional complexity.
Nucleic Acid-its structural and functional complexity.Nucleic Acid-its structural and functional complexity.
Nucleic Acid-its structural and functional complexity.
Nistarini College, Purulia (W.B) India
 
GBSN- Microbiology (Lab 3) Gram Staining
GBSN- Microbiology (Lab 3) Gram StainingGBSN- Microbiology (Lab 3) Gram Staining
GBSN- Microbiology (Lab 3) Gram Staining
Areesha Ahmad
 
Toxic effects of heavy metals : Lead and Arsenic
Toxic effects of heavy metals : Lead and ArsenicToxic effects of heavy metals : Lead and Arsenic
Toxic effects of heavy metals : Lead and Arsenic
sanjana502982
 
Mammalian Pineal Body Structure and Also Functions
Mammalian Pineal Body Structure and Also FunctionsMammalian Pineal Body Structure and Also Functions
Mammalian Pineal Body Structure and Also Functions
YOGESH DOGRA
 
Earliest Galaxies in the JADES Origins Field: Luminosity Function and Cosmic ...
Earliest Galaxies in the JADES Origins Field: Luminosity Function and Cosmic ...Earliest Galaxies in the JADES Origins Field: Luminosity Function and Cosmic ...
Earliest Galaxies in the JADES Origins Field: Luminosity Function and Cosmic ...
Sérgio Sacani
 
Leaf Initiation, Growth and Differentiation.pdf
Leaf Initiation, Growth and Differentiation.pdfLeaf Initiation, Growth and Differentiation.pdf
Leaf Initiation, Growth and Differentiation.pdf
RenuJangid3
 
Hemostasis_importance& clinical significance.pptx
Hemostasis_importance& clinical significance.pptxHemostasis_importance& clinical significance.pptx
Hemostasis_importance& clinical significance.pptx
muralinath2
 

Recently uploaded (20)

Salas, V. (2024) "John of St. Thomas (Poinsot) on the Science of Sacred Theol...
Salas, V. (2024) "John of St. Thomas (Poinsot) on the Science of Sacred Theol...Salas, V. (2024) "John of St. Thomas (Poinsot) on the Science of Sacred Theol...
Salas, V. (2024) "John of St. Thomas (Poinsot) on the Science of Sacred Theol...
 
DMARDs Pharmacolgy Pharm D 5th Semester.pdf
DMARDs Pharmacolgy Pharm D 5th Semester.pdfDMARDs Pharmacolgy Pharm D 5th Semester.pdf
DMARDs Pharmacolgy Pharm D 5th Semester.pdf
 
原版制作(carleton毕业证书)卡尔顿大学毕业证硕士文凭原版一模一样
原版制作(carleton毕业证书)卡尔顿大学毕业证硕士文凭原版一模一样原版制作(carleton毕业证书)卡尔顿大学毕业证硕士文凭原版一模一样
原版制作(carleton毕业证书)卡尔顿大学毕业证硕士文凭原版一模一样
 
In silico drugs analogue design: novobiocin analogues.pptx
In silico drugs analogue design: novobiocin analogues.pptxIn silico drugs analogue design: novobiocin analogues.pptx
In silico drugs analogue design: novobiocin analogues.pptx
 
Unveiling the Energy Potential of Marshmallow Deposits.pdf
Unveiling the Energy Potential of Marshmallow Deposits.pdfUnveiling the Energy Potential of Marshmallow Deposits.pdf
Unveiling the Energy Potential of Marshmallow Deposits.pdf
 
Orion Air Quality Monitoring Systems - CWS
Orion Air Quality Monitoring Systems - CWSOrion Air Quality Monitoring Systems - CWS
Orion Air Quality Monitoring Systems - CWS
 
DERIVATION OF MODIFIED BERNOULLI EQUATION WITH VISCOUS EFFECTS AND TERMINAL V...
DERIVATION OF MODIFIED BERNOULLI EQUATION WITH VISCOUS EFFECTS AND TERMINAL V...DERIVATION OF MODIFIED BERNOULLI EQUATION WITH VISCOUS EFFECTS AND TERMINAL V...
DERIVATION OF MODIFIED BERNOULLI EQUATION WITH VISCOUS EFFECTS AND TERMINAL V...
 
erythropoiesis-I_mechanism& clinical significance.pptx
erythropoiesis-I_mechanism& clinical significance.pptxerythropoiesis-I_mechanism& clinical significance.pptx
erythropoiesis-I_mechanism& clinical significance.pptx
 
PRESENTATION ABOUT PRINCIPLE OF COSMATIC EVALUATION
PRESENTATION ABOUT PRINCIPLE OF COSMATIC EVALUATIONPRESENTATION ABOUT PRINCIPLE OF COSMATIC EVALUATION
PRESENTATION ABOUT PRINCIPLE OF COSMATIC EVALUATION
 
THE IMPORTANCE OF MARTIAN ATMOSPHERE SAMPLE RETURN.
THE IMPORTANCE OF MARTIAN ATMOSPHERE SAMPLE RETURN.THE IMPORTANCE OF MARTIAN ATMOSPHERE SAMPLE RETURN.
THE IMPORTANCE OF MARTIAN ATMOSPHERE SAMPLE RETURN.
 
bordetella pertussis.................................ppt
bordetella pertussis.................................pptbordetella pertussis.................................ppt
bordetella pertussis.................................ppt
 
Chapter 12 - climate change and the energy crisis
Chapter 12 - climate change and the energy crisisChapter 12 - climate change and the energy crisis
Chapter 12 - climate change and the energy crisis
 
NuGOweek 2024 Ghent - programme - final version
NuGOweek 2024 Ghent - programme - final versionNuGOweek 2024 Ghent - programme - final version
NuGOweek 2024 Ghent - programme - final version
 
Nucleic Acid-its structural and functional complexity.
Nucleic Acid-its structural and functional complexity.Nucleic Acid-its structural and functional complexity.
Nucleic Acid-its structural and functional complexity.
 
GBSN- Microbiology (Lab 3) Gram Staining
GBSN- Microbiology (Lab 3) Gram StainingGBSN- Microbiology (Lab 3) Gram Staining
GBSN- Microbiology (Lab 3) Gram Staining
 
Toxic effects of heavy metals : Lead and Arsenic
Toxic effects of heavy metals : Lead and ArsenicToxic effects of heavy metals : Lead and Arsenic
Toxic effects of heavy metals : Lead and Arsenic
 
Mammalian Pineal Body Structure and Also Functions
Mammalian Pineal Body Structure and Also FunctionsMammalian Pineal Body Structure and Also Functions
Mammalian Pineal Body Structure and Also Functions
 
Earliest Galaxies in the JADES Origins Field: Luminosity Function and Cosmic ...
Earliest Galaxies in the JADES Origins Field: Luminosity Function and Cosmic ...Earliest Galaxies in the JADES Origins Field: Luminosity Function and Cosmic ...
Earliest Galaxies in the JADES Origins Field: Luminosity Function and Cosmic ...
 
Leaf Initiation, Growth and Differentiation.pdf
Leaf Initiation, Growth and Differentiation.pdfLeaf Initiation, Growth and Differentiation.pdf
Leaf Initiation, Growth and Differentiation.pdf
 
Hemostasis_importance& clinical significance.pptx
Hemostasis_importance& clinical significance.pptxHemostasis_importance& clinical significance.pptx
Hemostasis_importance& clinical significance.pptx
 

DSE-2, ANALYTICAL METHODS.pptx

  • 1. Dr. Santanu Chakravorty CHEMISTRY-DSE: ANALYTICAL METHODS IN CHEMISTRY Dr. Santanu Chakravorty Assistant Professor Mathabhanga College 1
  • 2. Dr. Santanu Chakravorty Syllabus Qualitative and quantitative aspects of analysis: Sampling, evaluation of analytical data, errors, accuracy and precision, methods of their expression, normal law of distribution if indeterminate errors, statistical test of data; F, Q and t test, rejection of data, and confidence intervals. 2
  • 3. Dr. Santanu Chakravorty Errors • Determinate (systematic) Errors: These are errors which can be avoided or whose magnitude can be determined. These are definite or constant errors which include instrumental, operational, personal, reagent, additive and proportional. • Indeterminate (random) Errors: If a particular person carried out the analysis of a substances in the same laboratory and under similar sets of conditions, most of the time there is slight variation in the results obtains over which the analyst has no controls. Such errors are called indeterminate errors. Main Differences: Determinate errors are those errors which have definite values whereas indeterminate errors are those which possess indefinite value and follow law and invariably have fluctuating values. •Determinate errors are of various kinds depending upon their origin viz. methodic, operational, instrumental etc. Indeterminate errors arise from variation of indeterminate errors or which are erratic in occurrence. •The determinate errors can be reduced by controlling the origin of the error but the analyst has no control over indeterminate errors. 3
  • 4. Dr. Santanu Chakravorty Minimization of Errors Systematic (determinate) errors can be reduced by a no of methods: • Calibration of apparatus and application of corrections: All instruments (weights, flasks, burettes, pipettes etc) should be calibrated and the appropriate corrections applied to the original measurements. In some cases where an error cannot be eliminates it is possible to apply a correction for the effect that it produces. Thus an impurity in a weighed precipitate may be determined and its weight deducted. • Running a blank determination: This consists of in carrying out a separate determination, the sample being omitted, under exactly the same experimental conditions as are employed in the actual analysis of the sample. The object is to find out the effect of the impurities introduced through the reagents and vessels, or to determine the excess of standard solution necessary to establish the end- point under the conditions met with in the titration of the unknown sample  Indeterminate errors on the other hand can be minimized by repeating the experimental work a no of times and then taking the average of the results 4
  • 5. Dr. Santanu Chakravorty Absolute and Relative Errors • When a quantity is measured even with extreme care, it is found that the results of successive determinations differ among themselves. The average value is accepted as the most probable. This may not always be the true value. • The absolute error of a determination is the difference between the observed (or measured) value and the true value of the quantity measured. It is a measure of the accuracy of the measurement. • The relative error is the absolute error divided by the true value. It is usually expressed in terms of percentage. The true or absolute values of a quantity can not be compared with the most probable value. • If x is the actual value of a quantity, x0 is the measured value of the quantity and Δx is the absolute error, then the relative error can be measured using the below formula. • Relative error = (x0-x)/x = (Δx)/x 5
  • 6. Dr. Santanu Chakravorty Precision Precision is defined as the degree of agreement between a numerical value and other values of measurement. Precision doe not by any means imply accuracy it is used to describe the reproducibility of results. It also implies nothing about their relation to the true values. It is the close agreement of values among a group of experimental results carried out by different persons on the same method or by different person on different methods on the same measurement. The results may show a high degree of precision or good agreement with one another, yet have poor accuracy or agreement with the true value. The precision of a measurement is evaluated from data itself, by the agreement among separate values. Various methods are used to describe the precision of measurements. Precision is commonly evaluates by the application of statistical methods to deviations among measurements, like average deviation, standard deviation , range etc. Accuracy on the other hand is the agreement between the observed value and most probable (true) values. • Median: The median is the average or middle value of in a set. For an odd number of values, the middle value is the median, and for an even no values, the average of the two middle values is the median. The median is more likely to be closer to the true value than the mean, because a single bad result may influence the mean more than the median. For the odd values 18,19, 20, 21, 22, the median = 20 For the even values 18, 19, 20, 21, 22, 23 the median = 20+21/2 = 20.5 6
  • 7. Dr. Santanu Chakravorty Continued…… • Arithmetic mean or average: The mean ( x̄ ) is the sum of the individual measurements (xi) of some quantity divided by the number of measurements (n). The mean is calculated by the formula: where x̄ is the ith measured value of x. • Mode: The mode is the frequency or no of occasion upon which a given value appears in the data. For example, for a set of observations 5, 4, 6, 6, 4, 5, 6, 6, 3, the mode is 6 and the frequency of this value is 4. • Deviation: The difference between any results of an analysis and the mean of a series of results is called the deviation from the mean. The deviation is positive if the value is greater than the mean, and negative if it is less than the mean. It is denoted by d. • Average deviation: It is the average of the absolute value of deviations in a series of determinations. Its relative magnitude is indicative of the precision of a series of determinations. The smaller the average deviation, the greater is the precision. The average deviation is represented by the given formula: 7
  • 8. Dr. Santanu Chakravorty Continued…… • Standard deviation: When there are four or more determinations, we often use the term standard deviation instead of average deviation. The standard deviation carries more statistical significance than the average deviation. The standard deviation is represented as s and is given by: • Range: The range is the arithmetical differences between the smallest and the largest values of a series • Variance: The square of the standard deviation is called variance. The coefficient of variance is an accurate measure of the precision and is given by 8
  • 9. Dr. Santanu Chakravorty Frequency Distribution: Distribution of Experimental Data It is a method to represent large number of finite population of organized data after proper correction of determinate errors, the remaining fluctuations in the data are found to be random in nature. These data may be associated with undetectable random errors that are attributable to uncontrollable variable in the experiment. This small random errors in most of the cases cancel one another and their effect is minimum. However, these errors may be unidirectional and thus they produce large positive or negative net error. The sources of random errors may be due to the visual judgment, temperature fluctuation, time variation. We cannot identify the contribution of any one of these sources of error in the measurement so that their combined effect is responsible for the scatter of data around the mean. These unrecognized data are organized to form the frequency distribution data which consist of range from the lowest to the highest value into a convenient number of intervals or range and then count the number of values falling within each range. In this process there involves some loss of information of the data but this is more convenient to represent the data in condensed form. Usually the range is divided into equal intervals and sometimes confusion is avoided by choosing range boundaries halfway between possible observed data. A plot of the frequency distribution data is known as frequency distribution curve or histogram. This is also known as bar graph or frequency polygon curve in which the percentage of measured values are plotted against the range values. This curve also known as Gaussian Curve. 9
  • 10. Dr. Santanu Chakravorty The normal error curve Gaussian curve It is quite evident that there may be the infinite number of measurements comprising an universe of data and it is actually called infinite population to which the normal error function is related. An analyst may take finite number of replicate measurements which is called sample. The sample may be made in a random fashion from a hypothetical infinite population, thus it is expected that sample is representative one and fluctuations in its individual values may be considered to be normally distributed so that all terms associated with the normal error function may be employed in their analysis. Continuous data resulting from infinite population fall within a range of values which satisfy the normal of Gaussian distribution. This a bell-shaped curve which is symmetrical about the mean. An analyst can differentiate between a sample mean ẋ and population mean μ. 10
  • 11. Dr. Santanu Chakravorty Statistical Evaluation of Analytical data The statistical evaluation of analytical data is based on experimental measurements and the judgment of these experiment data is made trough sample mean (ẋ), population mean (μ), population standard deviation (Ϭ) etc. , which are already discussed. In the case of replicate data we have to consider statically the following aspect: 1. confidence interval and confidence limit of replicate data 2. establishment of confidence interval of the mean of the experimental data 3. determination of probability whether an experimental mean is different from accepted value. 4. establishment of a given probability level whether two experimental mean are different. 5. to establish the probability level whether the precision of two sets of measurements differ 6. to establish the detection limits for a measurement etc. 11
  • 12. Dr. Santanu Chakravorty Confidence limit, confidence level and confidence interval • A confidence interval (CI) is a type of interval estimate, computed from the statistics of the observed data, that might contain the true value of unknown population parameter. • Confidence level is quantities the level of confidence that the deterministic parameter is captured by the interval. More strictly speaking, the confidence level represents the frequency of possible confidence intervals that contain the true value of the unknown population parameter. • To calculate the confidence limits for a measurement variable, multiply the standard error of the mean times the appropriate t-value. The t-value is determined by the probability and the degree of freedom (n-1) 12
  • 13. Dr. Santanu Chakravorty t and F test • A t-test is a form of the statistical hypothesis test, based on Student’s t-statistic and t-distribution to find out the p-value (probability) which can be used to accept or reject the null hypothesis. • T-test analyses if the means of two data sets are greatly different from each other, i.e. whether the population mean is equal to or different from the standard mean. It can also be used to ascertain whether the regression line has a slope different from zero. The test relies on a number of assumptions, which are: • The population is infinite and normal. • Population variance is unknown and estimated from the sample. • The mean is known. • Sample observations are random and independent. • The sample size is small. • Mean and standard deviation of the two samples are used to make comparison between them, such that: x̄1 = Mean of the first dataset, x̄2 = Mean of the second dataset S1 = Standard deviation of the first dataset, S2 = Standard deviation of the second dataset, n1 = Size of first dataset, n2 = Size of second dataset 13
  • 14. Dr. Santanu Chakravorty t and F test • F-test is described as a type of hypothesis test, that is based on Snedecor f- distribution, under the null hypothesis. The test is performed when it is not known whether the two populations have the same variance. • F-test can also be used to check if the data conforms to a regression model, which is acquired through least square analysis. When there is multiple linear regression analysis, it examines the overall validity of the model or determines whether any of the independent variables is having a linear relationship with the dependent variable. A number of predictions can be made through, the comparison of the two datasets. The expression of the f-test value is in the ratio of variances of the two observations, which is shown below: Where, S2 = variance • The assumptions on which f-test relies are: • The population is normally distributed. • Samples have been drawn randomly. • Observations are independent. 14
  • 15. Dr. Santanu Chakravorty Key Differences Between T-test and F-test • The difference between t-test and f-test can be drawn clearly on the following grounds: • A univariate hypothesis test that is applied when the standard deviation is not known and the sample size is small is t-test. On the other hand, a statistical test, which determines the equality of the variances of the two normal datasets, is known as f-test. • The t-test is based on T-statistic follows Student t-distribution, under the null hypothesis. Conversely, the basis of the f-test is F-statistic follows Snedecor f- distribution, under the null hypothesis. • The t-test is used to compare the means of two populations. In contrast, f-test is used to compare two population variances. 15
  • 16. Dr. Santanu Chakravorty Q test In a set of replicate measurements of large number of data if one of the result may vary excessively from the average value i.e. the value is either too high or two low from the average, then a decision must be made whether we shall retain or reject it. Several statistical test are performed for this. However there is no universal rule can be applied to settle the question of retention or rejection of that particular data. A simplified test which is widely used is called Q-test (quotient test) described by Dean and Dixon. It involve the following steps: (a) The results of measurements are arranged in decreasing order. (b) The range of the results is calculated (c) The difference between the questionable or suspected results xq and its nearest neighbor xn is divided by the spread or range R of the entire set to obtain a quantity Qexp as: (d) The Qexp is then compared with the critical value of the rejection ratio Qcrit found at appropriate confidence level (e) If Qexp> Qcrit, the questionable or the suspected result can be discarded at the appropriate confidence level 16
  • 17. Dr. Santanu Chakravorty Mathematical Problem • Four sample of a silver alloy were analyzed and were found to have the following percentages of silver Sample 1(Ag% 16.37), Sample 2 (Ag% 16.29), Sample 3 (Ag% 16.39), sample 4 (Ag% 16.35), calculate the average deviation and standard deviation. Average value ẋ = 16.37+ 16.29 + 16.39 +16.35/4 = 16.35% The deviation d1 = 16.37-16.35 = 0.04 The deviation d2 = 16.29-16.35 = -0.06 The deviation d3 = 16.39-16.35 = 0.04 The deviation d4 = 16.35-16.35 = 0.00 Average deviation = d1+d2+d3+d4/4 = 0.02+0.06+0.04+0.00/4 = 0.03 Standard deviation 17 = 0.0435 • The normality of a solution determined by four separate titrations results being 0.2041, 0.2049, 0.2039 and 0.2043. Calculate mean, median, range, average, deviation, relative average deviation, standard deviation and the coefficient of variances (do it yourself)