This document discusses several key indicators and phases of the El Niño-Southern Oscillation (ENSO) cycle in the tropical Pacific:
(1) It describes the typical conditions during La Niña versus El Niño phases, including differences in sea surface temperatures, wind patterns, thermocline depth and precipitation across the eastern and western tropical Pacific.
(2) It explains how ENSO is a coupled ocean-atmosphere phenomenon, with interactions and feedbacks between the two systems either enhancing or suppressing the phases.
(3) It provides illustrations of the average December-February conditions and how the patterns differ and evolve during La Niña and El Niño episodes.
This presentation have all what you need to present about Monsoon winds, even it's types.
If you want to learn geophysics/geology
visit my blog
http://geophysicsdiary.blogspot.com/
This presentation have all what you need to present about Monsoon winds, even it's types.
If you want to learn geophysics/geology
visit my blog
http://geophysicsdiary.blogspot.com/
El Niño is a naturally occurring event in the equatorial region which causes temporary changes in the world climate.
Originally, El Niño was the name used for warmer than normal sea surface temperatures in the Pacific Ocean off the coast of South America.
Now, El Niño has come to refer to a whole complex of Pacific Ocean sea-surface temperature changes and global weather events.
The ocean warming off South America is just one of these events.
ENSO is a single climate phenomenon, it has three states, or phases, it can be in. The two opposite phases, “El Niño” and “La Niña,” require certain changes in both the ocean and the atmosphere because ENSO is a coupled climate phenomenon. “Neutral” is in the middle of the continuum.
*You may also download this ppt for better viewing experience :)
This ppt contains a summary of El Niño and La Niña.
It also includes the following:
> ENSO
> Southern Oscillation
> Southern Oscillation Index (SOI)
> Effects of El Niño
> Response to El Niño
> Effects of La Niña
> Response to La Niña
Oceans are a vast body of salt water that covers almost three to fourths of the earth's surface.
Seas are smaller, found on the margins of the ocean and are partially enclosed by land.
Seawater:
High density, high heat capacity, colder, salty and slightly compressible (its volume decreases under pressure), thus its density increases with pressure.
Why is Ocean Circulation Important?
•Similar to winds in the atmosphere, they transfer significant amounts of heat from equatorial areas to the poles and thus play important roles in determining the climates of coastal regions.
•The ocean circulation pattern exchanges water of varying characteristics, such as temperature and salinity
•ocean currents and atmospheric circulation influence one another.
•in addition, they transport nutrients and organisms
This PowerPoint presentation will tell you about the El Nino, its causes and its impact on the different region of earth including case study of El Nino that occured in 1982-83.
Resource conservation, tools for screening climate smart practices and public...Prabhakar SVRK
Natural resources continue to play an important role in livelihood and wellbeing of millions. Over exploitation and degradation of natural resource base have led to declining factor productivity in rural areas and dwindling farm profits coupled with debilitating impact on human health. This necessitates promoting technologies that can help producing food keeping pace with the growing population while conserving natural resource base and be profitable. Achieving this conflicting target though appears to be challenging but is possible with the currently available technologies. This lecture will provide insights into a gamut of resource conserving technologies, the role of communities in promoting them and tools that can help in identifying suitable technologies for adoption. The lecture will heavily borrow sustainable agriculture cases from the Asia Pacific region.
Outline
• Natural resource dependency and rural development
o Trends in resource depletion and impact on food production
o Farm profitability trends and input use
o Trends in factor productivity
• Resource conserving technologies and climate smart agriculture
o What are they?
o Similarities and differences
o Costs and benefits of pursuing them
• Tools for identifying resource conserving and climate smart agriculture technologies
o Factor productivity
o Benefit cost ratios
o Marginal abatement costs
• Role of communities
o Communities as entry point
o Benefits of community participation
• Concluding thoughts
o How to scale up resource conservation?
Keeping its promise to progressively contribute towards a cleaner and greener planet, India’s largest global flexible packaging solution company Uflex has rolled out natural resource conservation initiatives
El Nino, La Nina, Ocean Circulation, Weather and Climate Unit, Earth Science ...www.sciencepowerpoint.com
This PowerPoint is one small part of the Weather and Climate unit from www.sciencepowerpoint.com. This unit consists of a five part 2500+ slide PowerPoint roadmap, 14 page bundled homework package, modified homework, detailed answer keys, 19 pages of unit notes for students who may require assistance, follow along worksheets, and many review games. The homework and lesson notes chronologically follow the PowerPoint slideshow. The answer keys and unit notes are great for support professionals. The activities and discussion questions in the slideshow are meaningful. The PowerPoint includes built-in instructions, visuals, and review questions. Also included are critical class notes (color coded red), project ideas, video links, and review games. This unit also includes four PowerPoint review games (110+ slides each with Answers), 38+ video links, lab handouts, activity sheets, rubrics, materials list, templates, guides, and much more. Also included is a 190 slide first day of school PowerPoint presentation.
Areas of Focus within The Weather and Climate Unit: -What is weather?, Climate, Importance of the Atmosphere, Components of the Atmosphere, Layers of the Atmosphere, Air Quality and Pollution, Carbon Monoxide, Ozone Layer, Ways to Avoid Skin Cancer, Air Pressure, Barometer, Air Pressure and Wind, Fronts, Wind, Global Wind, Coriolis Force, Jet Stream, Sea Breeze / Land Breeze, Mountain Winds, Mountain Rain Shadow, Wind Chill, Flight, Dangerous Weather Systems, Light, Albedo, Temperature, Thermometers, Seasons, Humidity / Condensation / Evaporation, Dew Points, Clouds, Types of Clouds, Meteorology, Weather Tools, Isotherms, Ocean Currents, Enhanced Global Warming, Greenhouse Effect, The Effects of Global Warming, Biomes, Types of Biomes. Difficulty rating 8/10.
This unit aligns with the Next Generation Science Standards and with Common Core Standards for ELA and Literacy for Science and Technical Subjects. See preview for more information
If you have any questions please feel free to contact me. Thanks again and best wishes. Sincerely, Ryan Murphy M.Ed www.sciencepowerpoint@gmail.com
El nino and la nina impact on monsoon rainfall of India- Jitendra Kumar MeherJitendra Meher
Includes
1. Preliminary to detail Idea about El Nino and La Nina
2. Impact of El Nino and La Nina at global scale
3. Impact of El Nino and La Nina on Indian summer monsoon
4. A must check literature review
A guide to prepare for unit 2.6: The Oceans - Environmental Management syllabus 5014. The pictorial content will help understand the Ocean floor topography, Ocean Currents, and El-Nino phenomenon
There are two types of currents in the ocean1) surface curre.docxssusera34210
There are two types of currents in the ocean:
1) surface currents move the water above the pycnocline
a) ≈ 10% of the ocean
b) horizontal motion
c) wind powered = solar powered
2) thermohaline = deep currents move the water below the pycnoline (zone of rapid change of water density)
a) ≈ 90% of the ocean
b) horizontal and vertical motion
c) density driven
density depends temperature and salinity
these are also solar powered
3) these two sets of current are interconnected
Chapter 7 – Ocean Circulation
Surface currents are moved by friction between the surface winds and the water surface = wind driven.
max speed is 3% of wind speed
Since winds are solar powered,
surface currents are solar powered.
The overall pattern of surface currents is controlled by the Coriolis effect, gravity, and the shape of the ocean basin.
Like Fig 7.7, p. 205
Ekman Transport – the net (or average) motion of wind driven water, is 90° to the direction of the wind. In a perfect world, this movement is:
90° to the right in the Northern Hemisphere,
90° to the left in the Southern Hemisphere, WHY?...........the Coriolis Effect
Fig. 9-, p. 236
In the northern hemisphere, the Westerlies tends to move water southeast, while the Trade winds move water northwest!
wind direction
wind-driven water movement (Ekman Transport)
The Westerlies (30° - 60°) and the Trade Winds (0° – 30°) are the strongest winds,* and are the
main winds causing ocean currents!
Largest change in temperature causes the strongest wind!
Remember, according to Ekman Transport, wind - driven water moves 90° to the wind direction.
In the northern hemisphere, the Westerlies tends to move water southeast, while the Trade winds move water northwest!
The movement of wind-driven water can be described with a vector = an arrow pointing in the direction of travel and scaled to the speed.
This vector can be broken up into a component moving toward the edge of the ocean and a component moving toward the center of the ocean.
wind direction water movement
vectors of water movement
The water moving east or west (toward the edge of the basin) bounces
off of the land.
In the northern hemisphere,
the water
current
turns right!
Current bounces off land
Current bounces off land
Subtropical Convergence = a short (≈ 6.5 feet tall) hill of water formed when part of the wind blow water moves to the center of the ocean basin.
Can water stand in a hill?
No!
Gravity works to move the water back downhill.
BUT the wind is still working to push water uphill again
So – The winds build the hill taller, and
The taller the hill the more gravity pulls the water back downhill
The hill continues to grow until wind driven Coriolis deflected motion in = gravity driven motion out.
Then – only the circular movement around the edge of the hill is left.
THIS IS THE SURFACE CURRENT!
Garrison, 2009, Essentials of Oceanography
Under the hill of wa ...
Macroeconomics- Movie Location
This will be used as part of your Personal Professional Portfolio once graded.
Objective:
Prepare a presentation or a paper using research, basic comparative analysis, data organization and application of economic information. You will make an informed assessment of an economic climate outside of the United States to accomplish an entertainment industry objective.
Unit 8 - Information and Communication Technology (Paper I).pdfThiyagu K
This slides describes the basic concepts of ICT, basics of Email, Emerging Technology and Digital Initiatives in Education. This presentations aligns with the UGC Paper I syllabus.
Acetabularia Information For Class 9 .docxvaibhavrinwa19
Acetabularia acetabulum is a single-celled green alga that in its vegetative state is morphologically differentiated into a basal rhizoid and an axially elongated stalk, which bears whorls of branching hairs. The single diploid nucleus resides in the rhizoid.
Instructions for Submissions thorugh G- Classroom.pptxJheel Barad
This presentation provides a briefing on how to upload submissions and documents in Google Classroom. It was prepared as part of an orientation for new Sainik School in-service teacher trainees. As a training officer, my goal is to ensure that you are comfortable and proficient with this essential tool for managing assignments and fostering student engagement.
Francesca Gottschalk - How can education support child empowerment.pptxEduSkills OECD
Francesca Gottschalk from the OECD’s Centre for Educational Research and Innovation presents at the Ask an Expert Webinar: How can education support child empowerment?
A Strategic Approach: GenAI in EducationPeter Windle
Artificial Intelligence (AI) technologies such as Generative AI, Image Generators and Large Language Models have had a dramatic impact on teaching, learning and assessment over the past 18 months. The most immediate threat AI posed was to Academic Integrity with Higher Education Institutes (HEIs) focusing their efforts on combating the use of GenAI in assessment. Guidelines were developed for staff and students, policies put in place too. Innovative educators have forged paths in the use of Generative AI for teaching, learning and assessments leading to pockets of transformation springing up across HEIs, often with little or no top-down guidance, support or direction.
This Gasta posits a strategic approach to integrating AI into HEIs to prepare staff, students and the curriculum for an evolving world and workplace. We will highlight the advantages of working with these technologies beyond the realm of teaching, learning and assessment by considering prompt engineering skills, industry impact, curriculum changes, and the need for staff upskilling. In contrast, not engaging strategically with Generative AI poses risks, including falling behind peers, missed opportunities and failing to ensure our graduates remain employable. The rapid evolution of AI technologies necessitates a proactive and strategic approach if we are to remain relevant.
Operation “Blue Star” is the only event in the history of Independent India where the state went into war with its own people. Even after about 40 years it is not clear if it was culmination of states anger over people of the region, a political game of power or start of dictatorial chapter in the democratic setup.
The people of Punjab felt alienated from main stream due to denial of their just demands during a long democratic struggle since independence. As it happen all over the word, it led to militant struggle with great loss of lives of military, police and civilian personnel. Killing of Indira Gandhi and massacre of innocent Sikhs in Delhi and other India cities was also associated with this movement.
Palestine last event orientationfvgnh .pptxRaedMohamed3
An EFL lesson about the current events in Palestine. It is intended to be for intermediate students who wish to increase their listening skills through a short lesson in power point.
2024.06.01 Introducing a competency framework for languag learning materials ...Sandy Millin
http://sandymillin.wordpress.com/iateflwebinar2024
Published classroom materials form the basis of syllabuses, drive teacher professional development, and have a potentially huge influence on learners, teachers and education systems. All teachers also create their own materials, whether a few sentences on a blackboard, a highly-structured fully-realised online course, or anything in between. Despite this, the knowledge and skills needed to create effective language learning materials are rarely part of teacher training, and are mostly learnt by trial and error.
Knowledge and skills frameworks, generally called competency frameworks, for ELT teachers, trainers and managers have existed for a few years now. However, until I created one for my MA dissertation, there wasn’t one drawing together what we need to know and do to be able to effectively produce language learning materials.
This webinar will introduce you to my framework, highlighting the key competencies I identified from my research. It will also show how anybody involved in language teaching (any language, not just English!), teacher training, managing schools or developing language learning materials can benefit from using the framework.
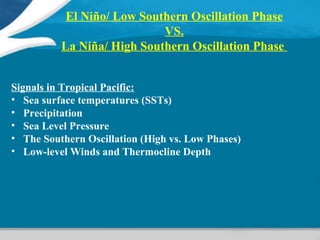
1. El Niño/ Low Southern Oscillation Phase
VS.
La Niña/ High Southern Oscillation Phase
Signals in Tropical Pacific:
• Sea surface temperatures (SSTs)
• Precipitation
• Sea Level Pressure
• The Southern Oscillation (High vs. Low Phases)
• Low-level Winds and Thermocline Depth
2. Low-Level Winds &
Thermocline Depth
La Niña: stronger-than-average
easterlies lead to a deeper
(shallower)-than-average
thermocline in the western (eastern)
eq. Pacific.
El Niño: weaker-than-average
easterlies lead to a deeper
(shallower)-than-average
thermocline in the eastern
(western) eq. Pacific.
3. ENSO: A Coupled Ocean-
Atmosphere Cycle
ENSO is a “coupled” phenomenon: atmosphere drives
the ocean and the ocean drives the atmosphere.
“Positive Feedback” between ocean and atmosphere. Example:
Weaker equatorial trade winds cold water upwelling in the
east will decrease surface warming of the ocean reduced
east-west temperature gradient Weaker equatorial trade
winds
4. What is “Average?”
Warm
Cold
Warm
Cold
Winds and Sea Surface
Temperature are COUPLED. The
SSTs influence the winds and vice
versa.
(1) Easterly trade-winds help push
warm water to the western Pacific and
upwell cold water along the equator in
the eastern Pacific Ocean.
(2) Warm water heats the
atmosphere, the air rises,
and low-level trade winds
converge toward the warm
water. Subsiding air
occurs in the eastern
Pacific basin.
December-February Average Conditions
5. “El Niño”
Warm
Cold
Warm
Cold
Warm
• Convection shifts
eastward over the central
and/or eastern Pacific
Ocean. Convection
becomes suppressed over
the far western Pacific/
Indonesia.
• Easterly trade winds
weaken
• Thermocline deepens
and the cold water
upwelling decreases in
the eastern Pacific.
7. Typical Evolution of the
ENSO Cycle
• Irregular cycle with alternating periods of warm (El
Niño) and cold (La Niña) conditions
• El Niño tends to occur every 3-7 years and generally
lasts 12-18 months
• La Niña episodes may last from 1 to 3 years
• Transitions from El Niño to La Niña are more rapid
than transitions from La Niña to El Niño.
15. Madden Julian Oscillation
• The Madden–Julian oscillation (MJO) - Each cycle lasts approximately 30–60
days. Because of this pattern, The MJO is also known as the 30–60 day
oscillation, 30–60 day wave, or intraseasonal oscillation. Rather than being a
standing pattern (like ENSO) it is a traveling pattern, propagating eastwards at
4 to 8 m/s, through the atmosphere above the warm parts of the Indian and Pacific
oceans. This overall circulation pattern manifests itself in various ways, most clearly
as anomalous rainfall. This was discovered by Roland Madden and Paul
Julian(again the comparison with ENSO is instructive, since their local effects on
Peruvian fisheries were discovered long before the global structure of the pattern
was recognized).
• The MJO is characterized by an eastward progression of large regions of both
enhanced and suppressed tropical rainfall, observed mainly over theIndian
Ocean and Pacific Ocean. The anomalous rainfall is usually first evident over the
western Indian Ocean, and remains evident as it propagates over the very warm
ocean waters of the western and central tropical Pacific.