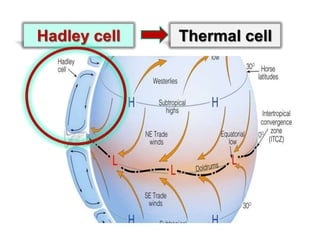
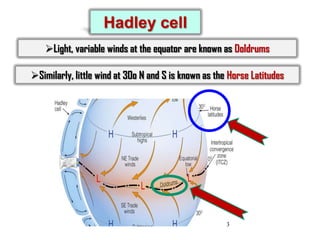
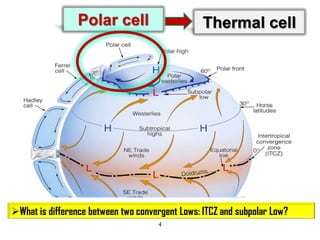
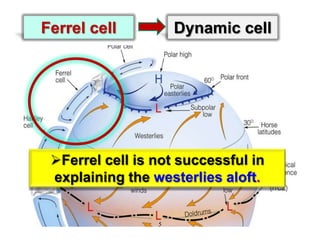
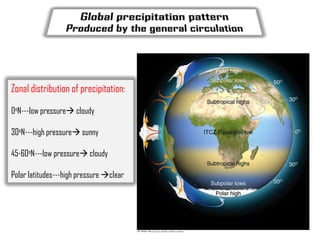
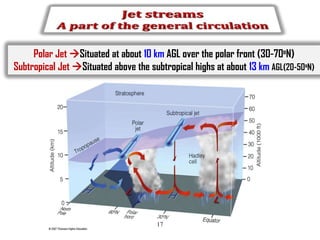
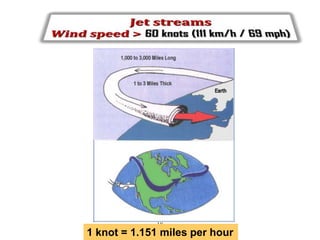
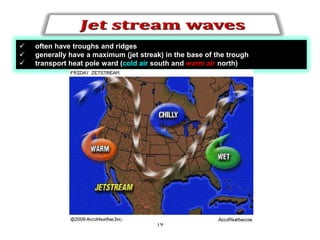
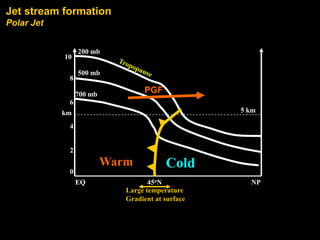
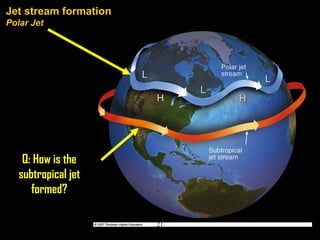
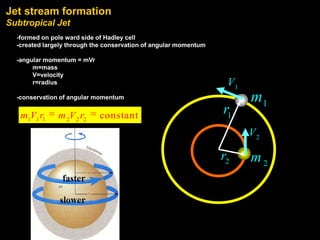
1) The document discusses general circulation patterns like the Hadley cell and polar cell. It also covers jet streams like the polar jet and subtropical jet.
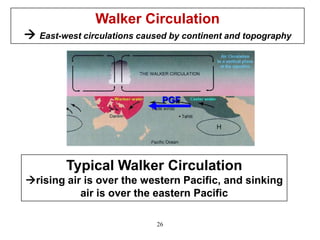
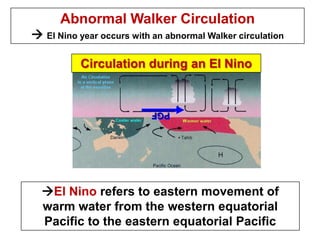
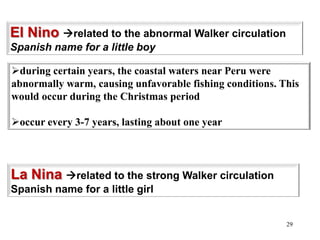
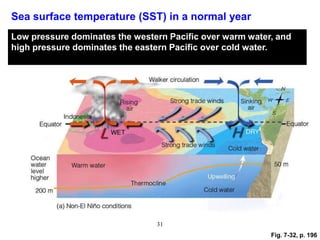
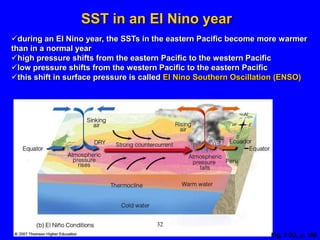
2) El Nino and La Nina events are described as being related to changes in ocean temperatures and atmospheric circulation in the Pacific. During El Nino, warm water shifts eastward.
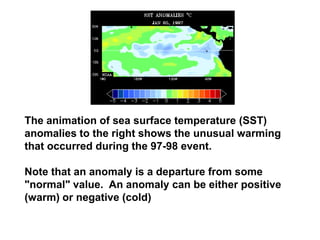
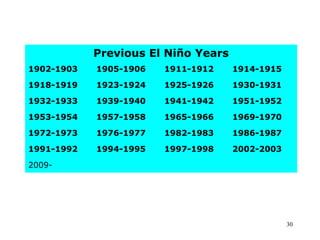
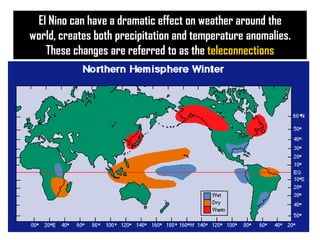
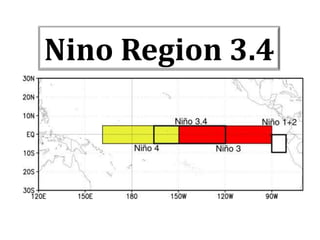
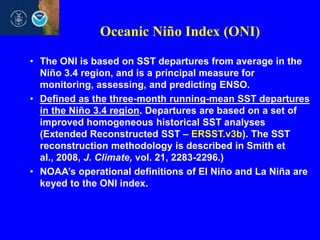
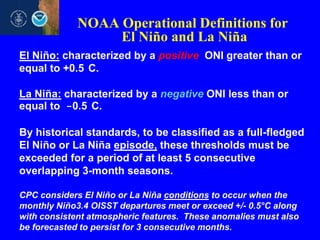
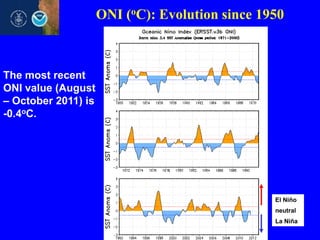
3) The impacts of El Nino include changes to weather worldwide through teleconnections. The Oceanic Nino Index (ONI) is used to define El Nino and La Nina thresholds.
The exact knowledge about the interior on the earth still remains an enigma.
Knowledge of the structure, composition, and the process going on within it would currently help scientists answer questions regarding crustal motion, earth quakes, the volcanic eruptions and the origins of the continents and of the earth itself. As the earth gradually solidified, heavier elements slowly sank towards the centre and lighter elements slowly moved upwards to the surface concentrating in the earth’s crust.
Earth’s interior is arranged roughly in concentric layers, each one distinct either in chemical composition or temperature with heat radiating outward from the centre by conduction and then by physical convection in the more plastic levels nearer the surface.
S6E3. Students will recognize the significant role of water in earth processes.
Explain that a large portion of the Earth’s surface is water, consisting of oceans, rivers, lakes, underground water, and ice.
c. Describe the composition, location, and subsurface topography of the world’s oceans.
Milancovitch Cycles explains variations in eccentricity, axial tilt, and precession of Earth. The climate changes caused by changes in the position of the Earth in comparison to the Sun. This explains the formation of ice ages.
To know the difference between the weather and the climate and to know the meteorological stations in India and their service to India and its about the world meteorological organisation and India meteorological organisation.
Resource conservation, tools for screening climate smart practices and public...Prabhakar SVRK
Natural resources continue to play an important role in livelihood and wellbeing of millions. Over exploitation and degradation of natural resource base have led to declining factor productivity in rural areas and dwindling farm profits coupled with debilitating impact on human health. This necessitates promoting technologies that can help producing food keeping pace with the growing population while conserving natural resource base and be profitable. Achieving this conflicting target though appears to be challenging but is possible with the currently available technologies. This lecture will provide insights into a gamut of resource conserving technologies, the role of communities in promoting them and tools that can help in identifying suitable technologies for adoption. The lecture will heavily borrow sustainable agriculture cases from the Asia Pacific region.
Outline
• Natural resource dependency and rural development
o Trends in resource depletion and impact on food production
o Farm profitability trends and input use
o Trends in factor productivity
• Resource conserving technologies and climate smart agriculture
o What are they?
o Similarities and differences
o Costs and benefits of pursuing them
• Tools for identifying resource conserving and climate smart agriculture technologies
o Factor productivity
o Benefit cost ratios
o Marginal abatement costs
• Role of communities
o Communities as entry point
o Benefits of community participation
• Concluding thoughts
o How to scale up resource conservation?
Keeping its promise to progressively contribute towards a cleaner and greener planet, India’s largest global flexible packaging solution company Uflex has rolled out natural resource conservation initiatives
El nino and la nina impact on monsoon rainfall of India- Jitendra Kumar MeherJitendra Meher
Includes
1. Preliminary to detail Idea about El Nino and La Nina
2. Impact of El Nino and La Nina at global scale
3. Impact of El Nino and La Nina on Indian summer monsoon
4. A must check literature review
Thermohaline Circulation & Climate ChangeArulalan T
Today I have presented "The Thermohaline Circulation and Climate Change" as Mini-Project for our Science of Climate Change Course ! We can expect THC shutdown around 2050s... OMG ! Yes, we can expect "The Day After Tomorrow" around 2100... All the images credited to the reference papers except one T-S-Sigmat created by me using CDAT5.2.
Group Presentation
Semester 03
ER2412 Introduction to Oceanography
Department of Earth Resources Engineering
University of Moratuwa
This presentation is based on ocean currents in the world,sri lanka and monsoon system in sri lanka
Climatic Controls- Latitude, Altitude, Pressure and wind system, Continentality, Ocean Currents, Relief
Importance of Himalayas
Indian Monsoon
La Nina
El NIno
Water Divide
The Earth’s climate is dynamic and characterised by trends, aberrations and quasi-periodic oscillations varying over a broad range of time-scales [1], which are governed by external (extraterrestrial systems) and/or internal(ocean, atmosphere and land system). Trends are largely controlled by plate tectonics, and thus to change gradually on million year time scale. Aberrations occur when the certain thresholds are passed and are manifested in the geological record as the unusual rapid (less than a few thousands of years) or extreme change in climate. The quasi-periodic oscillations are mostly astronomically paced; they are driven by astronomical perturbations that affect the earth’s orbit around the sun and the orientation of earth’s rotation axis with respect to its orbital plane. These perturbations are described by the three main astronomical cycles: eccentricity, precession and obliquity, which together determine the spatial and seasonal pattern of insolation received by the earth [2], eventually resulting in climatic oscillations of ten to hundreds of thousands of year [3].Sun being the main source of energy for the earth system controls the climate of it. Variation in solar activity and cosmic ray intensity has direct influence over climatic features such as cloudiness, temperature and rainfall [4]. Volcanic eruptions also force all elements of the climatic systems up to a varying degree but producing long term climatic signals in the ocean. The cumulative volcanic cooling effect at present offsets about one third of anthropogenic warming [5].Other than these causes paleoclimatologists also relates the past climate changes with movement of solar system[6], interplanetary dusts and influence of asteroids[7].However the recent variability in climate what earth is experiencing is unlikely due to any of the individual above factors rather it is due to the compound effect of complex interactions of all the natural as well as anthropogenic forcings.
References:
1. J. C. Zachos, M. Pagani, L. Sloan, E. Thomas, K. Billups, Science 292 (2001) 686-693.
2. G. Kukla, Nature (London) 253, 600 (1975).
3. J. D. Hays, J. Imbrie, N. J. Shackleton, Science 194 (1876) 1121-1132.
4. N. Marsh, H. Swensmark, Space Sci. Rev. 94 (2000) 215-230.
5. T. L. Delworth, V. Ramaswamy, G. L. Stenchikov, Geophys. Res. Lett. 32 (2005) L24709.
6. K. Fuhrer, E. W. Wolf, S. J. Johnsen, J. Geophys. Res. 104(D24) (1999) 31043-31052
7. P. Hut, W. Alvarez, W. P. Elder, T. Hansen, E. G. Kauffman, G. Keller, E. M. Shoemaker & P. R. Weissman, Nature Vol. 329, 10 September, 1987
There are two types of currents in the ocean1) surface curre.docxssusera34210
There are two types of currents in the ocean:
1) surface currents move the water above the pycnocline
a) ≈ 10% of the ocean
b) horizontal motion
c) wind powered = solar powered
2) thermohaline = deep currents move the water below the pycnoline (zone of rapid change of water density)
a) ≈ 90% of the ocean
b) horizontal and vertical motion
c) density driven
density depends temperature and salinity
these are also solar powered
3) these two sets of current are interconnected
Chapter 7 – Ocean Circulation
Surface currents are moved by friction between the surface winds and the water surface = wind driven.
max speed is 3% of wind speed
Since winds are solar powered,
surface currents are solar powered.
The overall pattern of surface currents is controlled by the Coriolis effect, gravity, and the shape of the ocean basin.
Like Fig 7.7, p. 205
Ekman Transport – the net (or average) motion of wind driven water, is 90° to the direction of the wind. In a perfect world, this movement is:
90° to the right in the Northern Hemisphere,
90° to the left in the Southern Hemisphere, WHY?...........the Coriolis Effect
Fig. 9-, p. 236
In the northern hemisphere, the Westerlies tends to move water southeast, while the Trade winds move water northwest!
wind direction
wind-driven water movement (Ekman Transport)
The Westerlies (30° - 60°) and the Trade Winds (0° – 30°) are the strongest winds,* and are the
main winds causing ocean currents!
Largest change in temperature causes the strongest wind!
Remember, according to Ekman Transport, wind - driven water moves 90° to the wind direction.
In the northern hemisphere, the Westerlies tends to move water southeast, while the Trade winds move water northwest!
The movement of wind-driven water can be described with a vector = an arrow pointing in the direction of travel and scaled to the speed.
This vector can be broken up into a component moving toward the edge of the ocean and a component moving toward the center of the ocean.
wind direction water movement
vectors of water movement
The water moving east or west (toward the edge of the basin) bounces
off of the land.
In the northern hemisphere,
the water
current
turns right!
Current bounces off land
Subtropical Convergence = a short (≈ 6.5 feet tall) hill of water formed when part of the wind blow water moves to the center of the ocean basin.
Can water stand in a hill?
No!
Gravity works to move the water back downhill.
BUT the wind is still working to push water uphill again
So – The winds build the hill taller, and
The taller the hill the more gravity pulls the water back downhill
The hill continues to grow until wind driven Coriolis deflected motion in = gravity driven motion out.
Then – only the circular movement around the edge of the hill is left.
THIS IS THE SURFACE CURRENT!
Garrison, 2009, Essentials of Oceanography
Under the hill of wa ...
Observability Concepts EVERY Developer Should Know -- DeveloperWeek Europe.pdfPaige Cruz
Monitoring and observability aren’t traditionally found in software curriculums and many of us cobble this knowledge together from whatever vendor or ecosystem we were first introduced to and whatever is a part of your current company’s observability stack.
While the dev and ops silo continues to crumble….many organizations still relegate monitoring & observability as the purview of ops, infra and SRE teams. This is a mistake - achieving a highly observable system requires collaboration up and down the stack.
I, a former op, would like to extend an invitation to all application developers to join the observability party will share these foundational concepts to build on:
GraphSummit Singapore | The Art of the Possible with Graph - Q2 2024Neo4j
Neha Bajwa, Vice President of Product Marketing, Neo4j
Join us as we explore breakthrough innovations enabled by interconnected data and AI. Discover firsthand how organizations use relationships in data to uncover contextual insights and solve our most pressing challenges – from optimizing supply chains, detecting fraud, and improving customer experiences to accelerating drug discoveries.
How to Get CNIC Information System with Paksim Ga.pptxdanishmna97
Pakdata Cf is a groundbreaking system designed to streamline and facilitate access to CNIC information. This innovative platform leverages advanced technology to provide users with efficient and secure access to their CNIC details.
LF Energy Webinar: Electrical Grid Modelling and Simulation Through PowSyBl -...DanBrown980551
Do you want to learn how to model and simulate an electrical network from scratch in under an hour?
Then welcome to this PowSyBl workshop, hosted by Rte, the French Transmission System Operator (TSO)!
During the webinar, you will discover the PowSyBl ecosystem as well as handle and study an electrical network through an interactive Python notebook.
PowSyBl is an open source project hosted by LF Energy, which offers a comprehensive set of features for electrical grid modelling and simulation. Among other advanced features, PowSyBl provides:
- A fully editable and extendable library for grid component modelling;
- Visualization tools to display your network;
- Grid simulation tools, such as power flows, security analyses (with or without remedial actions) and sensitivity analyses;
The framework is mostly written in Java, with a Python binding so that Python developers can access PowSyBl functionalities as well.
What you will learn during the webinar:
- For beginners: discover PowSyBl's functionalities through a quick general presentation and the notebook, without needing any expert coding skills;
- For advanced developers: master the skills to efficiently apply PowSyBl functionalities to your real-world scenarios.
Climate Impact of Software Testing at Nordic Testing DaysKari Kakkonen
My slides at Nordic Testing Days 6.6.2024
Climate impact / sustainability of software testing discussed on the talk. ICT and testing must carry their part of global responsibility to help with the climat warming. We can minimize the carbon footprint but we can also have a carbon handprint, a positive impact on the climate. Quality characteristics can be added with sustainability, and then measured continuously. Test environments can be used less, and in smaller scale and on demand. Test techniques can be used in optimizing or minimizing number of tests. Test automation can be used to speed up testing.
Epistemic Interaction - tuning interfaces to provide information for AI supportAlan Dix
Paper presented at SYNERGY workshop at AVI 2024, Genoa, Italy. 3rd June 2024
https://alandix.com/academic/papers/synergy2024-epistemic/
As machine learning integrates deeper into human-computer interactions, the concept of epistemic interaction emerges, aiming to refine these interactions to enhance system adaptability. This approach encourages minor, intentional adjustments in user behaviour to enrich the data available for system learning. This paper introduces epistemic interaction within the context of human-system communication, illustrating how deliberate interaction design can improve system understanding and adaptation. Through concrete examples, we demonstrate the potential of epistemic interaction to significantly advance human-computer interaction by leveraging intuitive human communication strategies to inform system design and functionality, offering a novel pathway for enriching user-system engagements.
Sudheer Mechineni, Head of Application Frameworks, Standard Chartered Bank
Discover how Standard Chartered Bank harnessed the power of Neo4j to transform complex data access challenges into a dynamic, scalable graph database solution. This keynote will cover their journey from initial adoption to deploying a fully automated, enterprise-grade causal cluster, highlighting key strategies for modelling organisational changes and ensuring robust disaster recovery. Learn how these innovations have not only enhanced Standard Chartered Bank’s data infrastructure but also positioned them as pioneers in the banking sector’s adoption of graph technology.
In the rapidly evolving landscape of technologies, XML continues to play a vital role in structuring, storing, and transporting data across diverse systems. The recent advancements in artificial intelligence (AI) present new methodologies for enhancing XML development workflows, introducing efficiency, automation, and intelligent capabilities. This presentation will outline the scope and perspective of utilizing AI in XML development. The potential benefits and the possible pitfalls will be highlighted, providing a balanced view of the subject.
We will explore the capabilities of AI in understanding XML markup languages and autonomously creating structured XML content. Additionally, we will examine the capacity of AI to enrich plain text with appropriate XML markup. Practical examples and methodological guidelines will be provided to elucidate how AI can be effectively prompted to interpret and generate accurate XML markup.
Further emphasis will be placed on the role of AI in developing XSLT, or schemas such as XSD and Schematron. We will address the techniques and strategies adopted to create prompts for generating code, explaining code, or refactoring the code, and the results achieved.
The discussion will extend to how AI can be used to transform XML content. In particular, the focus will be on the use of AI XPath extension functions in XSLT, Schematron, Schematron Quick Fixes, or for XML content refactoring.
The presentation aims to deliver a comprehensive overview of AI usage in XML development, providing attendees with the necessary knowledge to make informed decisions. Whether you’re at the early stages of adopting AI or considering integrating it in advanced XML development, this presentation will cover all levels of expertise.
By highlighting the potential advantages and challenges of integrating AI with XML development tools and languages, the presentation seeks to inspire thoughtful conversation around the future of XML development. We’ll not only delve into the technical aspects of AI-powered XML development but also discuss practical implications and possible future directions.
Full-RAG: A modern architecture for hyper-personalizationZilliz
Mike Del Balso, CEO & Co-Founder at Tecton, presents "Full RAG," a novel approach to AI recommendation systems, aiming to push beyond the limitations of traditional models through a deep integration of contextual insights and real-time data, leveraging the Retrieval-Augmented Generation architecture. This talk will outline Full RAG's potential to significantly enhance personalization, address engineering challenges such as data management and model training, and introduce data enrichment with reranking as a key solution. Attendees will gain crucial insights into the importance of hyperpersonalization in AI, the capabilities of Full RAG for advanced personalization, and strategies for managing complex data integrations for deploying cutting-edge AI solutions.
DevOps and Testing slides at DASA ConnectKari Kakkonen
My and Rik Marselis slides at 30.5.2024 DASA Connect conference. We discuss about what is testing, then what is agile testing and finally what is Testing in DevOps. Finally we had lovely workshop with the participants trying to find out different ways to think about quality and testing in different parts of the DevOps infinity loop.
Goodbye Windows 11: Make Way for Nitrux Linux 3.5.0!SOFTTECHHUB
As the digital landscape continually evolves, operating systems play a critical role in shaping user experiences and productivity. The launch of Nitrux Linux 3.5.0 marks a significant milestone, offering a robust alternative to traditional systems such as Windows 11. This article delves into the essence of Nitrux Linux 3.5.0, exploring its unique features, advantages, and how it stands as a compelling choice for both casual users and tech enthusiasts.
Unlocking Productivity: Leveraging the Potential of Copilot in Microsoft 365, a presentation by Christoforos Vlachos, Senior Solutions Manager – Modern Workplace, Uni Systems
20 Comprehensive Checklist of Designing and Developing a WebsitePixlogix Infotech
Dive into the world of Website Designing and Developing with Pixlogix! Looking to create a stunning online presence? Look no further! Our comprehensive checklist covers everything you need to know to craft a website that stands out. From user-friendly design to seamless functionality, we've got you covered. Don't miss out on this invaluable resource! Check out our checklist now at Pixlogix and start your journey towards a captivating online presence today.
6. Scales of Atmospheric Motions
Time and space scale of atmospheric motions
Typical size
Global scale 5000 km
Synoptic scale 2000 km
Mesoscale 20 km
Microscale 2m
Typical life span
6
12. at the center of a surface low, the air converges, and then must rise
H
L
at the center of a surface high, the air diverges, and must come
from aloft due to sinking motion 12
13. Zonal distribution of precipitation:
0oN---low pressure cloudy
30oN---high pressure sunny
45-60oN---low pressure cloudy
Polar latitudes---high pressure clear
13
14. Weather associated with
The Pacific and Bermuda Highs
Pacific High (1) moves northward during
summer produced strong subsidence
inversion on eastern side (2) during
winter, it moves south allowing polar fronts
to bring precipitation to SW US
14
Bermuda High transports
moist, warm subtropical air to US
and southern Canada This air
can be unstable
17. Polar Jet Situated at about 10 km AGL over the polar front (30-70oN)
Subtropical Jet Situated above the subtropical highs at about 13 km AGL(20-50oN)
17
19.
often have troughs and ridges
generally have a maximum (jet streak) in the base of the trough
transport heat pole ward (cold air south and warm air north)
19
20. Jet stream formation
Polar Jet
10
8
200 mb
500 mb
PGF
700 mb
6
5 km
km
4
2
Warm
Cold
0
EQ
45oN
Large temperature
Gradient at surface
20
NP
25. • Coastal divergence results in upwelling as cold
water rises to replace surface water
brings cold water from deep ocean to the
surface
cold, nutrient-rich water rises to replace the
surface water (good for fishing)
26. Walker Circulation
East-west circulations caused by continent and topography
PGF
Typical Walker Circulation
rising air is over the western Pacific, and sinking
air is over the eastern Pacific
26
27. Abnormal Walker Circulation
El Nino year occurs with an abnormal Walker circulation
Circulation during an El Nino
PGF
El Nino refers to eastern movement of
warm water from the western equatorial
Pacific to the eastern equatorial Pacific
27
28. The animation of sea surface temperature (SST)
anomalies to the right shows the unusual warming
that occurred during the 97-98 event.
Note that an anomaly is a departure from some
"normal" value. An anomaly can be either positive
(warm) or negative (cold)
29. El Nino related to the abnormal Walker circulation
Spanish name for a little boy
during certain years, the coastal waters near Peru were
abnormally warm, causing unfavorable fishing conditions. This
would occur during the Christmas period
occur every 3-7 years, lasting about one year
La Nina related to the strong Walker circulation
Spanish name for a little girl
29
31. Sea surface temperature (SST) in a normal year
Low pressure dominates the western Pacific over warm water, and
high pressure dominates the eastern Pacific over cold water.
31
Fig. 7-32, p. 196
32. SST in an El Nino year
during an El Nino year, the SSTs in the eastern Pacific become more warmer
than in a normal year
high pressure shifts from the eastern Pacific to the western Pacific
low pressure shifts from the western Pacific to the eastern Pacific
this shift in surface pressure is called El Nino Southern Oscillation (ENSO)
32
Fig. 7-32, p. 196
33. El Nino can have a dramatic effect on weather around the
world, creates both precipitation and temperature anomalies.
These changes are referred to as the teleconnections
33
36. Oceanic Niño Index (ONI)
• The ONI is based on SST departures from average in the
Niño 3.4 region, and is a principal measure for
monitoring, assessing, and predicting ENSO.
• Defined as the three-month running-mean SST departures
in the Niño 3.4 region. Departures are based on a set of
improved homogeneous historical SST analyses
(Extended Reconstructed SST – ERSST.v3b). The SST
reconstruction methodology is described in Smith et
al., 2008, J. Climate, vol. 21, 2283-2296.)
• NOAA’s operational definitions of El Niño and La Niña are
keyed to the ONI index.
37. NOAA Operational Definitions for
El Niño and La Niña
El Niño: characterized by a positive ONI greater than or
equal to +0.5 C.
La Niña: characterized by a negative ONI less than or
equal to -0.5 C.
By historical standards, to be classified as a full-fledged
El Niño or La Niña episode, these thresholds must be
exceeded for a period of at least 5 consecutive
overlapping 3-month seasons.
CPC considers El Niño or La Niña conditions to occur when the
monthly Niño3.4 OISST departures meet or exceed +/- 0.5°C along
with consistent atmospheric features. These anomalies must also
be forecasted to persist for 3 consecutive months.
38. ONI (oC): Evolution since 1950
The most recent
ONI value (August
– October 2011) is
-0.4oC.
El Niño
neutral
La Niña