Downloaded 117 times


![• Reject
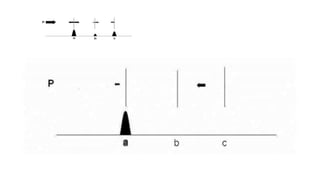
The reject control is an adjustable control that eliminates low-
level interference caused by refracted aberrant ultrasound and
electronic "noize". Care must be taken not to eliminate low-
intensity echoes from fresh intracardiac thrombi by setting the
reject threshold too high. [24]](https://image.slidesharecdn.com/echophysicsandinstrumentation-160725162918/85/Echo-physics-and-instrumentation-66-320.jpg)


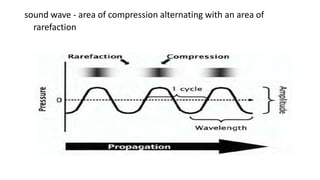
This document discusses key concepts regarding ultrasound physics and instrumentation relevant to echocardiography. It covers topics such as sound wave properties, factors that influence ultrasound velocity, reflection and attenuation, transducer characteristics related to resolution, and optimization of 2D, Doppler, and TEE imaging. The key points are that ultrasound is used to image cardiac structures, transducer properties like frequency affect image quality, and proper adjustment of controls optimizes the ultrasound information obtained.


