Downloaded 1,004 times

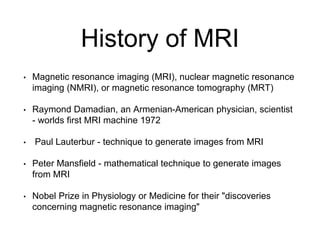
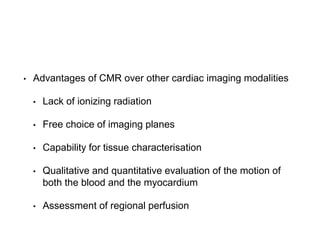
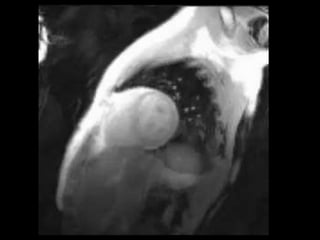

Cardiac MRI provides concise summaries of medical documents in 3 sentences or less: Cardiac MRI has a history dating back to the 1970s when the first MRI machine was developed and techniques for generating images were discovered, leading to the Nobel Prize. MRI uses magnetic fields and radio waves to generate detailed images of the heart and blood vessels without using ionizing radiation. Cardiac MRI is now used clinically to assess cardiac structure and function, detect ischemia and scar tissue, and evaluate various cardiomyopathies.


![CARDIOVASCULAR SYSTEM new [Autosaved].pptx](https://cdn.slidesharecdn.com/ss_thumbnails/cardiovascularsystemnewautosaved-240711150130-2b5a8369-thumbnail.jpg?width=640&height=640&fit=bounds)


![PERI-PROSTHETIC FRACTURE NAIL-PLATE CONSTRUCT [NPC].pptx](https://cdn.slidesharecdn.com/ss_thumbnails/drarunkumardrmohamedashrafperiprostheticfrasturenail-plateconstructnpc-260209164459-7e9d15a1-thumbnail.jpg?width=640&height=640&fit=bounds)
