The document covers the fundamentals of echocardiography and Doppler echocardiography, focusing on ultrasound principles, imaging modalities, and techniques used for cardiac evaluation. It discusses key concepts such as frequency, wavelength, resolution, and different imaging approaches including 2D and M-mode echocardiography. Additionally, it explains Doppler principles for measuring blood flow, spectral analysis, and various Doppler methods employed in cardiac assessments.
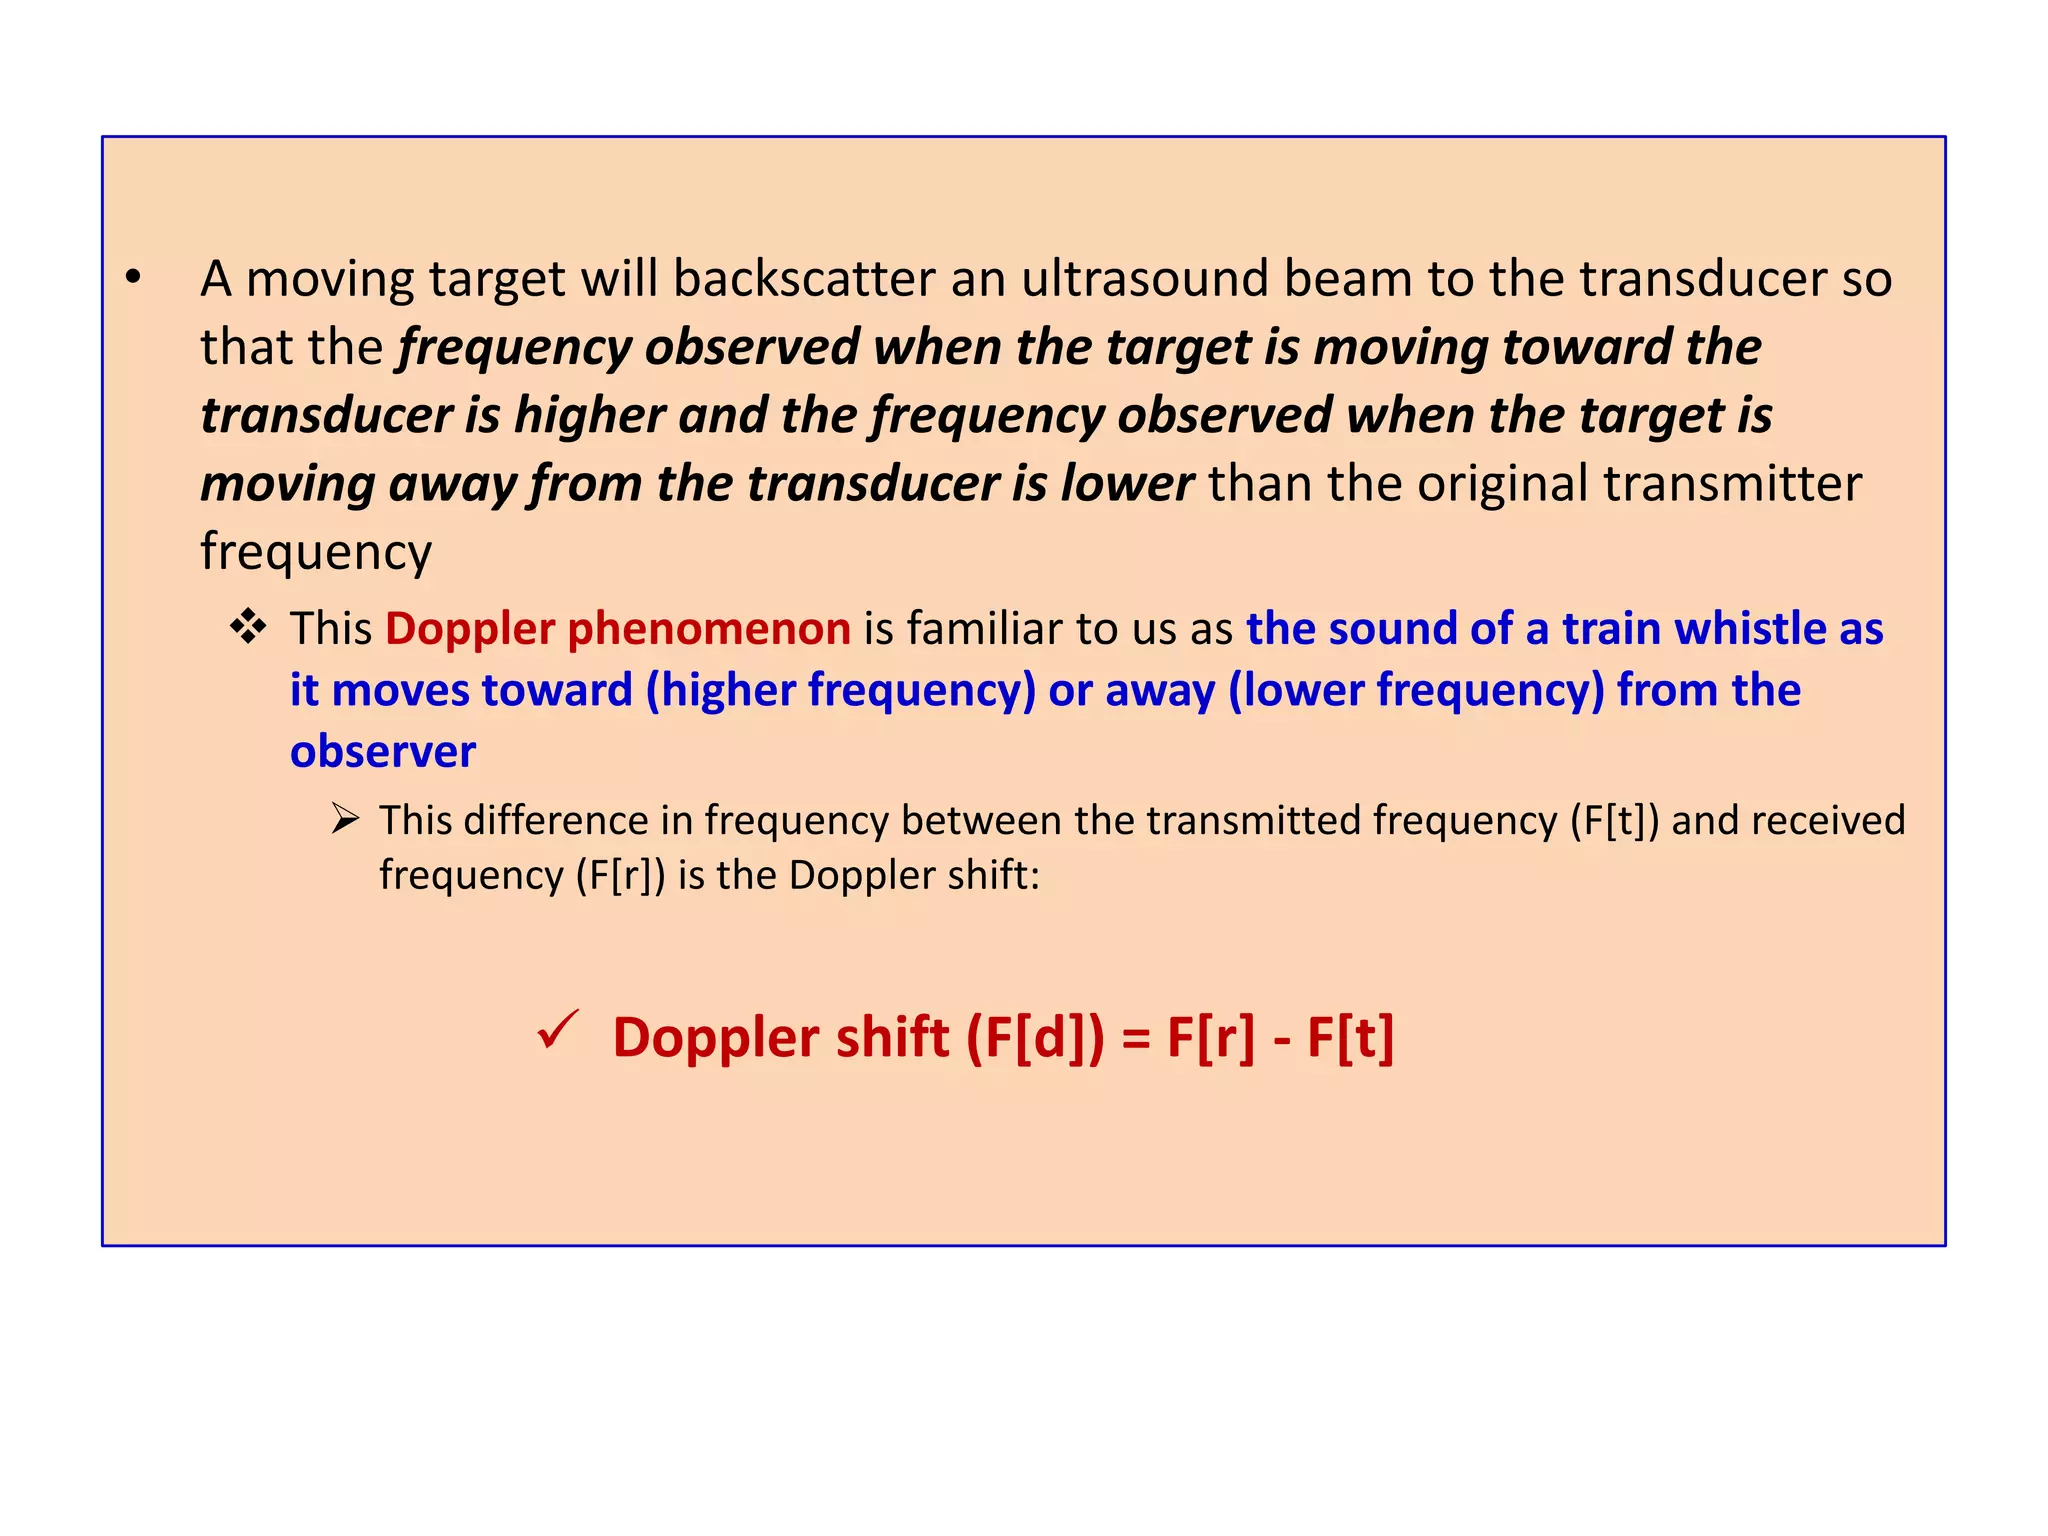
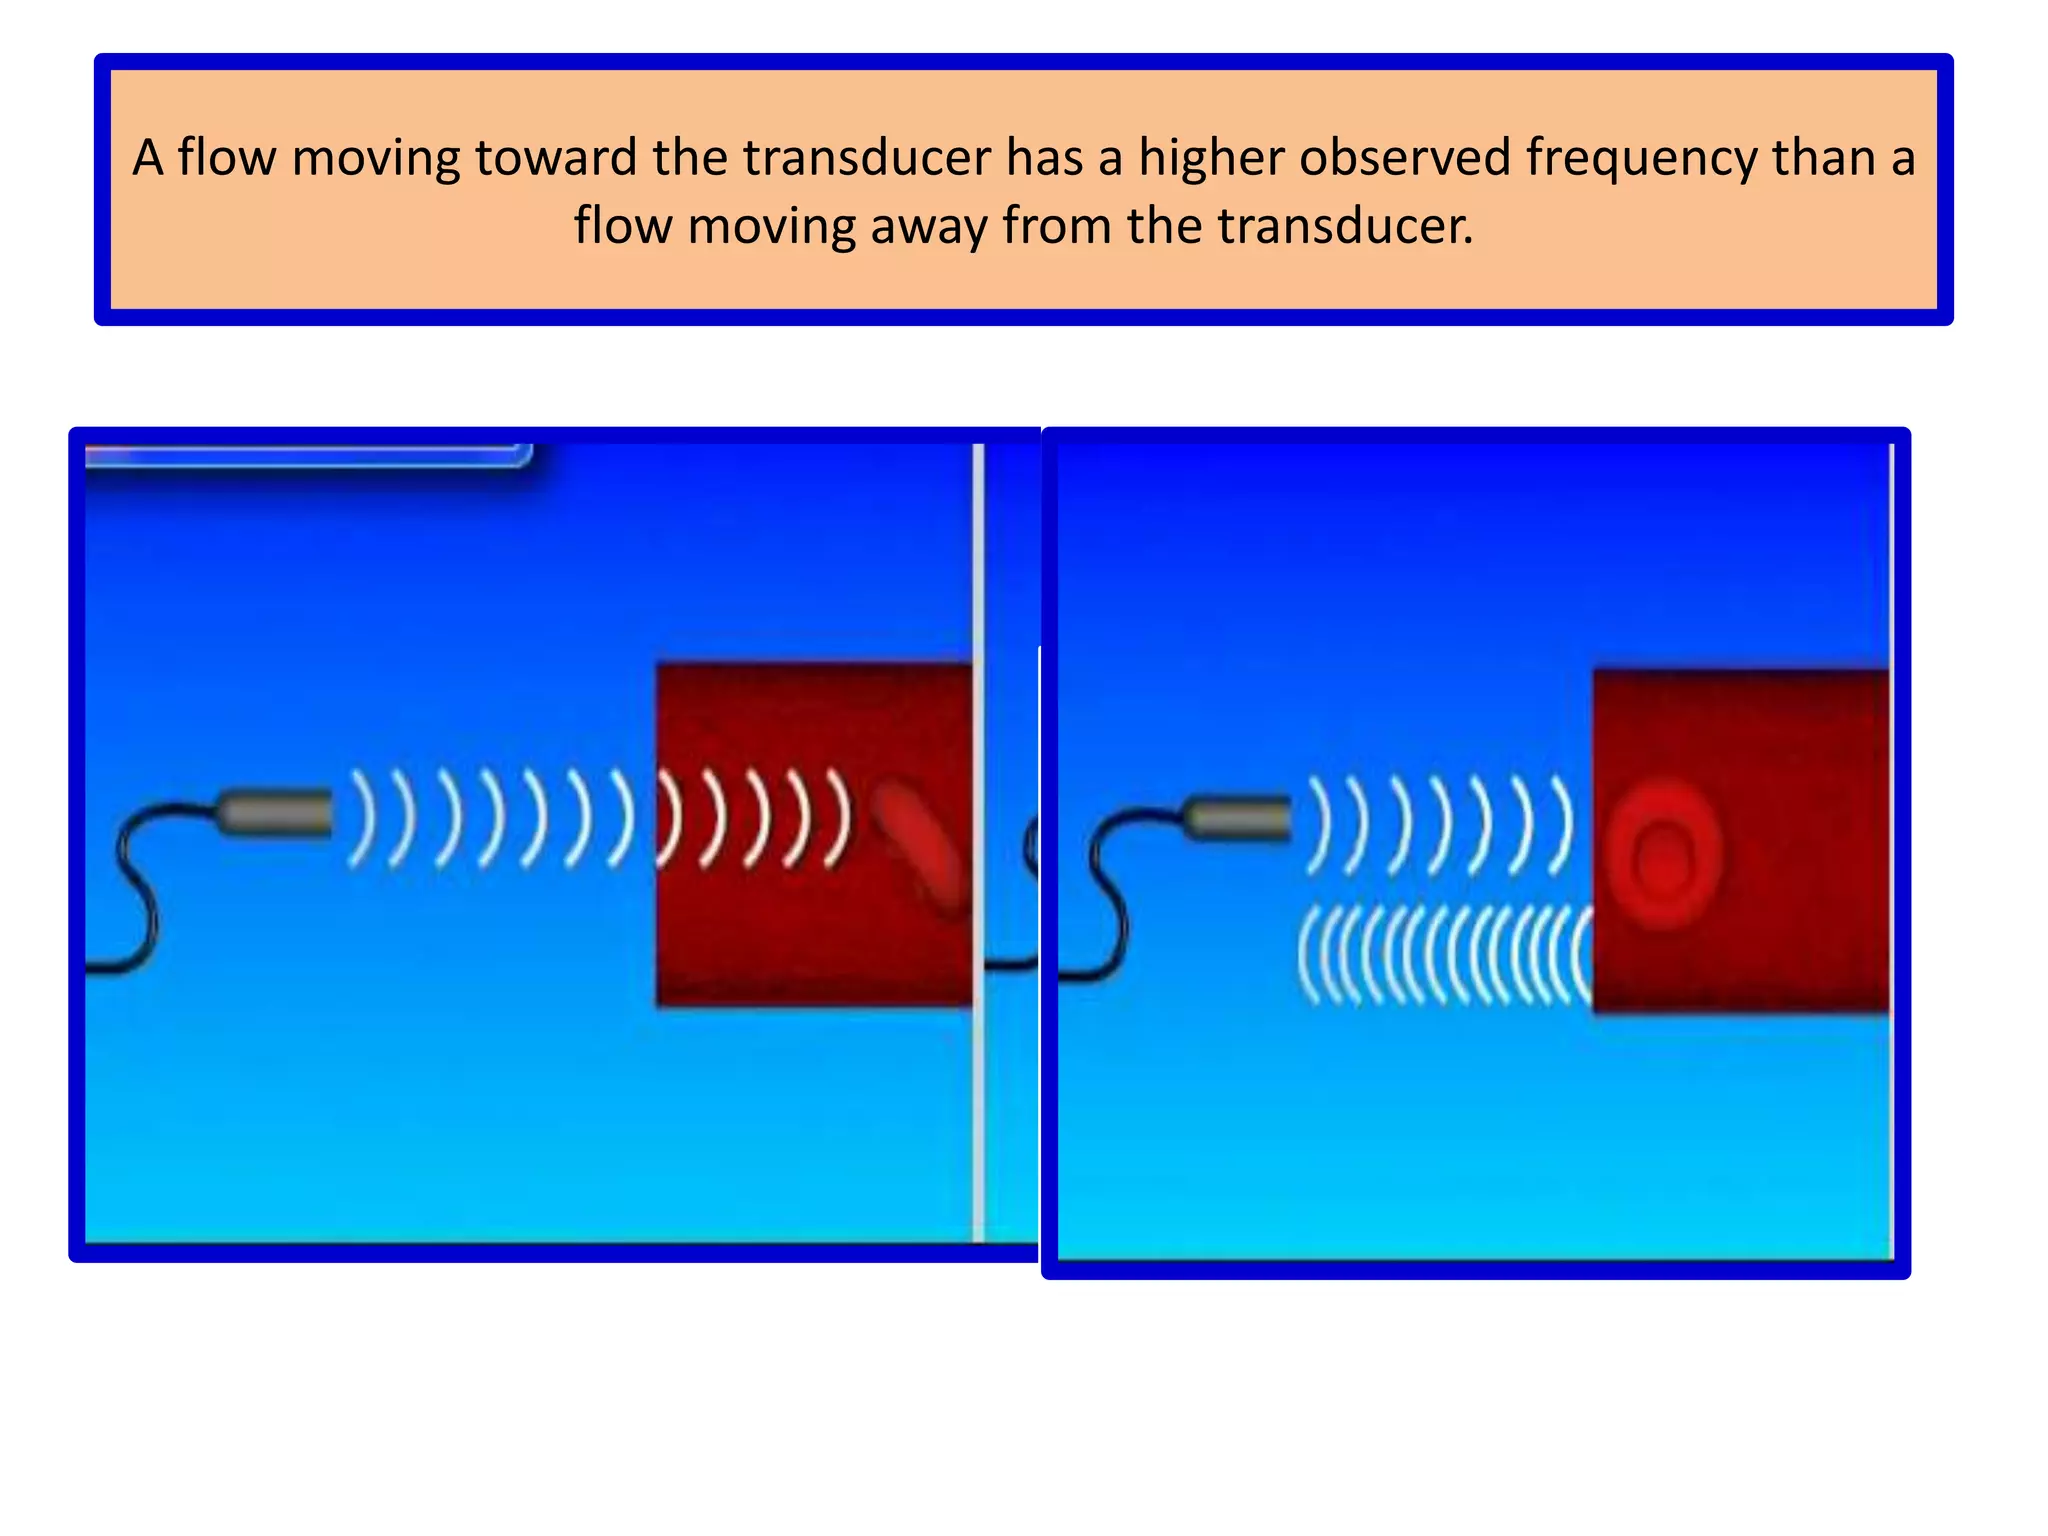
![This difference in frequency between the transmitted frequency (F[t]) and received frequency (F[r]) is the Doppler shift:](https://image.slidesharecdn.com/basicsofechoprinciplesofdopplerechocardiography-110611084807-phpapp02/75/Basics-of-echo-principles-of-doppler-echocardiography-55-2048.jpg)
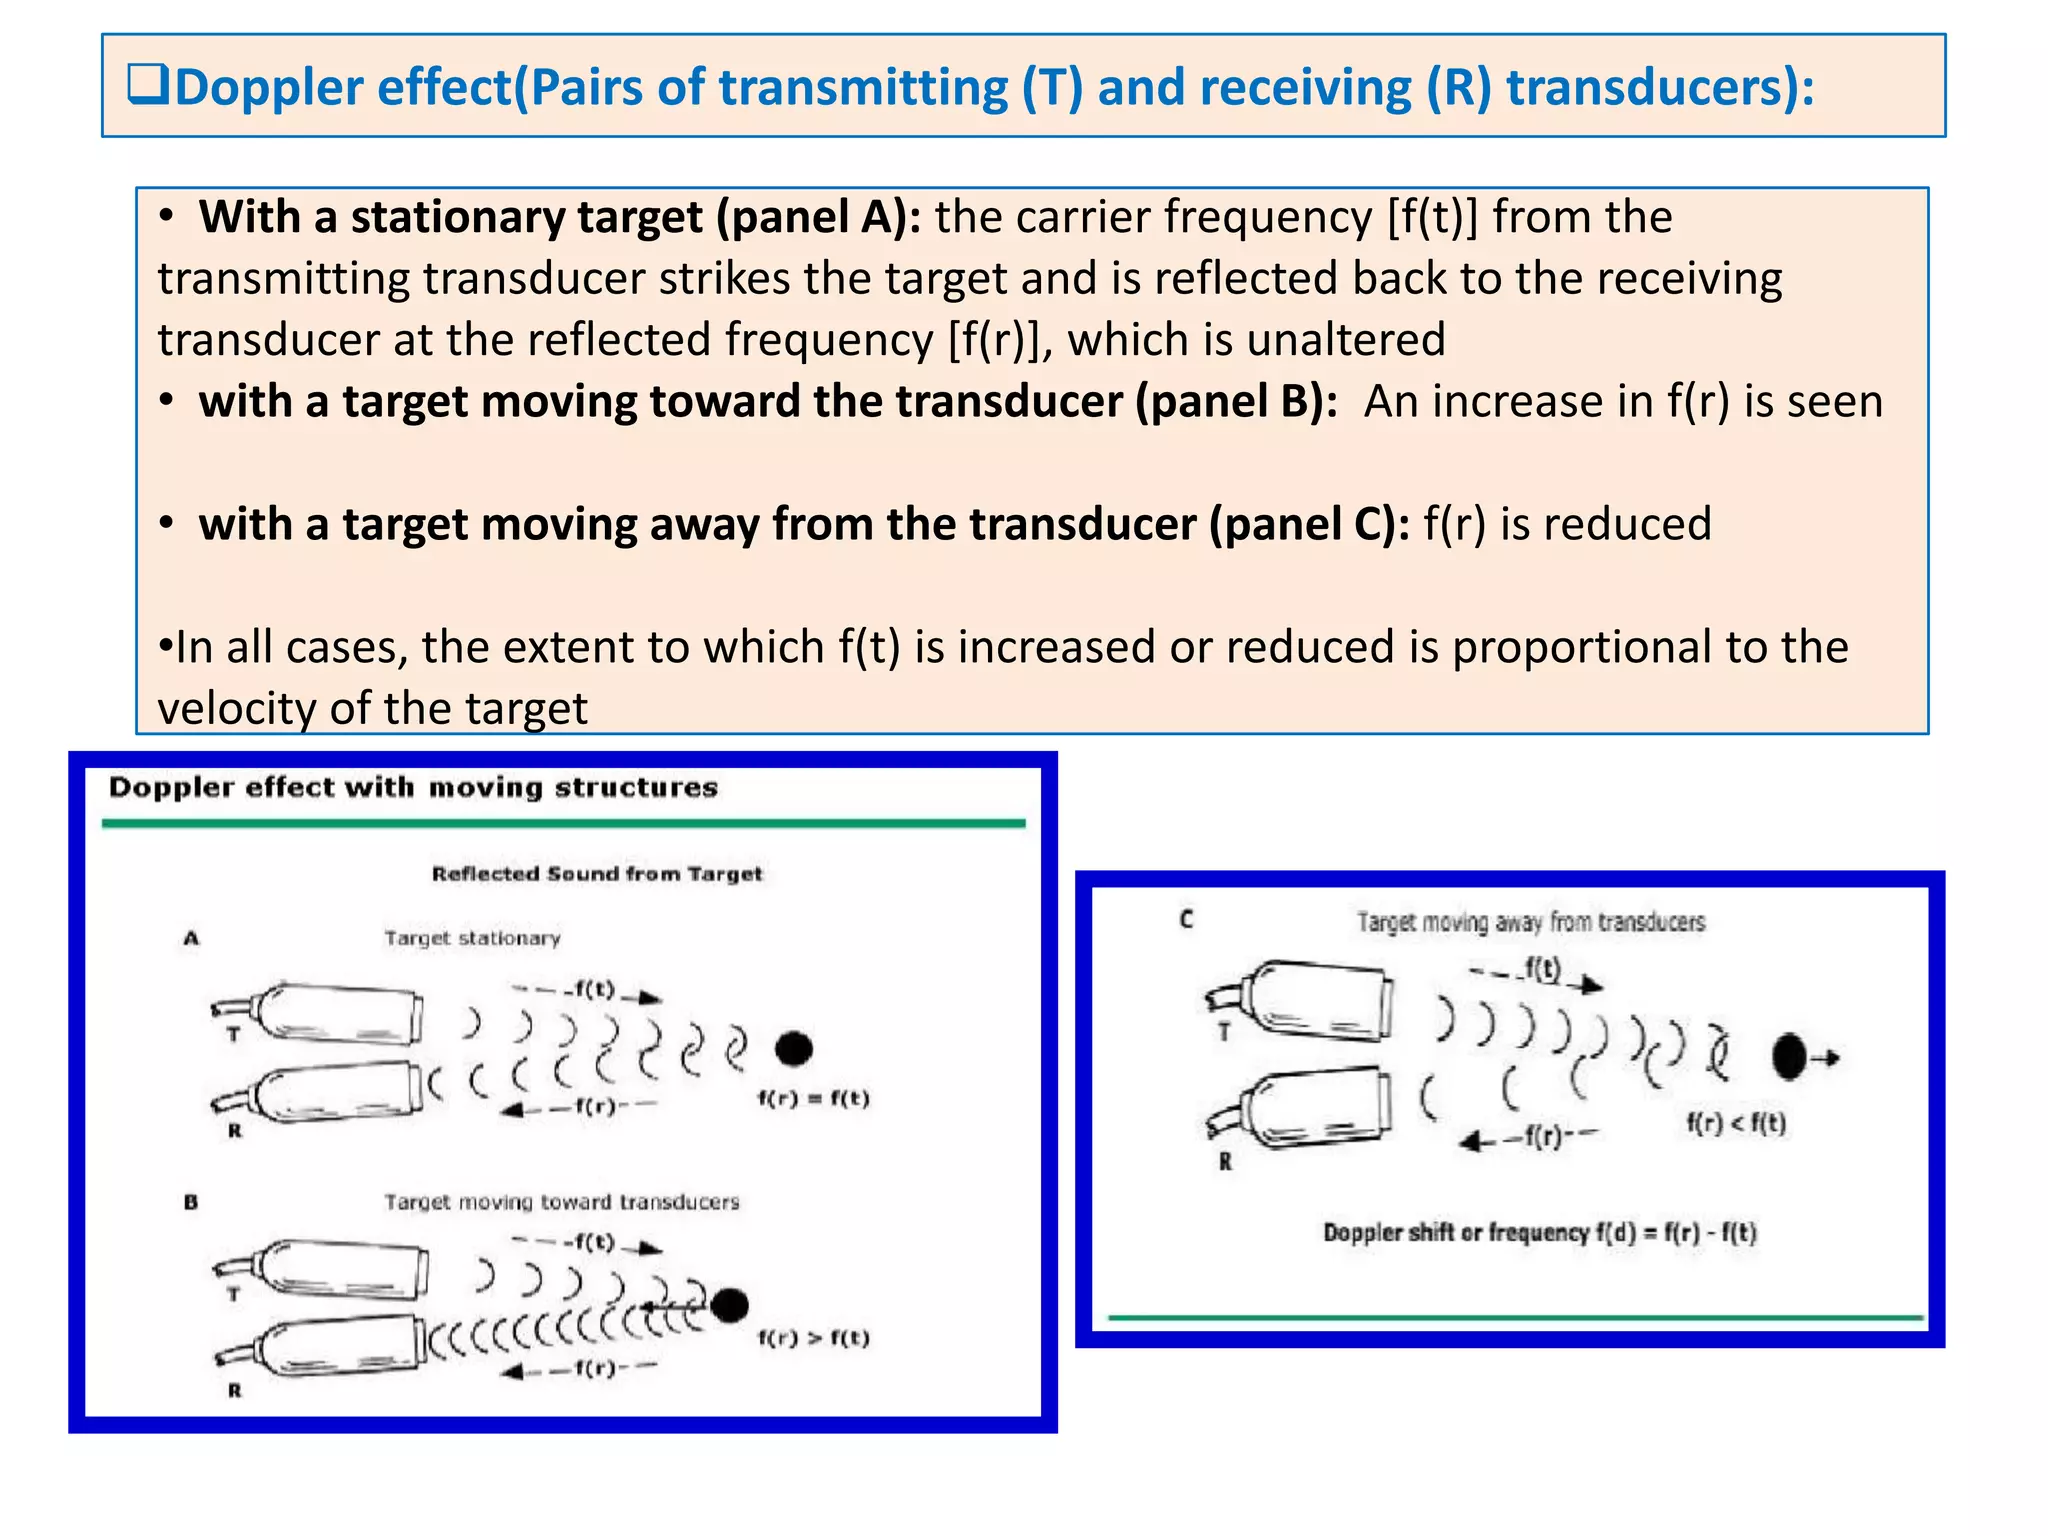
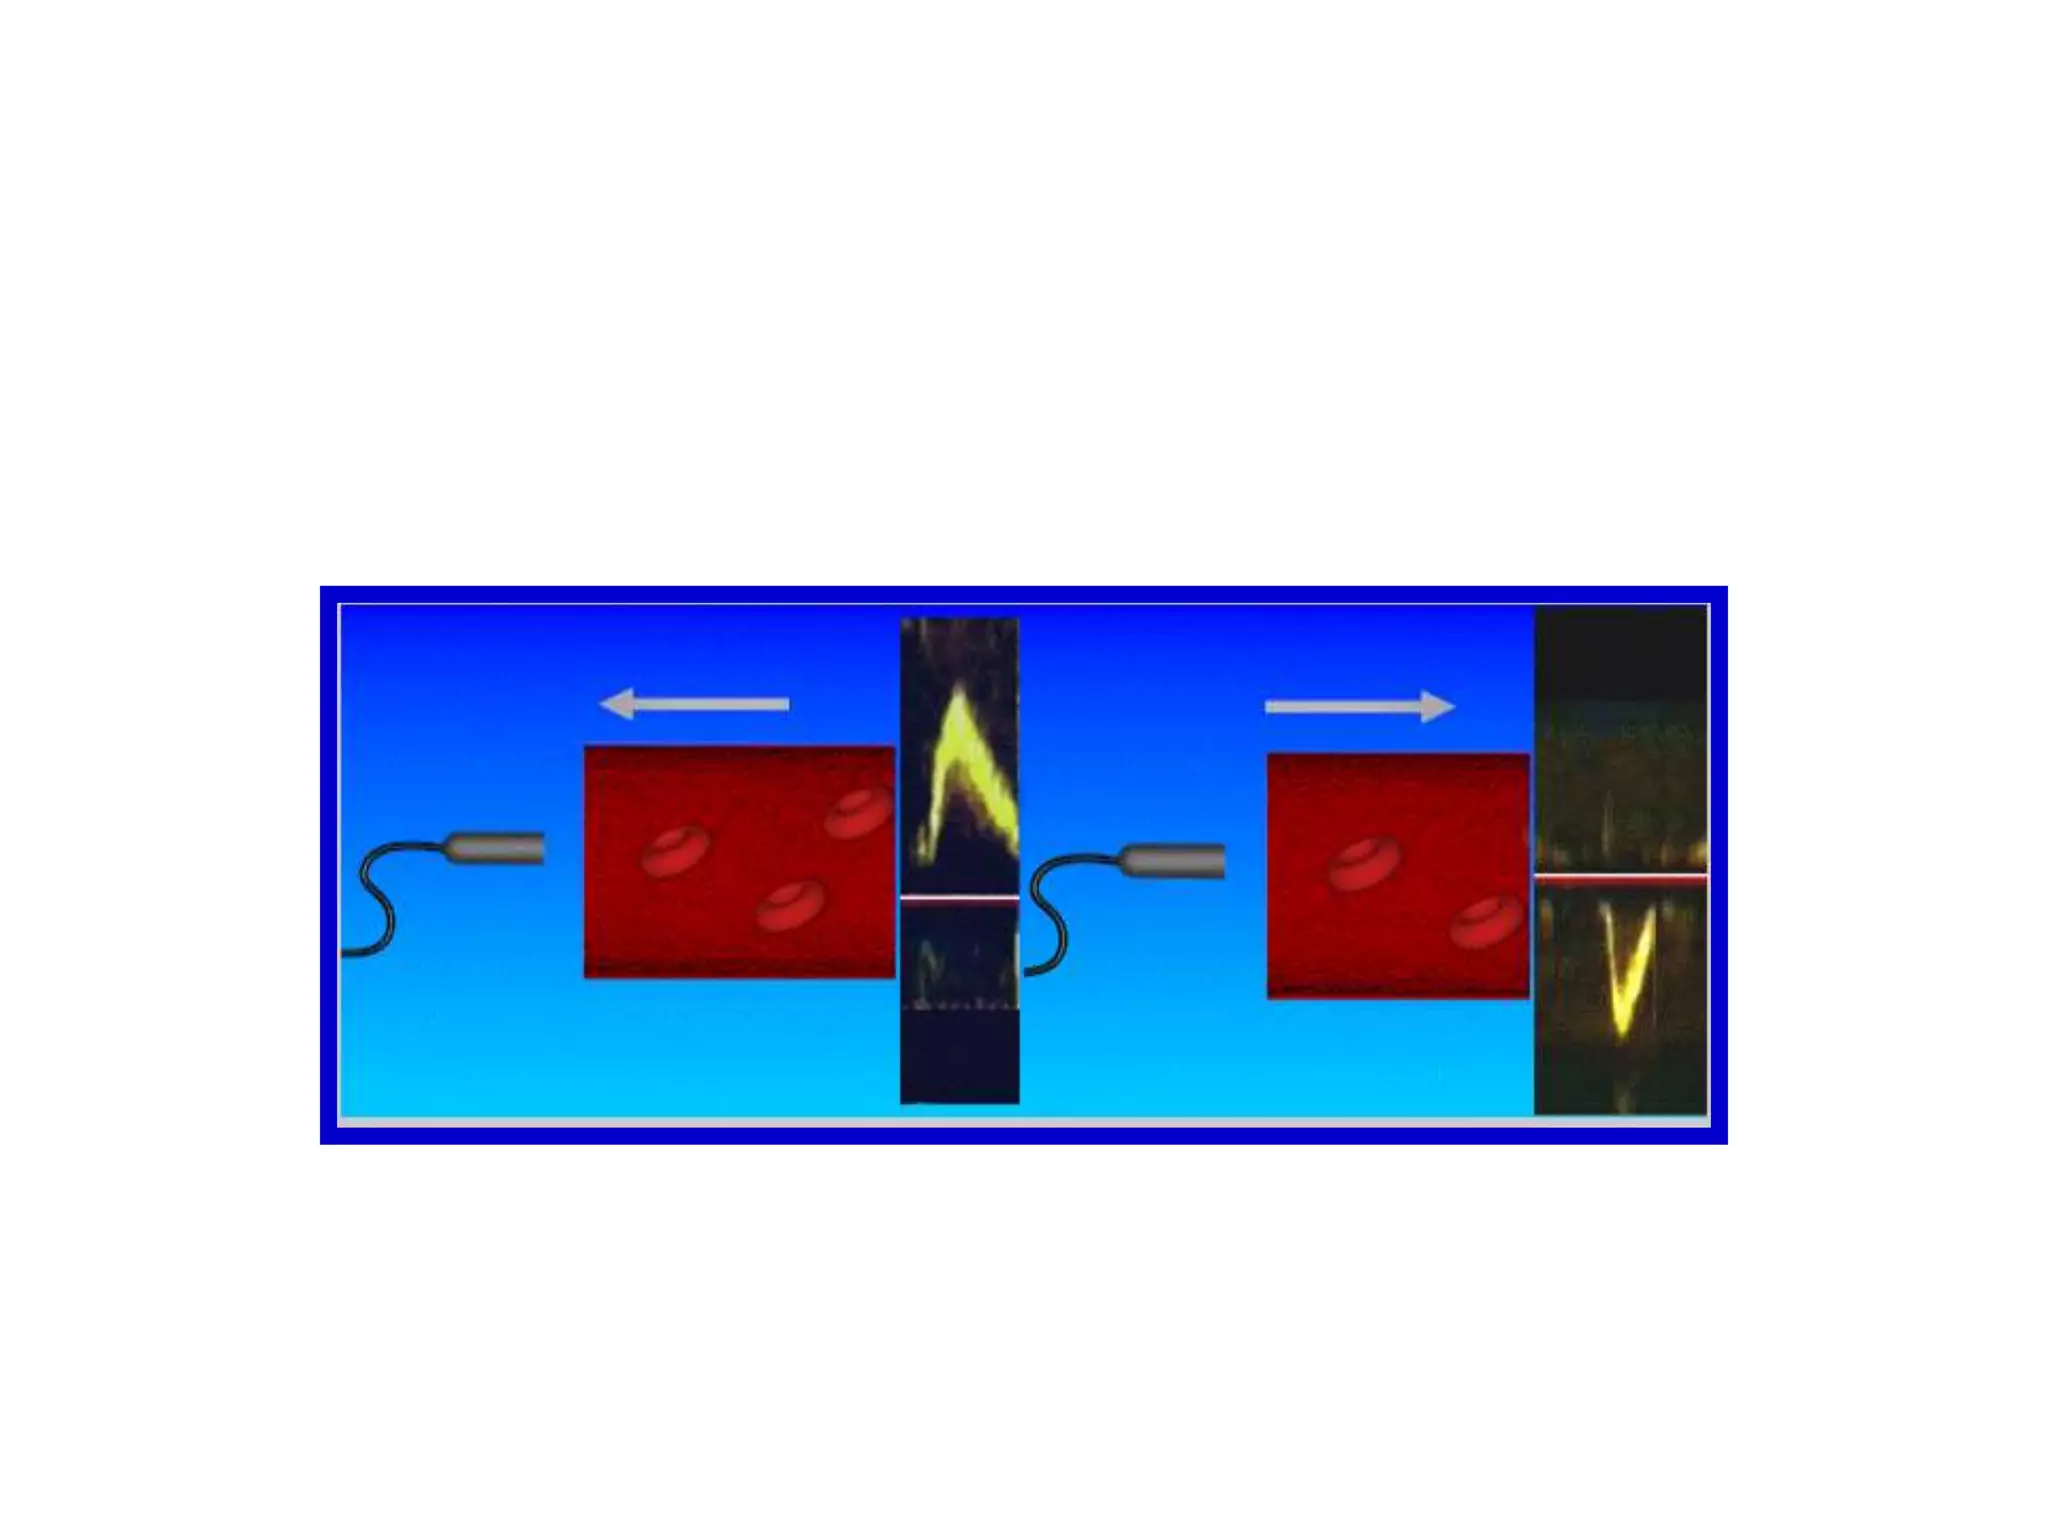
![Doppler shift (F[d]) = F[r] - F[t]Doppler effect(Pairs of transmitting (T) and receiving (R) transducers):](https://image.slidesharecdn.com/basicsofechoprinciplesofdopplerechocardiography-110611084807-phpapp02/75/Basics-of-echo-principles-of-doppler-echocardiography-56-2048.jpg)
![With a stationary target (panel A): the carrier frequency [f(t)] from the transmitting transducer strikes the target and is reflected back to the receiving transducer at the reflected frequency [f(r)], which is unaltered](https://image.slidesharecdn.com/basicsofechoprinciplesofdopplerechocardiography-110611084807-phpapp02/75/Basics-of-echo-principles-of-doppler-echocardiography-57-2048.jpg)
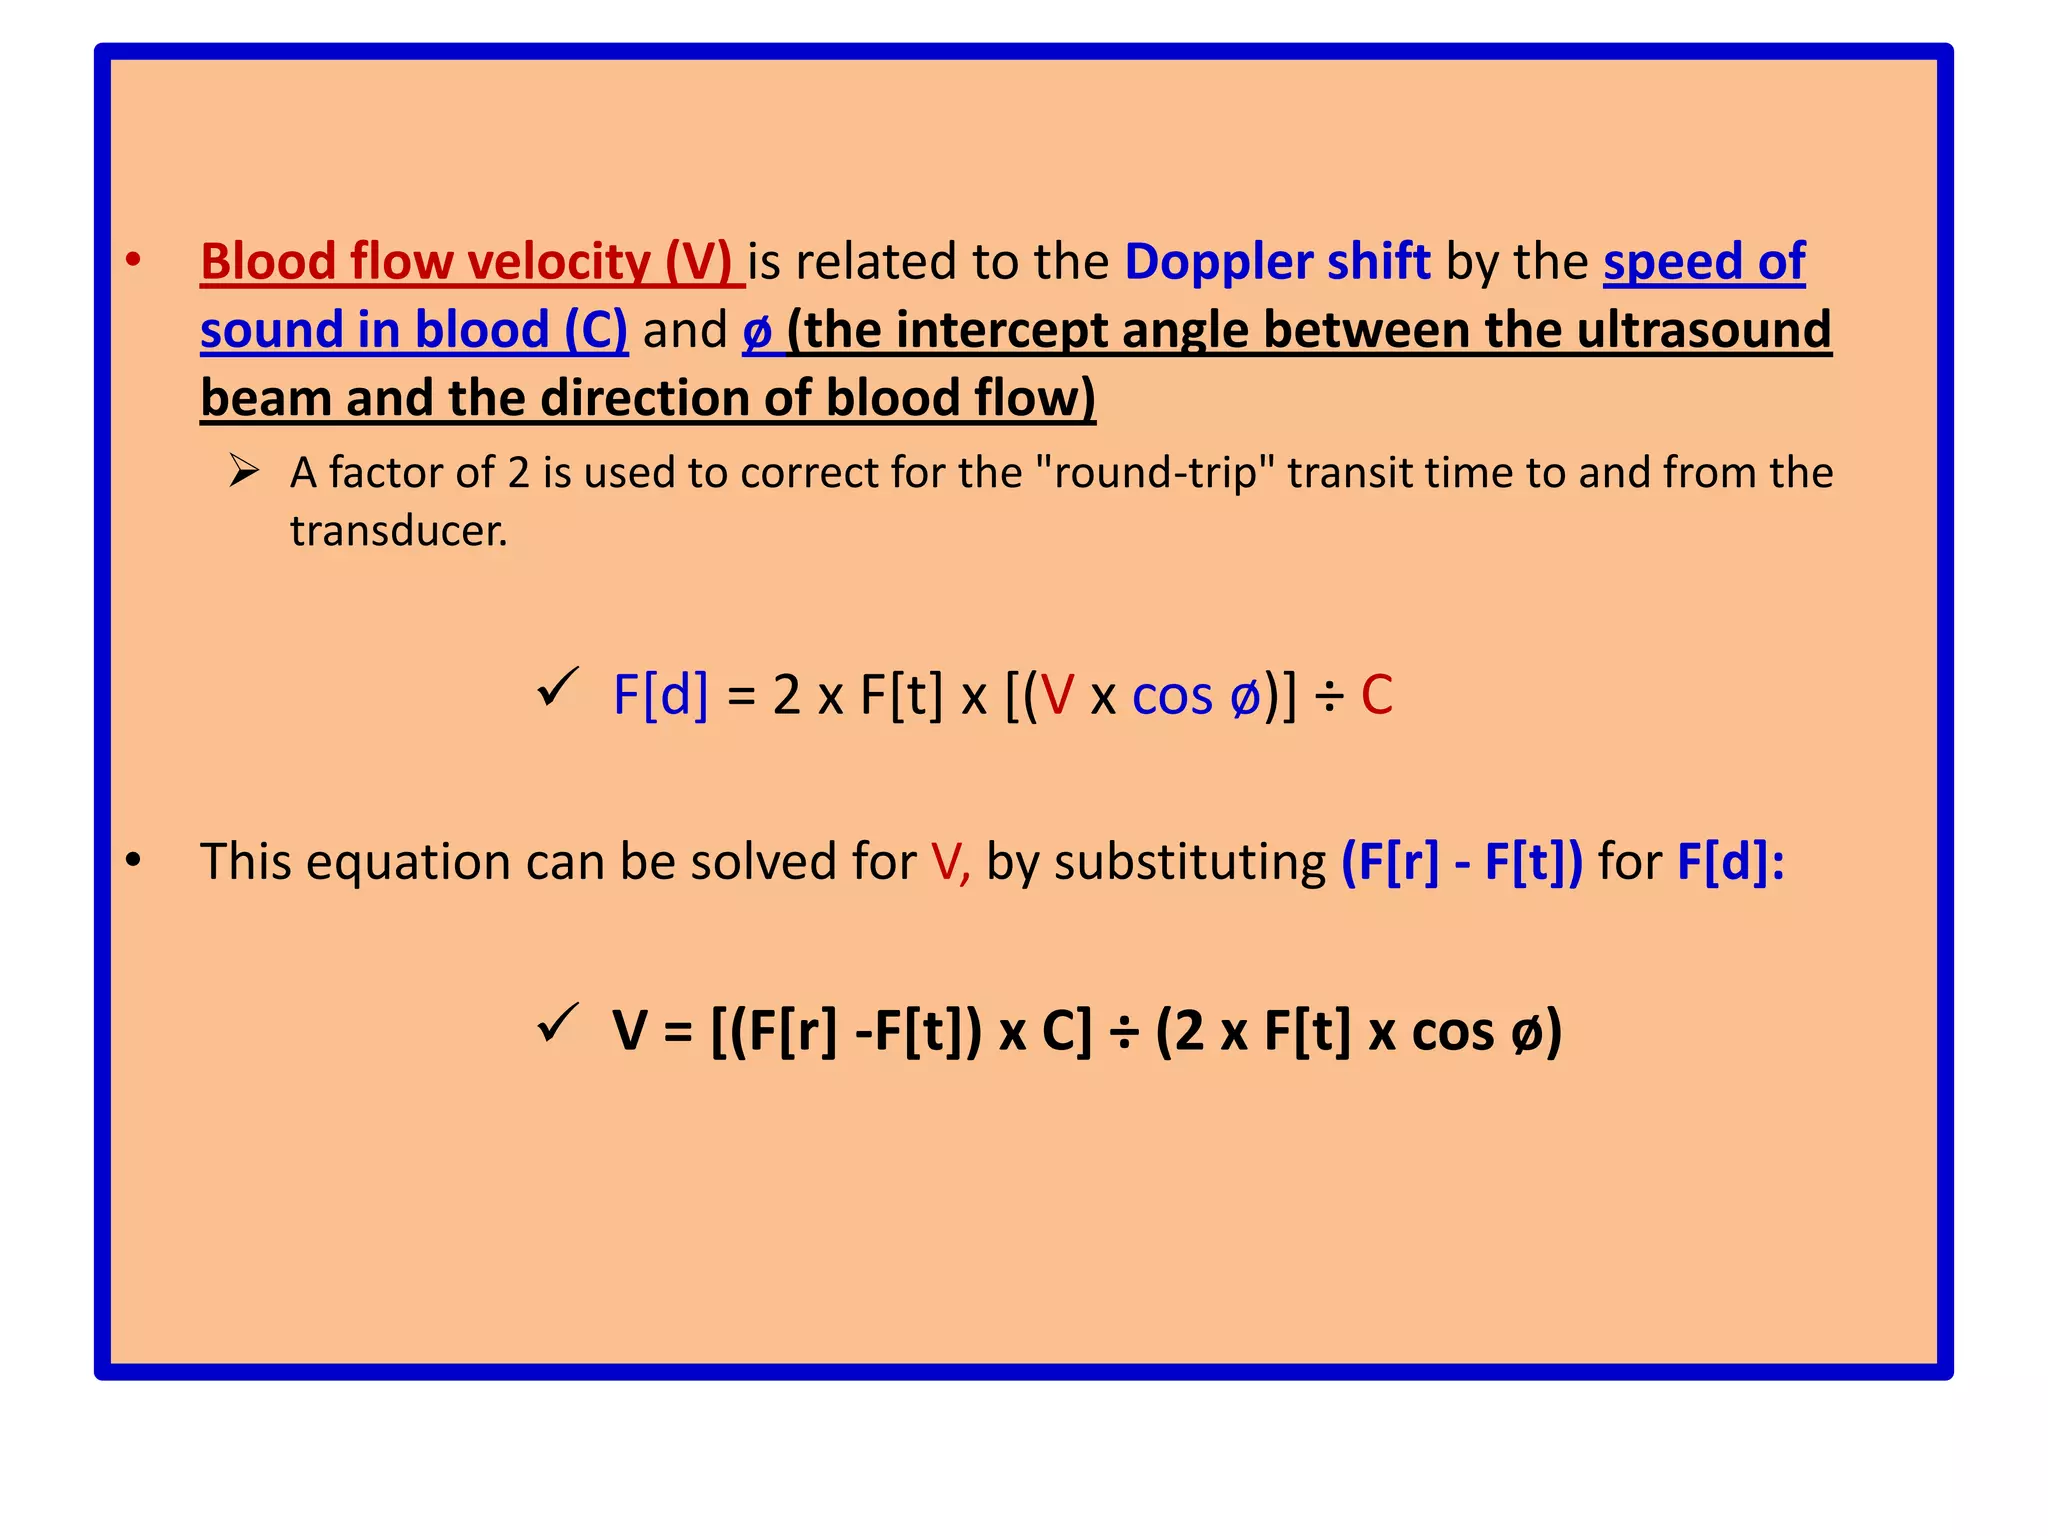
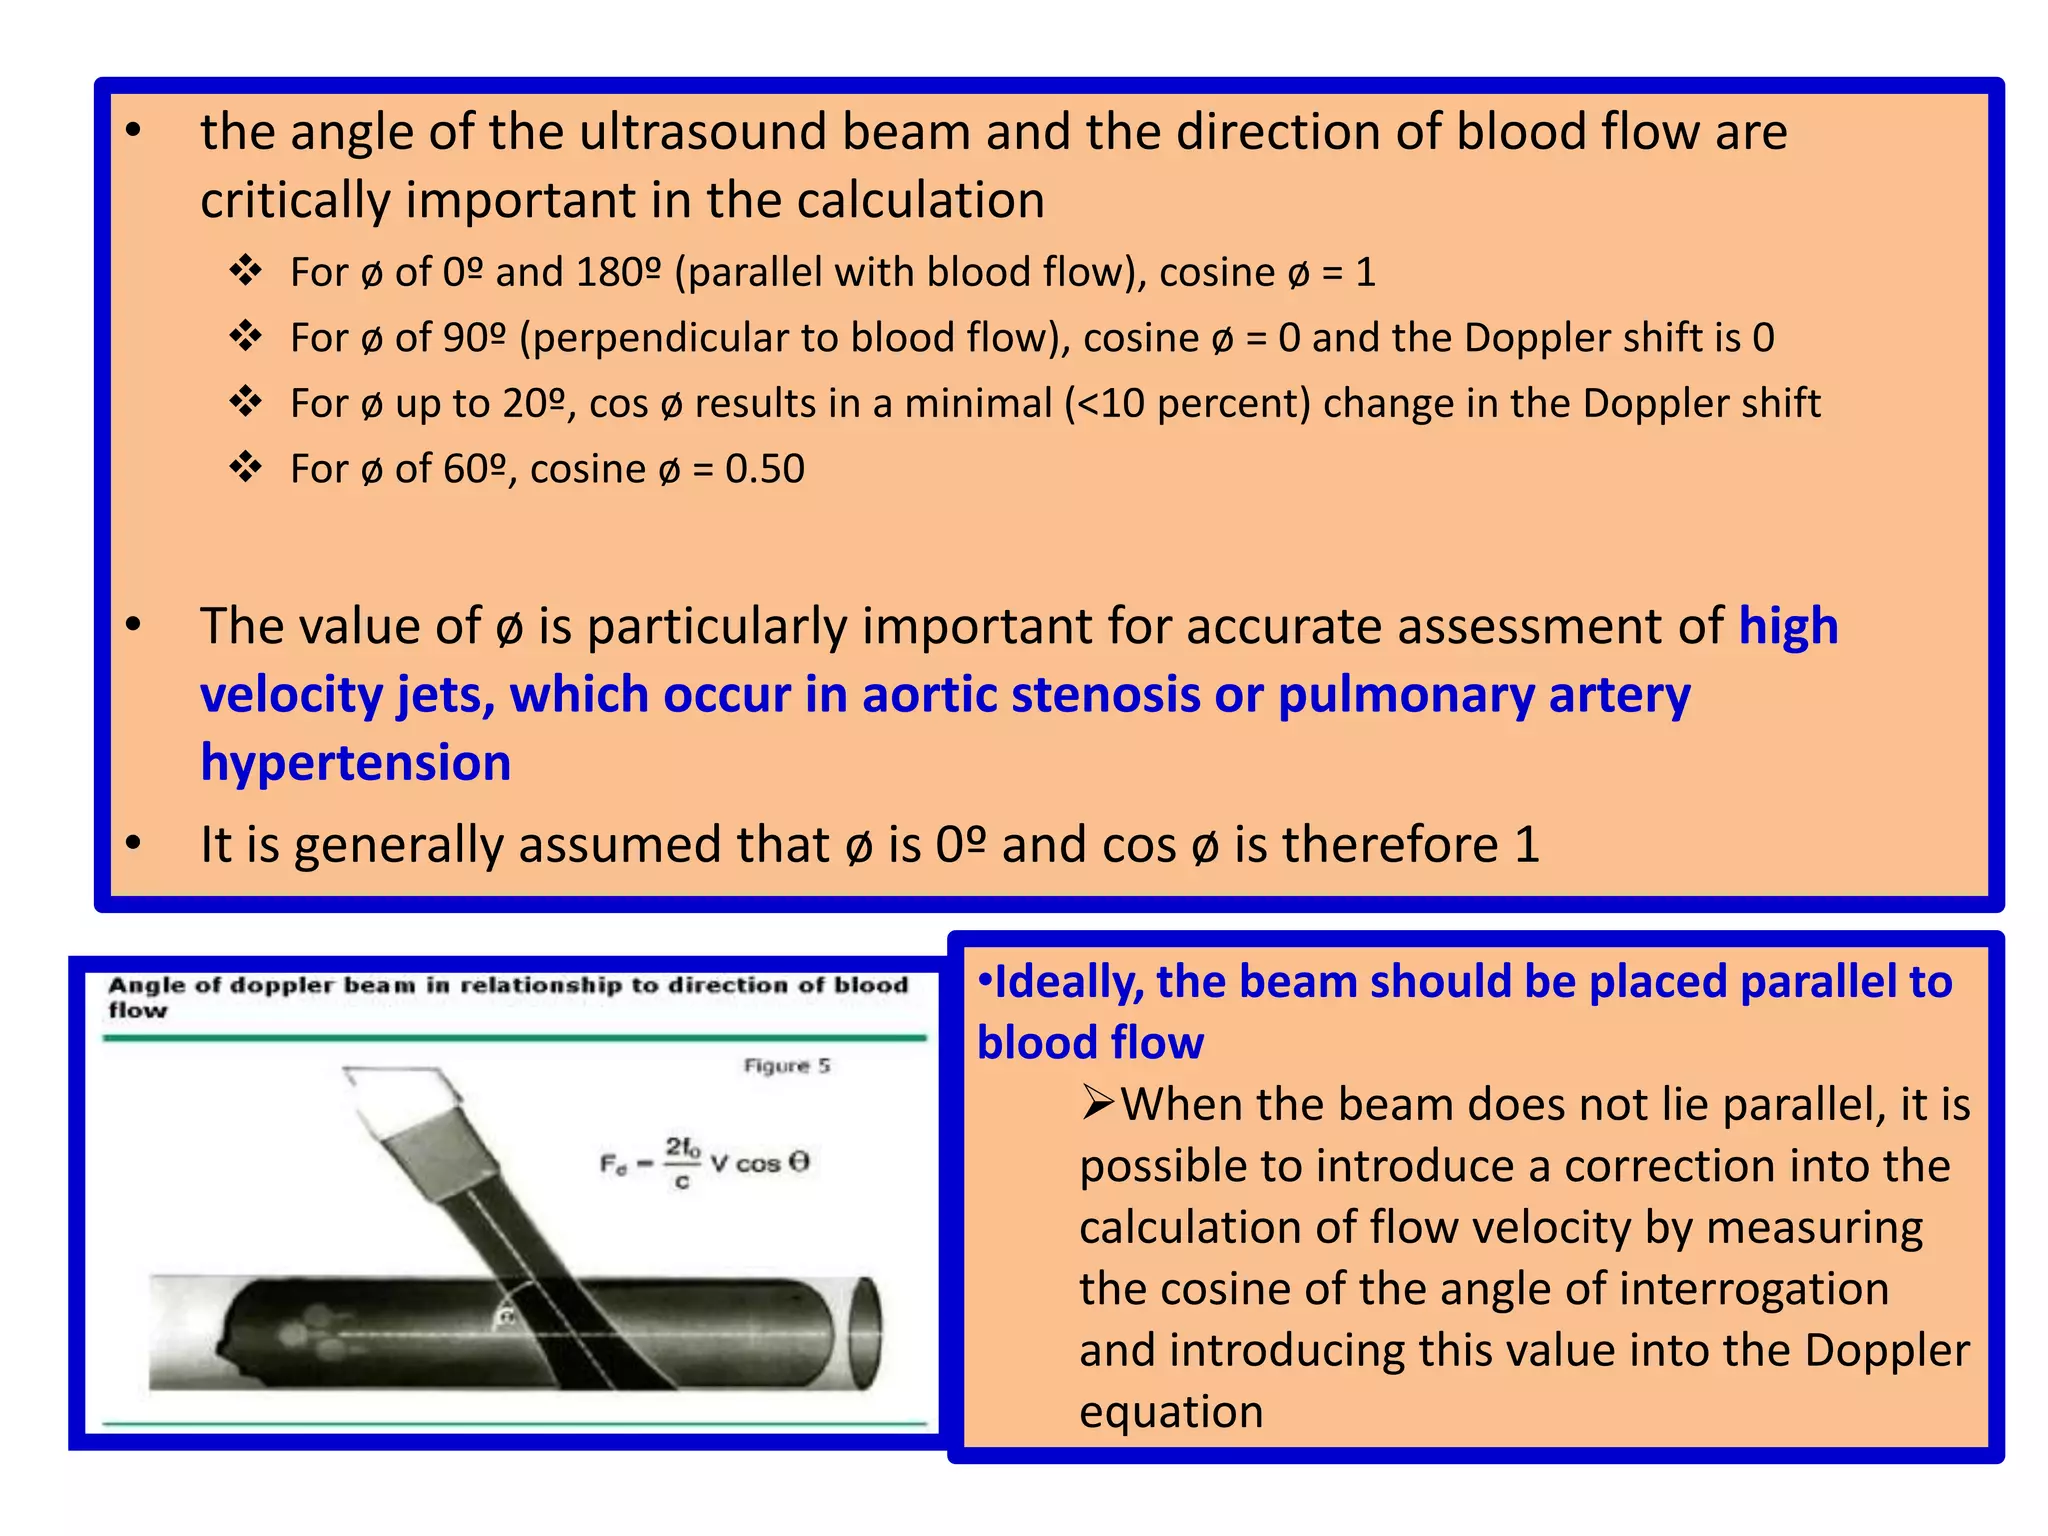
![F[d] = 2 x F[t] x [(Vx cos ø)] ÷ CThis equation can be solved for V, by substituting (F[r] - F[t]) for F[d]: V = [(F[r] -F[t]) x C] ÷ (2 x F[t] x cos ø)the angle of the ultrasound beam and the direction of blood flow are critically important in the calculationFor ø of 0º and 180º (parallel with blood flow), cosine ø = 1](https://image.slidesharecdn.com/basicsofechoprinciplesofdopplerechocardiography-110611084807-phpapp02/75/Basics-of-echo-principles-of-doppler-echocardiography-62-2048.jpg)