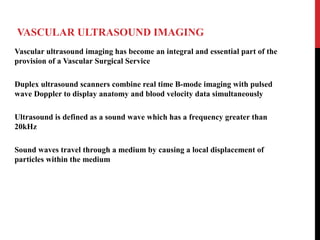
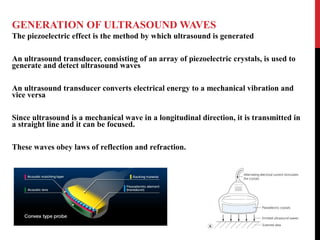
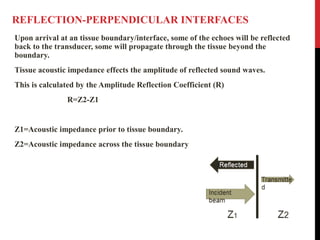
2. VASCULAR ULTRASOUND IMAGING
Vascular ultrasound imaging has become an integral and essential part of the
provision of a Vascular Surgical Service
Duplex ultrasound scanners combine real time B-mode imaging with pulsed
wave Doppler to display anatomy and blood velocity data simultaneously
Ultrasound is defined as a sound wave which has a frequency greater than
20kHz
Sound waves travel through a medium by causing a local displacement of
particles within the medium
4. GENERATION OF ULTRASOUND WAVES
The piezoelectric effect is the method by which ultrasound is generated
An ultrasound transducer, consisting of an array of piezoelectric crystals, is used to
generate and detect ultrasound waves
An ultrasound transducer converts electrical energy to a mechanical vibration and
vice versa
Since ultrasound is a mechanical wave in a longitudinal direction, it is transmitted in
a straight line and it can be focused.
These waves obey laws of reflection and refraction.
5. Since small objects in the human body will reflect ultrasound, it is possible to collect the
reflected data and compose a picture of these objects to further characterize them.
Major drawback of ultrasound is the fact that it cannot be transmitted through a gaseous
medium (like air or lung tissue).
As ultrasound transverses tissue, its energy decreases.
This is called attenuation and is more pronounced in tissue with less density (like lung).
There are seven parameters that describe ultrasound waves.
ā¢ Period
ā¢ Amplitude
ā¢ Power
ā¢ Wavelength
ā¢ Propagation of Speed
ā¢ Pulse Repetition Frequency
6. Period
Period of an ultrasound wave is the time that is required to capture one cycle, i.e., the
time from the beginning of one cycle till the beginning of the next cycle.
Period of ultrasound is determined by the source and cannot be changed by the
sonographer.
Frequency is the inverse of the period and is defined by a number of events that
occur per unit time.
The units of frequency is 1/sec or Hertz (Hz).
Since f = 1/P, it is also determined by the source and cannot be changed.
7. Amplitude
Amplitude is an important parameter and is concerned with the strength of the
ultrasound beam.
It is defined as the difference between the peak value and the average value of the
waveform.
It is expressed in decibels or dB, which is a logarithmic scale.
It can be changed by a sonographer.
Amplitude decreases as the ultrasound moves through tissue, this is called
attenuation.
Amplitude decreases usually by 1 dB per 1 MHz per 1 centimeter traveled.
8. Power
Power of ultrasound is defined as the rate of energy transfer and is measured in
Watts.
It is determined by the sound source and it decreases as the beam propagated
through the body.
Intensity of the ultrasound beam is defined as the concentration of energy in the
beam.
Intensity = Power / beam area = amplitude2
/ beam area, thus it is measured in Watts
per cm2
.
It is the key variable in ultrasound safety. Intensity also decreases as the ultrasound
propagates through tissue.
9. Wavelength
Wavelength is defined as the length of a single cycle.
It is measured in the units of length.
It is determined by both the source and the medium.
Wavelength cannot be changed by the sonographer.
It influences the longitudinal image resolution and thus effect image quality.
Typical values of wavelength are 0.1 ā 0.8 mm.
Wavelength (mm) = Propagation speed in tissue (mm/microsecond) / frequency (MHz).
High frequency means short wavelength and vice versa.
10. Propagation of Speed
Propagation speed in human soft tissue is on average 1540 m/s.
It is defines as to how fast the ultrasound can travel through that tissue.
It is determined by the medium only and is related to the density and the stiffness of
the tissue in question.
Density of the medium is related to its weight and the stiffness of the medium is
related to its āsquishabilityā.
As the medium becomes more dense, the slower is speed of ultrasound in that
medium (inverse relationship).
The stiffer the tissue, the faster will the ultrasound travel in that medium.
11. PULSE REPETITION FREQUENCY & TIME
For imaging purposes, a transducer is required to generate short pulses of ultrasound
rather than continuous waves
This is achieved by applying very short voltage pulses across the transducer
The pulse repetition frequency is the number of pulses transmitted per unit time (Hz)
PRF is the number of pulses that occur in 1 second.
PRF can be altered by changing the depth of imaging.
It is measured in Hertz (Hz). PRF = 77,000 / depth of view (cm).
As evident from the equation, as the location of the target gets further away, the PRF
decreases. PRF is related to frame rate or sampling rate of the ultrasound.
12. INTERACTION OF ULTRASOUND WAVES
ā¢The energy of ultrasound decreases (attenuation) as it travels through tissue.
ā¢The stronger the initial intensity or amplitude of the beam, the faster it attenuates.
ā¢Attenuation of ultrasound in soft tissue depends on the initial frequency of the ultrasound and
the distance it has to travel.
ā¢As we saw in the example above, in soft tissue the greater the frequency the higher is the
attenuation.
ā¢So we can image deeper with lower frequency transducer.
ā¢The further into the tissue the ultrasound travels, the higher
the attenuation is, so it is ultimately the limiting factor as
to how deep we can image clinically relevant structures
ā¢Creation of an ultrasound image depends on the way in
which an ultrasound wave interacts with tissue as it passes through the body
ā Reflection
ā Refraction
ā Scattering
ā Attenuation
13. IMAGE RESOLUTION
Axial Resoluion
āThe ability to distinguish and display the minimum reflector spacing along the
axis of the ultrasound waveā.
Axial resolution is determined by the Pulse duration (the time is takes for a single
pulse to occur).
PD=No of cycles in a pulse/frequency.
Therefore, by increasing the transducer frequency (and decreasing wavelength)
better image resolution is achieved.
14. Lateral Resolution
Lateral resolution is the minimum distance that can be imaged between two objects
that are located side to side or perpendicular to the beam axis.
Again, the smaller the number the more accurate is the image.
Since the beam diameter varies with depth, the lateral resolution will vary with
depth as well.
The lateral resolution is best at the beam focus (near zone length).
Lateral resolution is usually worse than axial resolution
because the pulse length is usually smaller compared to
the pulse width.
15. PROPAGATION OF ULTRASOUND
Acoustic Impedance and Reflection
ā¢ Perpendicular Interface
ā¢ Non-Perpendicular Interface
Refraction
Scattering
Attenuation
Absorption
16. ACOUSTIC IMPEDANCE
Interfaces with a large miss-match of acoustic impedance reflect more of the
incident beam than those of similar qualities.
For example, at the muscle-air interface in the lungs, the majority of the incident
beam is reflected back to the transducer.
This is why ultrasound is not a good imaging modality for air filled spaces/tissues
and why coupling gel must be used to transfer ultrasound waves from the probe
into the tissue
Ī=Ļc
At an interface between two different tissues (i.e. blood vessel/muscle interface) the
strength of the reflected echoes is determined by the acoustic impedance of the
material.
Acoustic impedance (Ī) is determined by the tissue density (Ļ) and propagation
speed (known as 1540m/s in soft tissue).
17. REFLECTION-PERPENDICULAR INTERFACES
Upon arrival at an tissue boundary/interface, some of the echoes will be reflected
back to the transducer, some will propagate through the tissue beyond the
boundary.
Tissue acoustic impedance effects the amplitude of reflected sound waves.
This is calculated by the Amplitude Reflection Coefficient (R)
R=Z2-Z1
Z1=Acoustic impedance prior to tissue boundary.
Z2=Acoustic impedance across the tissue boundary
18. REFRACTION-NON-PERPENDICULAR INTERFACE
If a sound wave encounters an interface at a non-perpendicular angle, the reflected
angle is the same at the incident angle.
Refraction of the transmitted beam beyond the tissue boundary/interface may also
occur. Two conditions must be met:
1) Non perpendicular beam incidence.
2) Differing speed of sounds either side of the interface.
The amount of Refraction is calculated using SNELLāS LAW.
sinĪøt = c2
sinĪøi = c1
19. ATTENUATION
Attenuation is the weakening of sound waves as they propagate through tissue.
The main culprit for attenuation is depth.
Attenuation (dB)= Ī±(dB/cm) x d (cm)
Ī±=attenuation coefficient
d= Depth
Another factor affecting attenuation is Frequency.
Attenuation Increases with Increasing Frequency
21. A B-Mode image is formed by transmitting pulses of ultrasound waves into
the body, where they encounter interfaces/tissue boundaries.
These surfaces produce echoes which are returned back to the transducer for
converting and displaying on the ultrasound monitor.
In order to display the echoes within their corresponding anatomical position,
the depth of the returning echo must be calculated using the RANGE
EQUATION.
T=2D/c
T=Time taken for the transmitted echo to return.
D= Reflector depth from the transducer.
c=Average speed of sound in soft tissue = 1540m/s
23. REVERBERATION
Occurs when a sound reverberates back and forth between the two strong
parallel reflectors.
This artifact can be improved by changing the angle of isonation.
24. MIRROR IMAGE
This type of artefact is closely associated with reverberation.
Mirror images form when echoes are falsely displayed beyond a strong reflector.
Transmission of sound waves through structure to a strongly reflecting surface
such as bone or air.
These waves are then reflected back up towards the transducer, however they are
reflected by the initial structure and returned back down throughout the tissue.
After numerous rounds of reverberation, the echoes eventually arrive back to the
transducer but because they arrive after the echoes from the strongly reflecting
surface, the ultrasound machine falsely displays a second āmirror imageā beyond
the strong reflector surface.
25. ā¢ The average speed of sound in soft tissue is 1540m/s. This value is assumed
when calculating depth of reflector echoes.
ā¢ If the propagation speed deviates from this value, the reflector will be displayed
either to near or too far from the transducer.
ā¢ Speed error therefore displaces structures within the axial plane.
ā¢ Can be prevented by changing the angle of the beam.
Speed Error
26. SHADOWING
Shadowing occurs when echoes beyond a strongly reflective or attenuating
structure are reduced in strength (decreased amplitude).
The reduced amplitudes are displayed as much darker echoes.
Examples are calcific plaque along a vessels.
This results in shadowing, sometimes obscuring the vessel segment
27. ENHANCEMENT
In contrast to shadowing, some weakly attenuating structures facilitate
strengthening of echo amplitudes.
These high amplitude signals are displayed as bright echoes compared to
surrounding tissue.
Fluid filled collections such as a seroma often display enhancement beyond the
structure.
Enhancement can help to distinguish fluid filled seromas (weakly attenuating)
from resolving haematomas (less enhancement compared to seromas).
29. DOPPLER EFFECT
The Doppler effect is used in vascular ultrasound imaging and is defined as āthe
change in frequency of a detected wave when the source or the detector are
movingā
The Doppler equation is:
fd = 2 ft v cosĪø
c
ā¢ fd is the Doppler shift frequency
ā¢ ft is the frequency emitted by the transducer
ā¢ Īø is the angle between the Doppler beam & the direction of flow
ā¢ c is the velocity of sound in the medium
ā¢ v is the speed of the blood cells
30. ANGLE OF INSONATION Īø
The angle between the ultrasound beam & the direction of blood flow Īø is of
fundamental importance in clinical practice
As Īø increases, cos Īø decreases and the Doppler shift frequency fd decreases
At Īø =90Ā°, there is no Doppler shift and no signal will be heard
31. VELOCITY PROFILE & DOPPLER SPECTRUM
The velocity profile is the range of velocities across the vessel
Each of the velocities within the blood flow velocity profile will produce a different
Doppler shift frequency fd
The Doppler spectrum is the combination of the different velocities reflected from
across the lumen of a blood vessel
32. GENERATION OF A COLOUR DOPPLER IMAGE
Using the Doppler principle, images of tissue motion or blood flow are produced
Blood cells are displayed as a colour coded image, which is superimposed onto the
B-mode image
The mean Doppler frequency in each blood cell along a scan line is represented
by an associated shade of colour
33. GENERATION OF A COLOUR DOPPLER IMAGE
Low mean Doppler frequencies are displayed in darker shades and high Doppler
frequencies in lighter shades
The display is arranged to show both flow toward and away from the direction of
the incident beam of ultrasound e.g. shades of red for one direction and shades of
blue for the opposite direction
Red - blood flow
travelling towards
transducer
Blue - blood flow
travelling away
from transducer
34. BLOOD FLOW VELOCITY PROFILE ā LAMINAR FLOW
Normal laminar flow demonstrates slow flow close to the vessel walls, due to
frictional forces and faster flow centre stream
35. ALIASING
Colour Doppler information is calculated from a sampled signal, therefore is
subject to the Nyquist limit.(NL=one half of PRF)
Hence, colour aliasing can occur in the presence of high mean Doppler frequencies
(Exceeding Nyquist limit)
In aliasing, displayed colours āwrap aroundā the colour scale & the colours change
from the maximum colour in one direction, to the maximum colour in the opposite
direction
36. MAIN COLOUR DOPPLER CONTROLS
The following controls on the ultrasound scanner are adjusted continuously
throughout the scan to optimise the colour Doppler images
ā¢ Colour box steering
ā¢ Colour direction assignment
ā¢ Colour scale/pulse repetition frequency
ā¢ Colour display baseline
ā¢ Colour wall filter
ā¢ Colour box size
ā¢ Colour gain
ā¢ Focal zones
37. COLOUR DOPPLER IMAGES
Indicate patency or absence of flow
Flow through a stenosis
Highlight areas of flow disturbance
Pulsatile flow
Indicate flow direction, helping to define tortuosity or steal phenomena
Indicate flow in vessels too small to be resolved in B-mode e.g. arteriovenous
malformations
38. GENERATION OF A POWER DOPPLER IMAGE
Power Doppler displays the amplitude of the Doppler signals
A single colour scale is used and different shades represent different signal strengths
Bright shades represent strong signals
Dimmer shades represent weaker signals
39. GENERATION OF A POWER DOPPLER IMAGE
The colour and brightness of signals are related to the number of blood cells
producing the Doppler shift
Advantages over Colour Doppler
ā¢ More sensitive than colour Doppler
ā¢ Not direction dependent
ā¢ No aliasing
40. POWER DOPPLER IMAGES
Indicate patency or absence of flow
Flow through a stenosis
Pulsatile flow
Indicate flow in vessels too small to be resolved in B-mode e.g. arteriovenous
malformations
41. ARTEFACTS IN COLOUR & POWER
DOPPLER
Flash Artefact
ā¢ High-pass filters are used to suppress signals arising from stationary or near
stationary tissue
ā¢ When the transducer is moved or there is movement of tissue e.g. patient
movement from respiration, flashes of colour are seen across the field of
view
Mirror Artefact
ā¢ Vessels overlying strong reflectors e.g. bone/air may also be seen as
reflections in the image lying beyond the reflector surface
42. APPLICATIONS OF COLOUR &
POWER DOPPLER
Determine the presence, location and degree of disease in the peripheral
arteries and veins
Evaluate blood flow in the lower limb arteries in patients with intermittent
claudication or critical ischemia.
Evaluate blood flow in the upper limb arteries in patients with ischemia or
symptoms of TOS.
Evaluate blood flow in the carotid arteries after a TIA or stroke
Evaluate blood flow in the lower limb veins in patients with varicose veins
or suspected DVT
43. APPLICATIONS OF COLOUR &
POWER DOPPLER
Map veins and check patency to determine suitability for use for bypass
grafts or fistula formation
Monitor the flow of blood following vascular surgery e.g. Lower limb
bypass surveillance, EVAR surveillance or fistula surveillance
Guide treatment of varicose veins such as laser, radio frequency ablation or
foam sclerotherapy
Determine patency or vascularisation in collections e.g. false aneurysms,
carotid body tumours