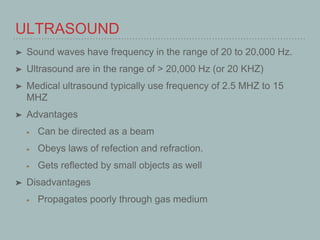
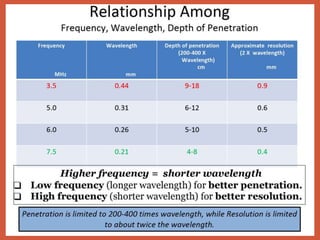
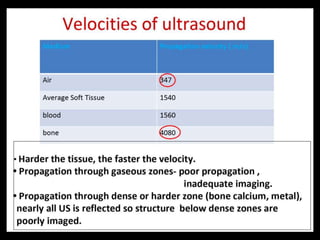
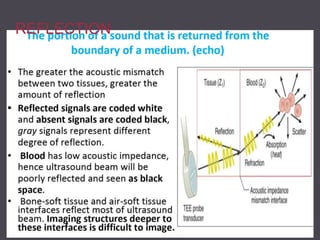
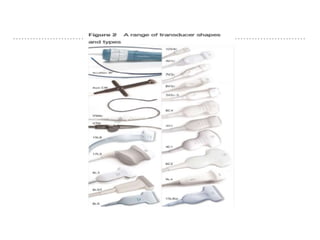
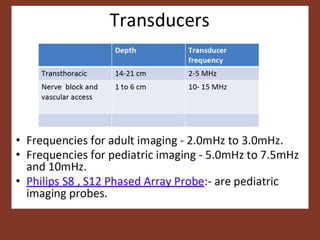
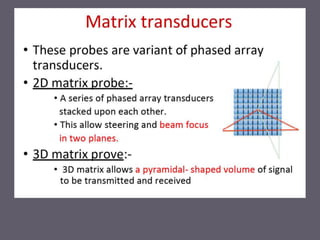
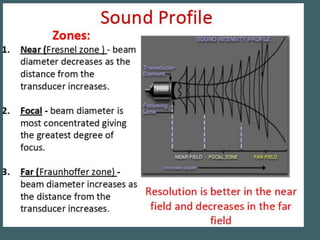
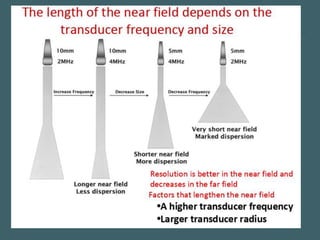
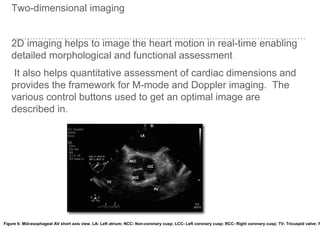
This document discusses the basics of echocardiography and Doppler ultrasound principles. It begins by explaining why a basic understanding is necessary and provides an overview of ultrasound, including its frequency range, advantages, and disadvantages. It then covers topics such as attenuation, reflection, field of view, scan lines, frames, depth, zoom, freeze, and two-dimensional imaging controls including transmit power, gain, time gain compensation, focus, frequency, dynamic range, and compression. The document provides explanations of how these various controls and settings impact the ultrasound image quality.


![Field of view
The field of view (FOV) is the plane or area scanned by the ultrasound transducer.
Sector
The sector is a fan-shaped image with the narrow end displaying objects closer to the
transducer and the wider section showing the more distant structures . The region of
interest (ROI) should be kept as close as possible to the TEE probe. 2-D imaging is
displayed on a gray scale, with the high amplitude signals being ascribed a white color
and low amplitude a black color. The shades of gray form a picture of the heart in a
sector.
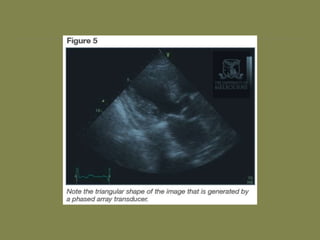
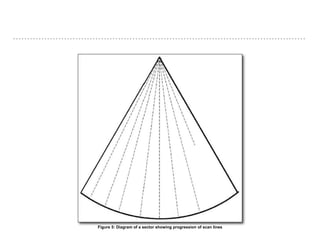
Scan lines
Each piezoelectric element of the transducer transmits a US pulse along a line. All
echoes from the structures along this line are received, thus producing a scan line
whose length is the image depth. [12] The ultrasound beam then moves on to the next
scan line position where the process is repeated [Figure 5]. Increased scan lines
improve the resolution of the image.](https://image.slidesharecdn.com/lph6l8ugrvqvfpilajs5-signature-b5a49685666e2ad6263350327a671222d94b6b9d1ac6c92e4724325ac36b3a8d-poli-191221121104/85/Image-optimisation-tecniques-in-echocardiography-47-320.jpg)
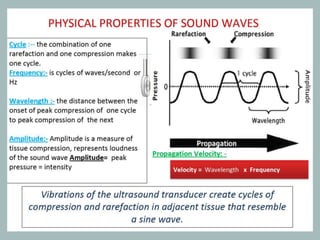
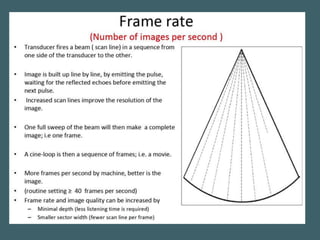
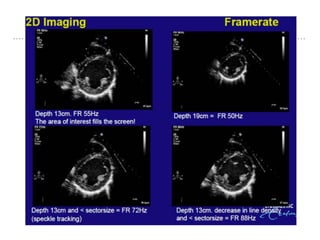
![Frame
Each frame represents a total sweep of the US beam and is made up of a complete set
of scan lines depending on the number of individual piezoelectric elements in the
transducer. [12]
Frame rate
The frame rate (number of images recorded every second, i.e., Hertz) provides a
seamless, continuous, moving 'real time' display. [13] The highest frame rate possible
should be sought as a lower frame rate lends a 'swimmy' quality to the moving image.
In order to maintain a higher frame rate, the smallest FOV that allows the display of the
region of interest, should be employed. [14]
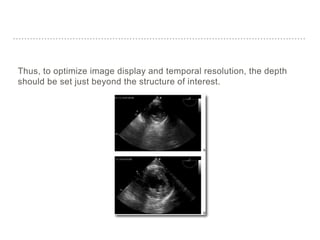
Depth
This control alters the vertical FOV of the image, and is used to get the ROI into view.
Increasing the depth increases the time taken for the signal to return back to the
transducer, thereby decreasing the frame rate, and vice versa.](https://image.slidesharecdn.com/lph6l8ugrvqvfpilajs5-signature-b5a49685666e2ad6263350327a671222d94b6b9d1ac6c92e4724325ac36b3a8d-poli-191221121104/85/Image-optimisation-tecniques-in-echocardiography-49-320.jpg)
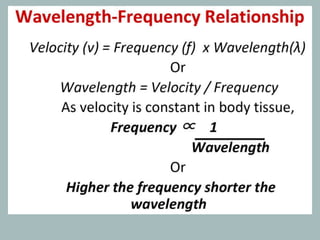
![Zoom
Zoom is used to magnify and improve the resolution of the selected ROI, by
decreasing the sector size and increasing line density. The entire FOV is used to
display the enlarged ROI image. This function is invaluable in the investigation of
valvular morphology, pathology, and relatively small pathological masses, such as,
vegetations. It can also be employed to improve measurement accuracy, when
measuring smaller structures. [14]
Most ultrasound scanners feature one or more zoom modes. In a receive zoom mode,
the ROI is selected via trackball control and then magnified. Receive zoom is a post-
processing function that simply enlarges the pixels within a selected ROI, without
improving the fundamental resolution, akin to a magnifying glass. [15] An acoustic or
transmit zoom is a pre-processing function that digitizes the image data in the selected
region at a higher density, by increasing the data bandwidths, to provide a higher
resolution zoom image. [](https://image.slidesharecdn.com/lph6l8ugrvqvfpilajs5-signature-b5a49685666e2ad6263350327a671222d94b6b9d1ac6c92e4724325ac36b3a8d-poli-191221121104/85/Image-optimisation-tecniques-in-echocardiography-50-320.jpg)
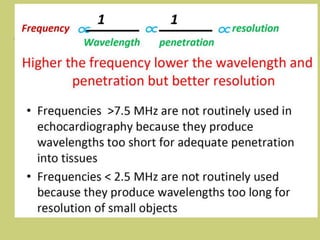
![Freeze
The freeze button freezes the real-time display and retains it in the digital memory, in a
sequence of the immediately preceding frames. Scrolling the frames will allow
selection of the appropriate image for study, annotation, and archiving. [15] Freezing the
image also stops the transmission of the ultrasound and prevents the probe from
overheating and possible tissue damage.
Trackball
This control is a stationary pointing device that contains a movable ball rotated with the
fingers or palm, similar to using a mouse on the PC. It is used for moving Doppler
boxes to the desired location and for measuring and annotating.](https://image.slidesharecdn.com/lph6l8ugrvqvfpilajs5-signature-b5a49685666e2ad6263350327a671222d94b6b9d1ac6c92e4724325ac36b3a8d-poli-191221121104/85/Image-optimisation-tecniques-in-echocardiography-51-320.jpg)
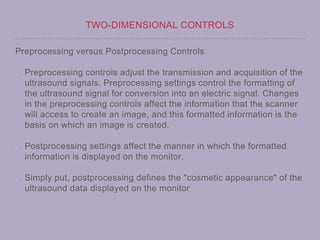
![System controls
Power is the rate of energy delivered in a sound wave. Intensity is the concentration of power within the
cross-sectional area of the US beam. [20] There are several system controls that can be used to obtain a
good image by using minimal acoustic intensity. These controls can be divided into three categories:
Direct controls
The Power control has a direct impact on acoustic intensity and is used to select the minimal intensity
levels required to produce an optimal image.
Indirect controls
The controls of imaging mode, pulse repetition frequency (PRF), focus depth and frequency have an
indirect effect on acoustic intensity. 2D imaging mode disperses energy over the entire scanned area but
Doppler concentrates energy in a particular area. Increasing the rate and time of the ultrasound signals
increases the time-averaged intensity value.
Receiver controls
Receiver controls such as gain, dynamic range and image processing influence ultrasound without
affecting the intensity output. Hence they should be optimized first before increasing the power.
Another classification of these controls can be based on the time of modification of the signal.
Preprocessing controls modify the analog and digital signal prior to storage in the computer memory
whereas postprocessing controls manipulate the image after its entry into memory. [21]](https://image.slidesharecdn.com/lph6l8ugrvqvfpilajs5-signature-b5a49685666e2ad6263350327a671222d94b6b9d1ac6c92e4724325ac36b3a8d-poli-191221121104/85/Image-optimisation-tecniques-in-echocardiography-53-320.jpg)
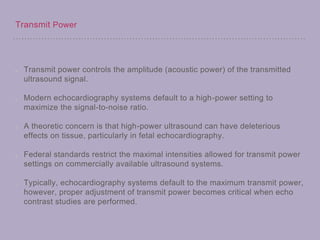
![Transmit power
Most machines describe power in terms of decibels (dB). An increase of 3 dB increases power or
intensity by twice the original and a decrease of 3 dB will halve the power- the 3 dB
rule. [23] Minimum power which is consistent with good image quality should be used.
Thermal Index (TI) is an estimate of risk from thermal effects of US and is defined as the ratio of
total acoustic power to that required to raize the temperature by 1°C under defined
assumptions. [9]
Mechanical Index (MI) is an estimate of risk from the non-thermal effects and is the amount of
negative acoustic pressure within an ultrasonic field. It is defined as the peak negative pressure
divided by the square root of the ultrasound frequency. Values of indices less than 1 are generally
considered safe and though a high index reading is not proportional to a bioeffect, every effort
must be made to reduce the chances of a high index. [5]](https://image.slidesharecdn.com/lph6l8ugrvqvfpilajs5-signature-b5a49685666e2ad6263350327a671222d94b6b9d1ac6c92e4724325ac36b3a8d-poli-191221121104/85/Image-optimisation-tecniques-in-echocardiography-54-320.jpg)
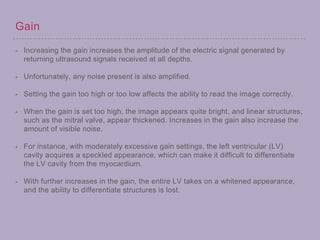
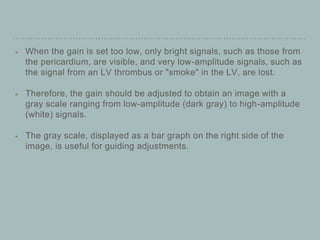
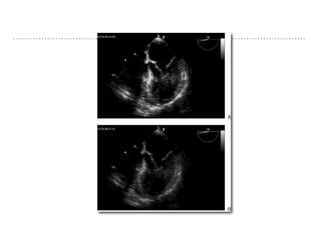
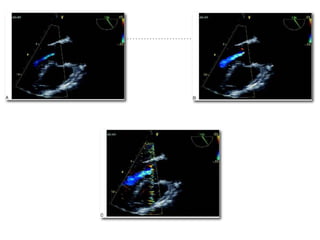
![Gain
Gain is the degree of amplification of
the returning US signal. [20] The gain
button alters the "brightness" of the
whole image by adjusting the
amplification of all returning echo
signals. Minimal gain should be used
to provide an optimal image with good
quality without dropout or blooming of
signals [14] [Figure 7]. As a rule of thumb, fluid
and blood should appear black,
myocardium a medium grey and the
pericardium and calcification, a bright
white color on the grey scale.
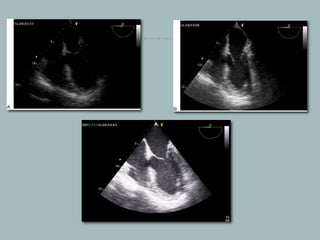
Figure 7: Mid-esophageal AV short axis view. In the image the a arrow highlights a low gain setting of 20; and the coaptation line between NCC and LCC is
not visualized. In image b, the gain is set too high at 100. LCC - Left coronary cusp; NCC - Non coronary cusp; RCC - Right coronary cusp](https://image.slidesharecdn.com/lph6l8ugrvqvfpilajs5-signature-b5a49685666e2ad6263350327a671222d94b6b9d1ac6c92e4724325ac36b3a8d-poli-191221121104/85/Image-optimisation-tecniques-in-echocardiography-56-320.jpg)
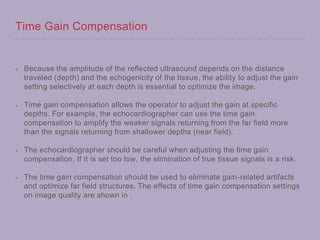
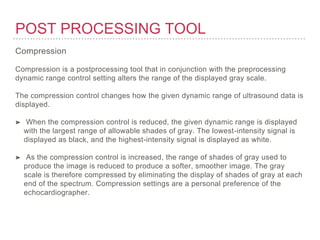
![Time gain compensation (TGC)
As the US beam passes deeper through tissue, there is a steady loss of transmitted
intensity caused by attenuation of ultrasound. TGC toggles amplify the weak
returning signal proportionately to the time delay and increase the gain for that
particular depth . Near field gain is usually set low and the farfield gain is set high to
compensate for the energy loss. Therefore the primary function of TGC is to ensure
signals of similar magnitude at different depth are displayed at same amplification. [20]
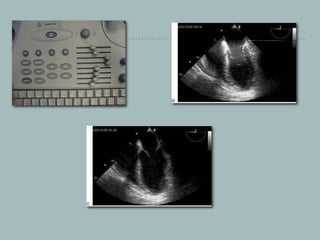
Figure 8: In this mid-esophageal four-chamber view, the TGC toggles at the level of the ventricles have been manipulated to illustrate the high gain at that
particular depth (arrow)](https://image.slidesharecdn.com/lph6l8ugrvqvfpilajs5-signature-b5a49685666e2ad6263350327a671222d94b6b9d1ac6c92e4724325ac36b3a8d-poli-191221121104/85/Image-optimisation-tecniques-in-echocardiography-62-320.jpg)
![Doppler Imaging
The Doppler shift is defined as the change in frequency of sound
reflected by a moving object and is determined by the Doppler
equation [28] [Figure 12]. Doppler shift caused by red blood cells reflecting
ultrasound can be used to assess the trajectory and speed of normal
and abnormal blood flow by determining flow velocity, direction and
turbulence. The two main types of Doppler imaging techniques are
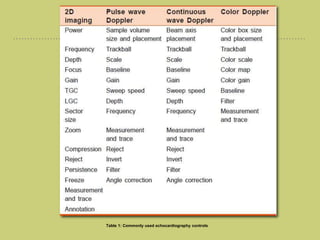
pulsed wave Doppler (PWD) and continuous wave doppler (CWD) [Table 1].
Figure 12: The Doppler frequency shift (fd) depends on the transmitted frequency (ft) and the velocity (V) of the moving blood and the angle (θ) between the ultraso](https://image.slidesharecdn.com/lph6l8ugrvqvfpilajs5-signature-b5a49685666e2ad6263350327a671222d94b6b9d1ac6c92e4724325ac36b3a8d-poli-191221121104/85/Image-optimisation-tecniques-in-echocardiography-89-320.jpg)
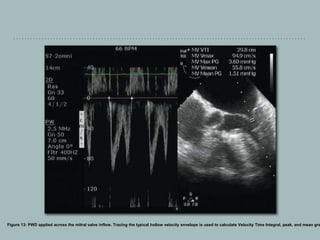
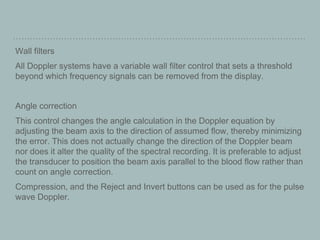
![Pulse wave Doppler
PWD measures low-velocity flows at a specific point along the beam axis.
The beam axis should be parallel to the blood flow to maintain accuracy. For practical
purposes, if the angle between the US beam and the blood flow is greater than 20°, there is an
unacceptable degree of error in estimating the velocity.
PWD is used to diagnose diastolic dysfunction from mitral valve and pulmonary vein inflow
patterns, estimate aortic valve area and calculate stroke volume. [27]
Sampling
PWD uses a single piezoelectric crystal which acts both as a transmitter and receiver to measure
blood velocity intermittently at a particular area called as sample volume.
Adjusting the gate control can increase or decrease the size of the sample volume. The
trackball is used to place the sample volume at the area of interest.](https://image.slidesharecdn.com/lph6l8ugrvqvfpilajs5-signature-b5a49685666e2ad6263350327a671222d94b6b9d1ac6c92e4724325ac36b3a8d-poli-191221121104/85/Image-optimisation-tecniques-in-echocardiography-90-320.jpg)
![Aliasing
The major limitation of PWD is the maximum velocity (2 m/sec) that can be
measured. A velocity higher than half of pulse repetition frequency (Nyquist
limit) will appear as an ambiguous signal on the other side of the baseline. This
is known as aliasing.
High PRF Doppler imaging is a technique that combines features of both PWD
and CWD imaging which can be used to prevent aliasing. [20]
Frequency
Since Doppler shift is proportional to ultrasound frequency, lower frequency
transducers are more useful as there is less chance of reaching the Nyquist limit.](https://image.slidesharecdn.com/lph6l8ugrvqvfpilajs5-signature-b5a49685666e2ad6263350327a671222d94b6b9d1ac6c92e4724325ac36b3a8d-poli-191221121104/85/Image-optimisation-tecniques-in-echocardiography-93-320.jpg)
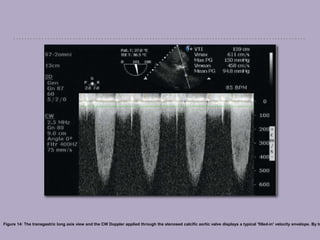
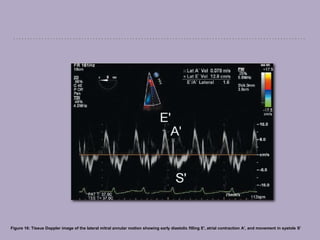
![Continuous wave Doppler
Continuous wave Doppler (CWD) can accurately measure high-velocity flows (<9
m/second) along the beam axis, provided it is parallel to the blood flow. It is used to
calculate the grade of stenotic valve lesions and estimates pulmonary artery
pressure. [27]
Sampling
The CWD uses two separate piezoelectric crystals to transmit and receive signals in
order to measure all the different blood velocities along the beam axis, continuously.
This makes it difficult to accurately know the depth of the reflected signal. The main
disadvantage of CWD is its lack of depth discrimination (Range ambiguity).
Display
The CWD is displayed as a waveform with a filled-in spectrum caused by the different
velocities being measured along the scan line [Figure 14]. A turbulent flow, caused by
obstruction, results in spectral broadening and increased velocities.](https://image.slidesharecdn.com/lph6l8ugrvqvfpilajs5-signature-b5a49685666e2ad6263350327a671222d94b6b9d1ac6c92e4724325ac36b3a8d-poli-191221121104/85/Image-optimisation-tecniques-in-echocardiography-95-320.jpg)
![Color flow Doppler
The Color Flow Doppler (CFD) provides a striking display of both
blood flow and the cardiac anatomy by superimposing the PWD
flow data on 2D images [29] [Figure 15]. It is useful in diagnosing the
abnormal flow as well as confirming the normal structures.
Figure 15: A mid esophageal, four-chamber view superimposed with color flow doppler showing mitral regurgitation. The vena contracta (VC) depicts the regurgita](https://image.slidesharecdn.com/lph6l8ugrvqvfpilajs5-signature-b5a49685666e2ad6263350327a671222d94b6b9d1ac6c92e4724325ac36b3a8d-poli-191221121104/85/Image-optimisation-tecniques-in-echocardiography-99-320.jpg)

![Sampling and depth — Color sector size and placement
The size, position, and trackball controls are used to change the width,
length, and position of the color box.
The color box, while enclosing the ROI, should be narrow and as close to
the transducer as possible. This prevents aliasing, lower frame rates, and
'swimmy images' caused by the longer time taken to interrogate pulses
that are far away from the transducer. [19]
Gain
Excessive 2-D gain before superimposing the CFD should be avoided, as
it may obscure the flow.
Optimal adjustment of the color gain setting is essential, as too much gain
will result in noise and impair the image quality and interpretation.
A low gain setting will attenuate sensitivity and make the image appear
smaller than the flow jet.](https://image.slidesharecdn.com/lph6l8ugrvqvfpilajs5-signature-b5a49685666e2ad6263350327a671222d94b6b9d1ac6c92e4724325ac36b3a8d-poli-191221121104/85/Image-optimisation-tecniques-in-echocardiography-101-320.jpg)
![Three-dimensional (3D) echocardiography
The 3D technology enables us to view the cardiac structures
from different perspectives. Real-time (RT) 3D TEE, using a
matrix array probe, interrogates a volume of tissue and produces
pyramidal-shaped ultrasound datasets. [31] The 3D image quality
depends on the quality and number of 2D images used, limiting
motion artifacts and achieving adequate ECG, and respiratory
gating. [32]](https://image.slidesharecdn.com/lph6l8ugrvqvfpilajs5-signature-b5a49685666e2ad6263350327a671222d94b6b9d1ac6c92e4724325ac36b3a8d-poli-191221121104/85/Image-optimisation-tecniques-in-echocardiography-106-320.jpg)
![Three-dimensional live mode
This displays a live narrow angle RT 3D volume of the selected
2D view for single or multiple heart beats with a frame rate of 20 -
30 Hz. The maximum sector dimensions are 60°×30° in the
lateral and elevational planes, respectively, which can be
changed using trackball controls. Using physical movements of
the probe, this mode can be used to rapidly scan the heart and
guide RT interventional procedures. [33]](https://image.slidesharecdn.com/lph6l8ugrvqvfpilajs5-signature-b5a49685666e2ad6263350327a671222d94b6b9d1ac6c92e4724325ac36b3a8d-poli-191221121104/85/Image-optimisation-tecniques-in-echocardiography-107-320.jpg)
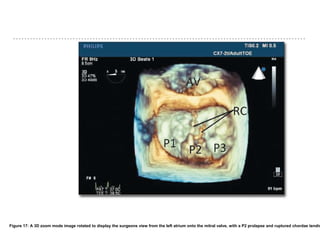
![Three-dimensional zoom mode
This provides a magnified RT 3D image, with sector dimensions
of 90° × 90° and a lower frame rate of 10 - 15 Hz. Selecting a 3D
zoom displays two orthogonal 2D images, which can be modified
in the lateral and elevational planes, to accommodate the ROI
within the box. The acquired dataset can then be cropped and
orientated to provide excellent spatial resolution for structures
such as mitral valves, intraoperatively [Figure 17].](https://image.slidesharecdn.com/lph6l8ugrvqvfpilajs5-signature-b5a49685666e2ad6263350327a671222d94b6b9d1ac6c92e4724325ac36b3a8d-poli-191221121104/85/Image-optimisation-tecniques-in-echocardiography-108-320.jpg)
![Three-dimensional full-volume mode
Although this mode is not an RT imaging modality, it provides a large volume image, with
sector dimensions of 75°×75°. Selecting 'Full volume' displays two orthogonal 2D images
that can be modified in the lateral and elevational planes, to accommodate the ROI. Small
sub-volumes are acquired over four to seven cardiac cycles, synchronized, and then
'stitched' together to display the 'blob view'. The frame rate varies between 20 and 50 Hz,
depending on the number of cardiac cycles. The dataset can then be cropped and
orientated. The 3D color flow Doppler can be superimposed on a 3D full volume, using
seven cardiac cycles, but it reduces the frame rate to <10 Hz.
Arrhythmias, electrocautery artifacts, and probe movements cause a demarcation line,
termed as a stitch artifact, which is seen between the sub-volumes, distorting the
anatomy. [34] Offline analysis of digitally recorded cine loops using specialist software allows
manipulation, rotation and cropping of an image to display details in a surgical orientation
including measurements of distance, area and volume.](https://image.slidesharecdn.com/lph6l8ugrvqvfpilajs5-signature-b5a49685666e2ad6263350327a671222d94b6b9d1ac6c92e4724325ac36b3a8d-poli-191221121104/85/Image-optimisation-tecniques-in-echocardiography-110-320.jpg)