Downloaded 749 times

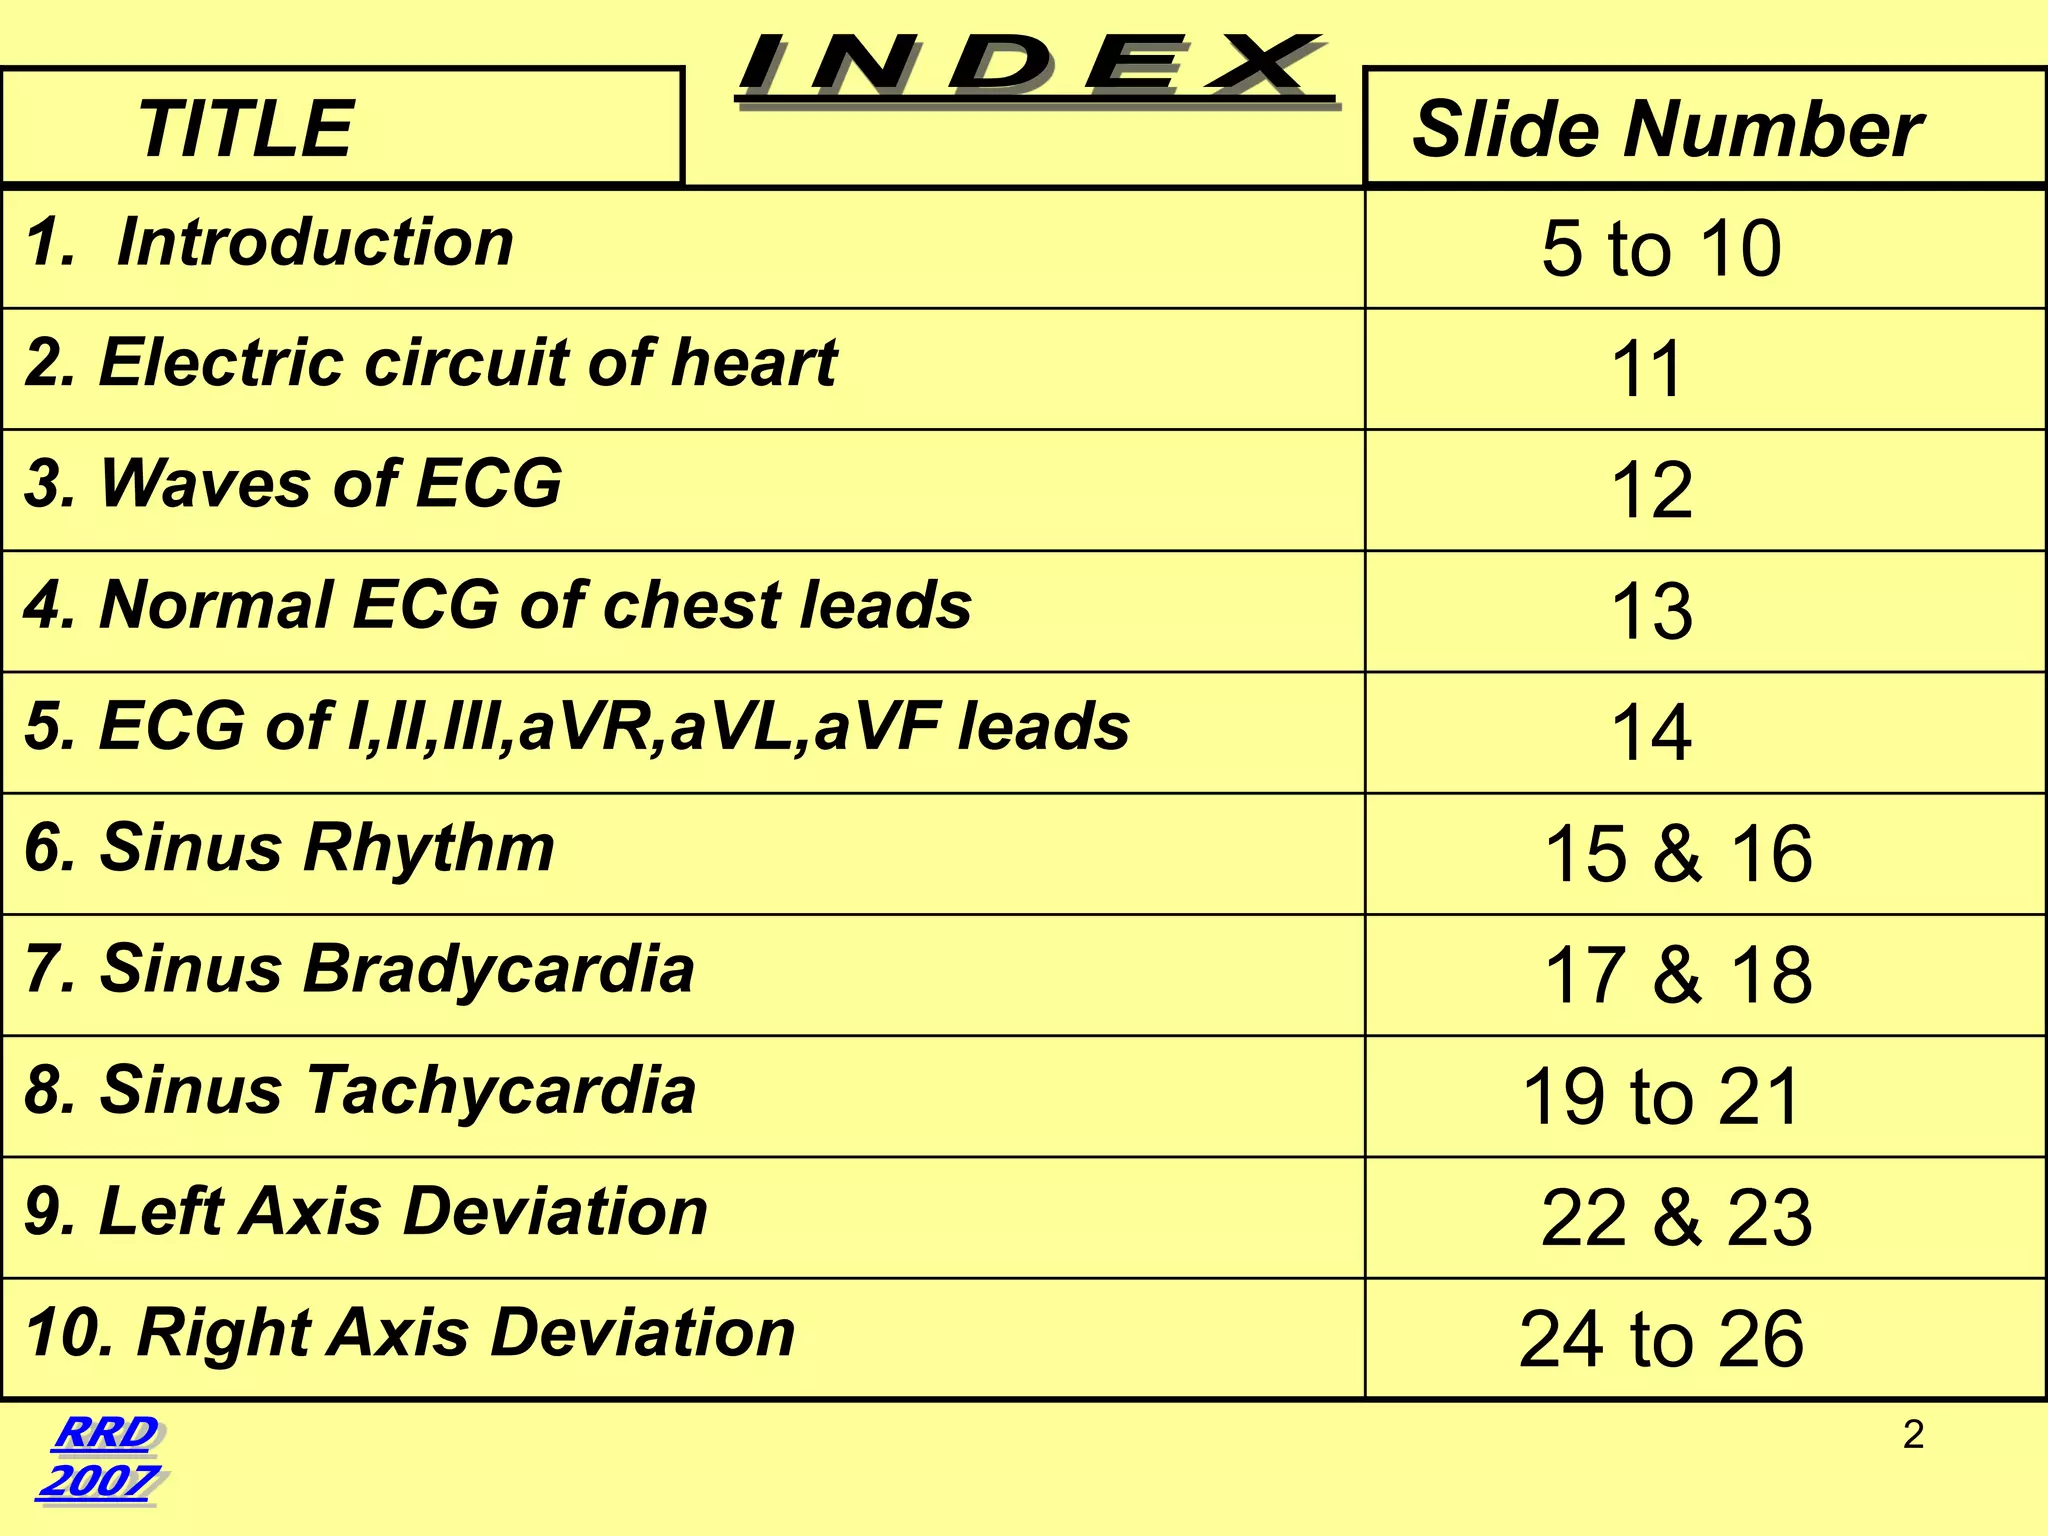
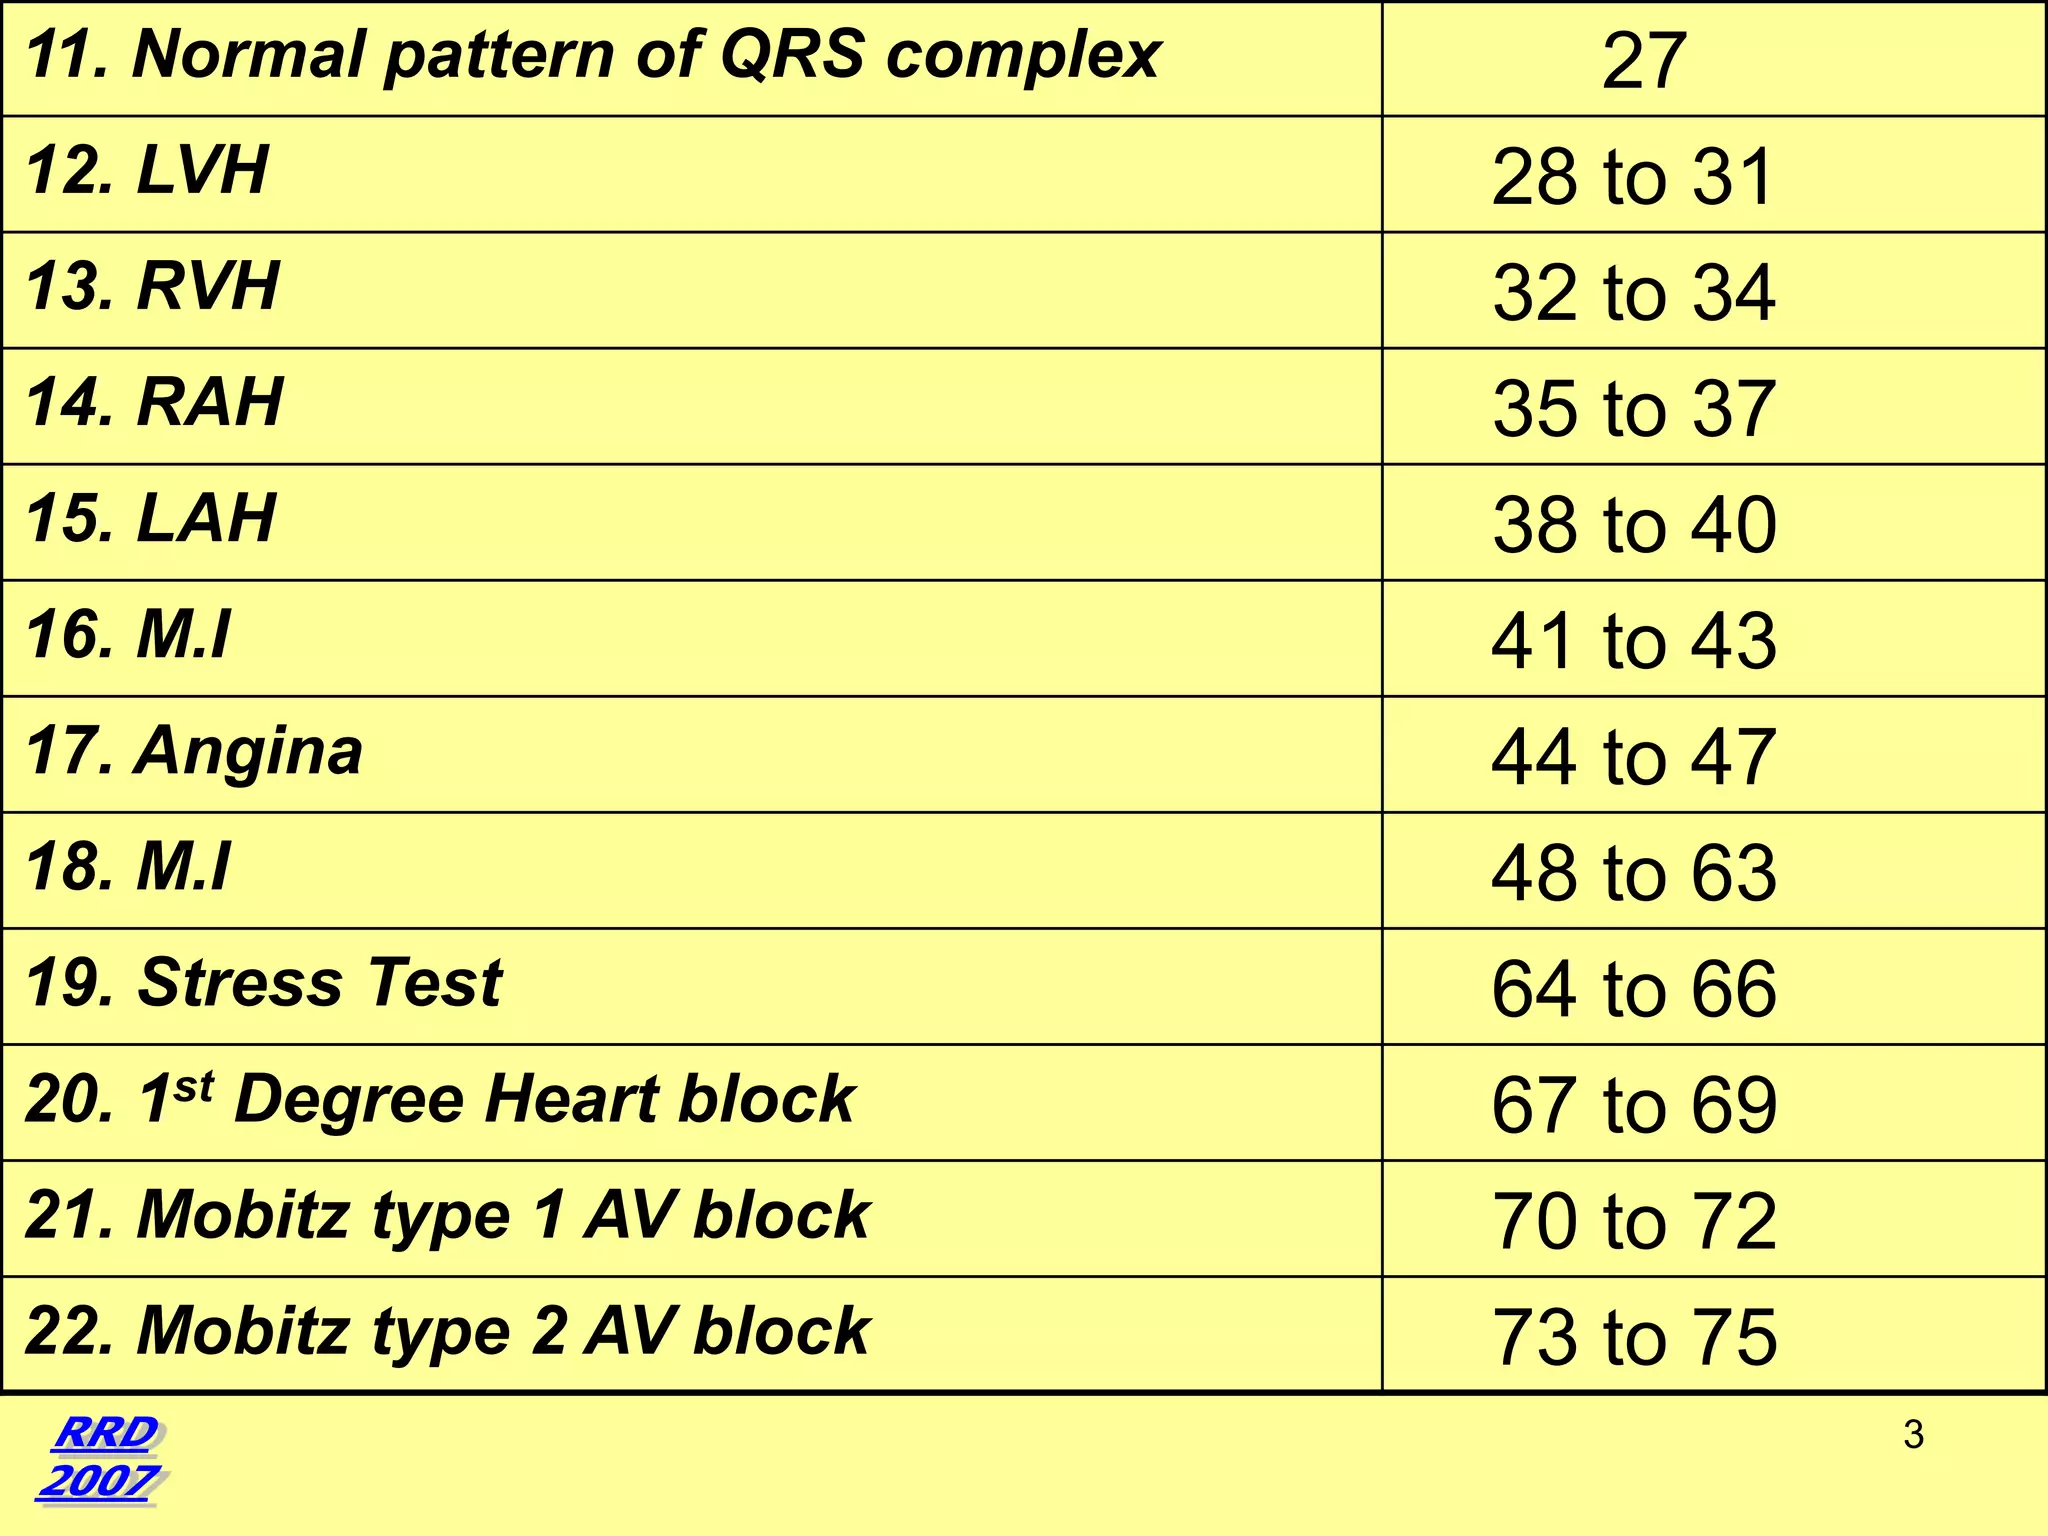
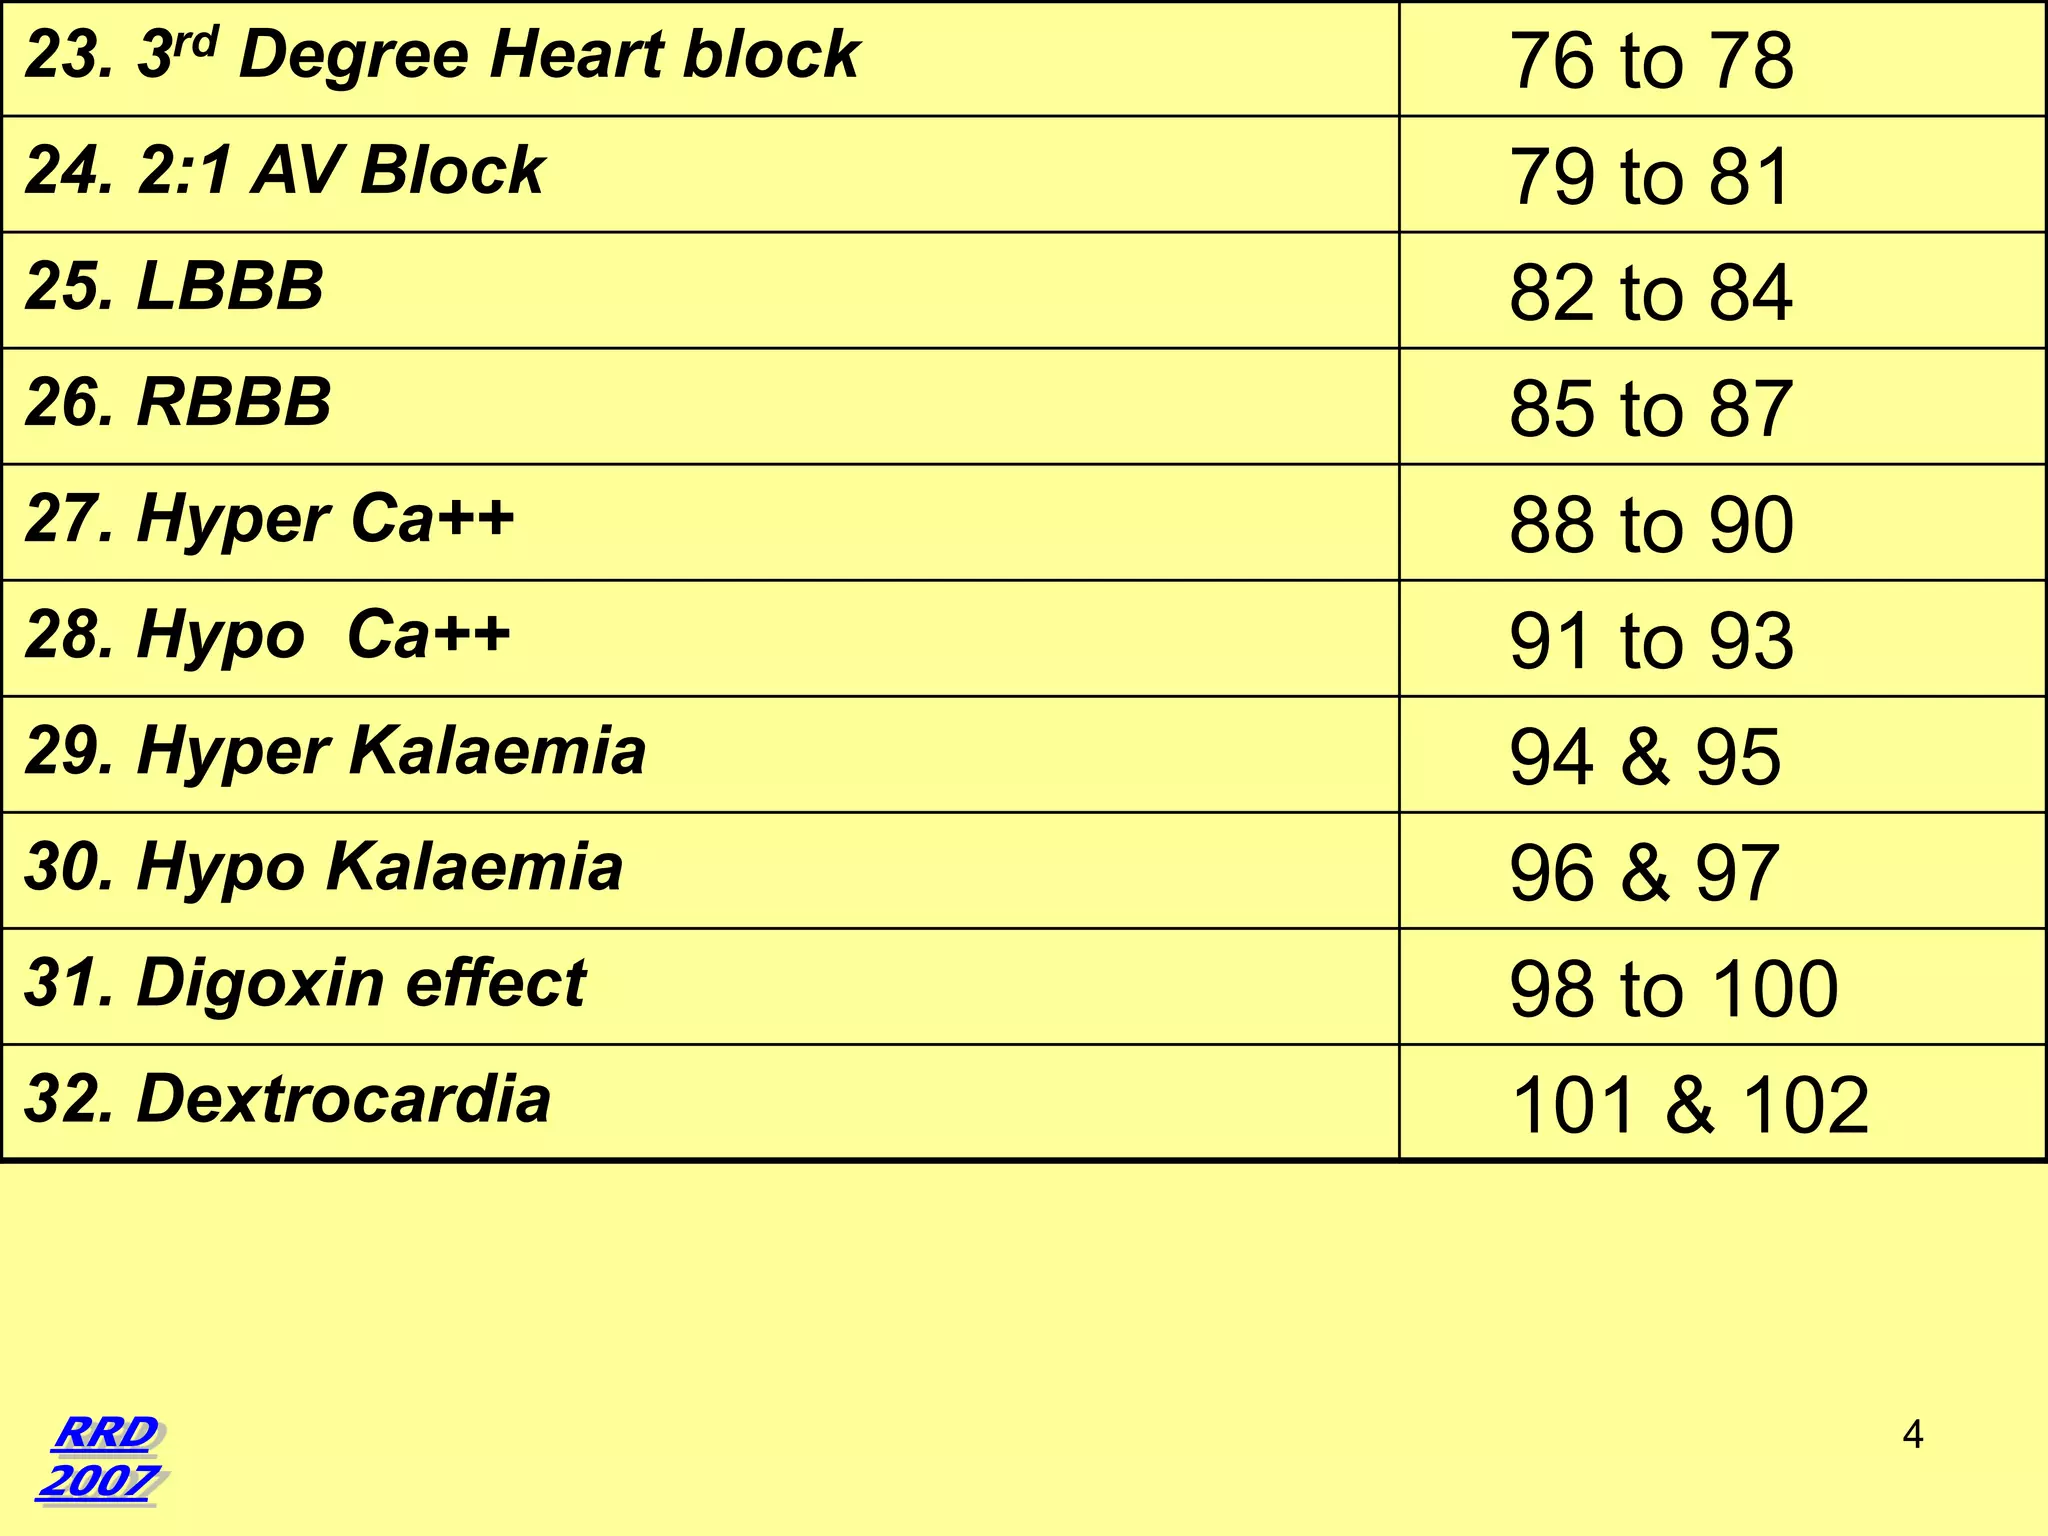
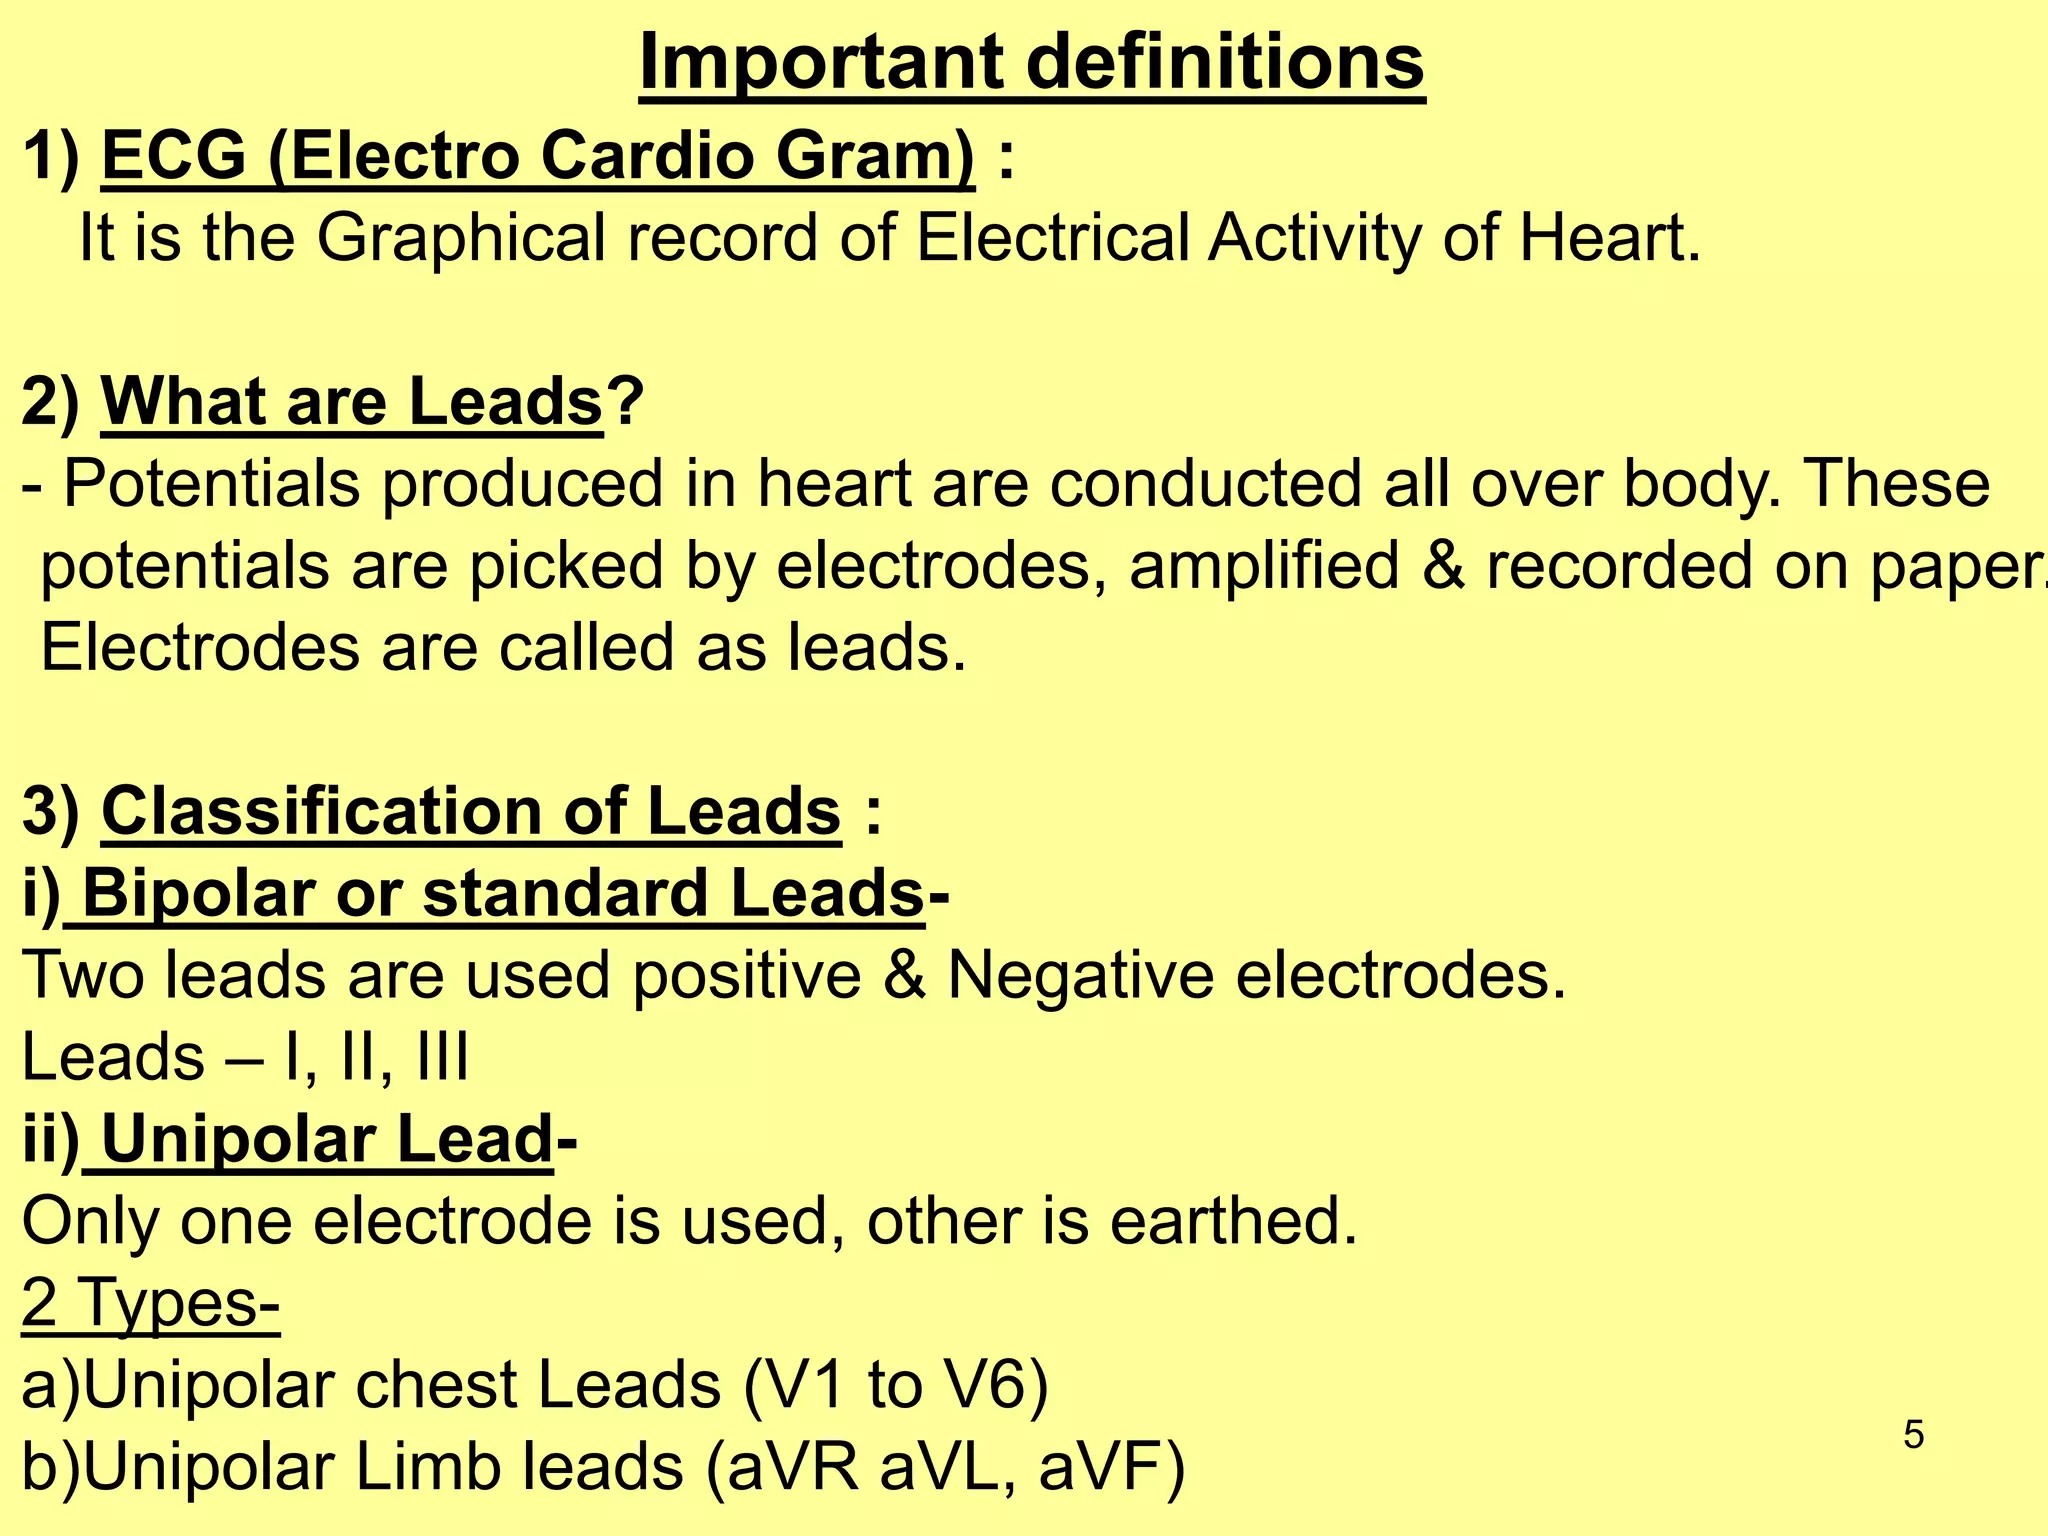
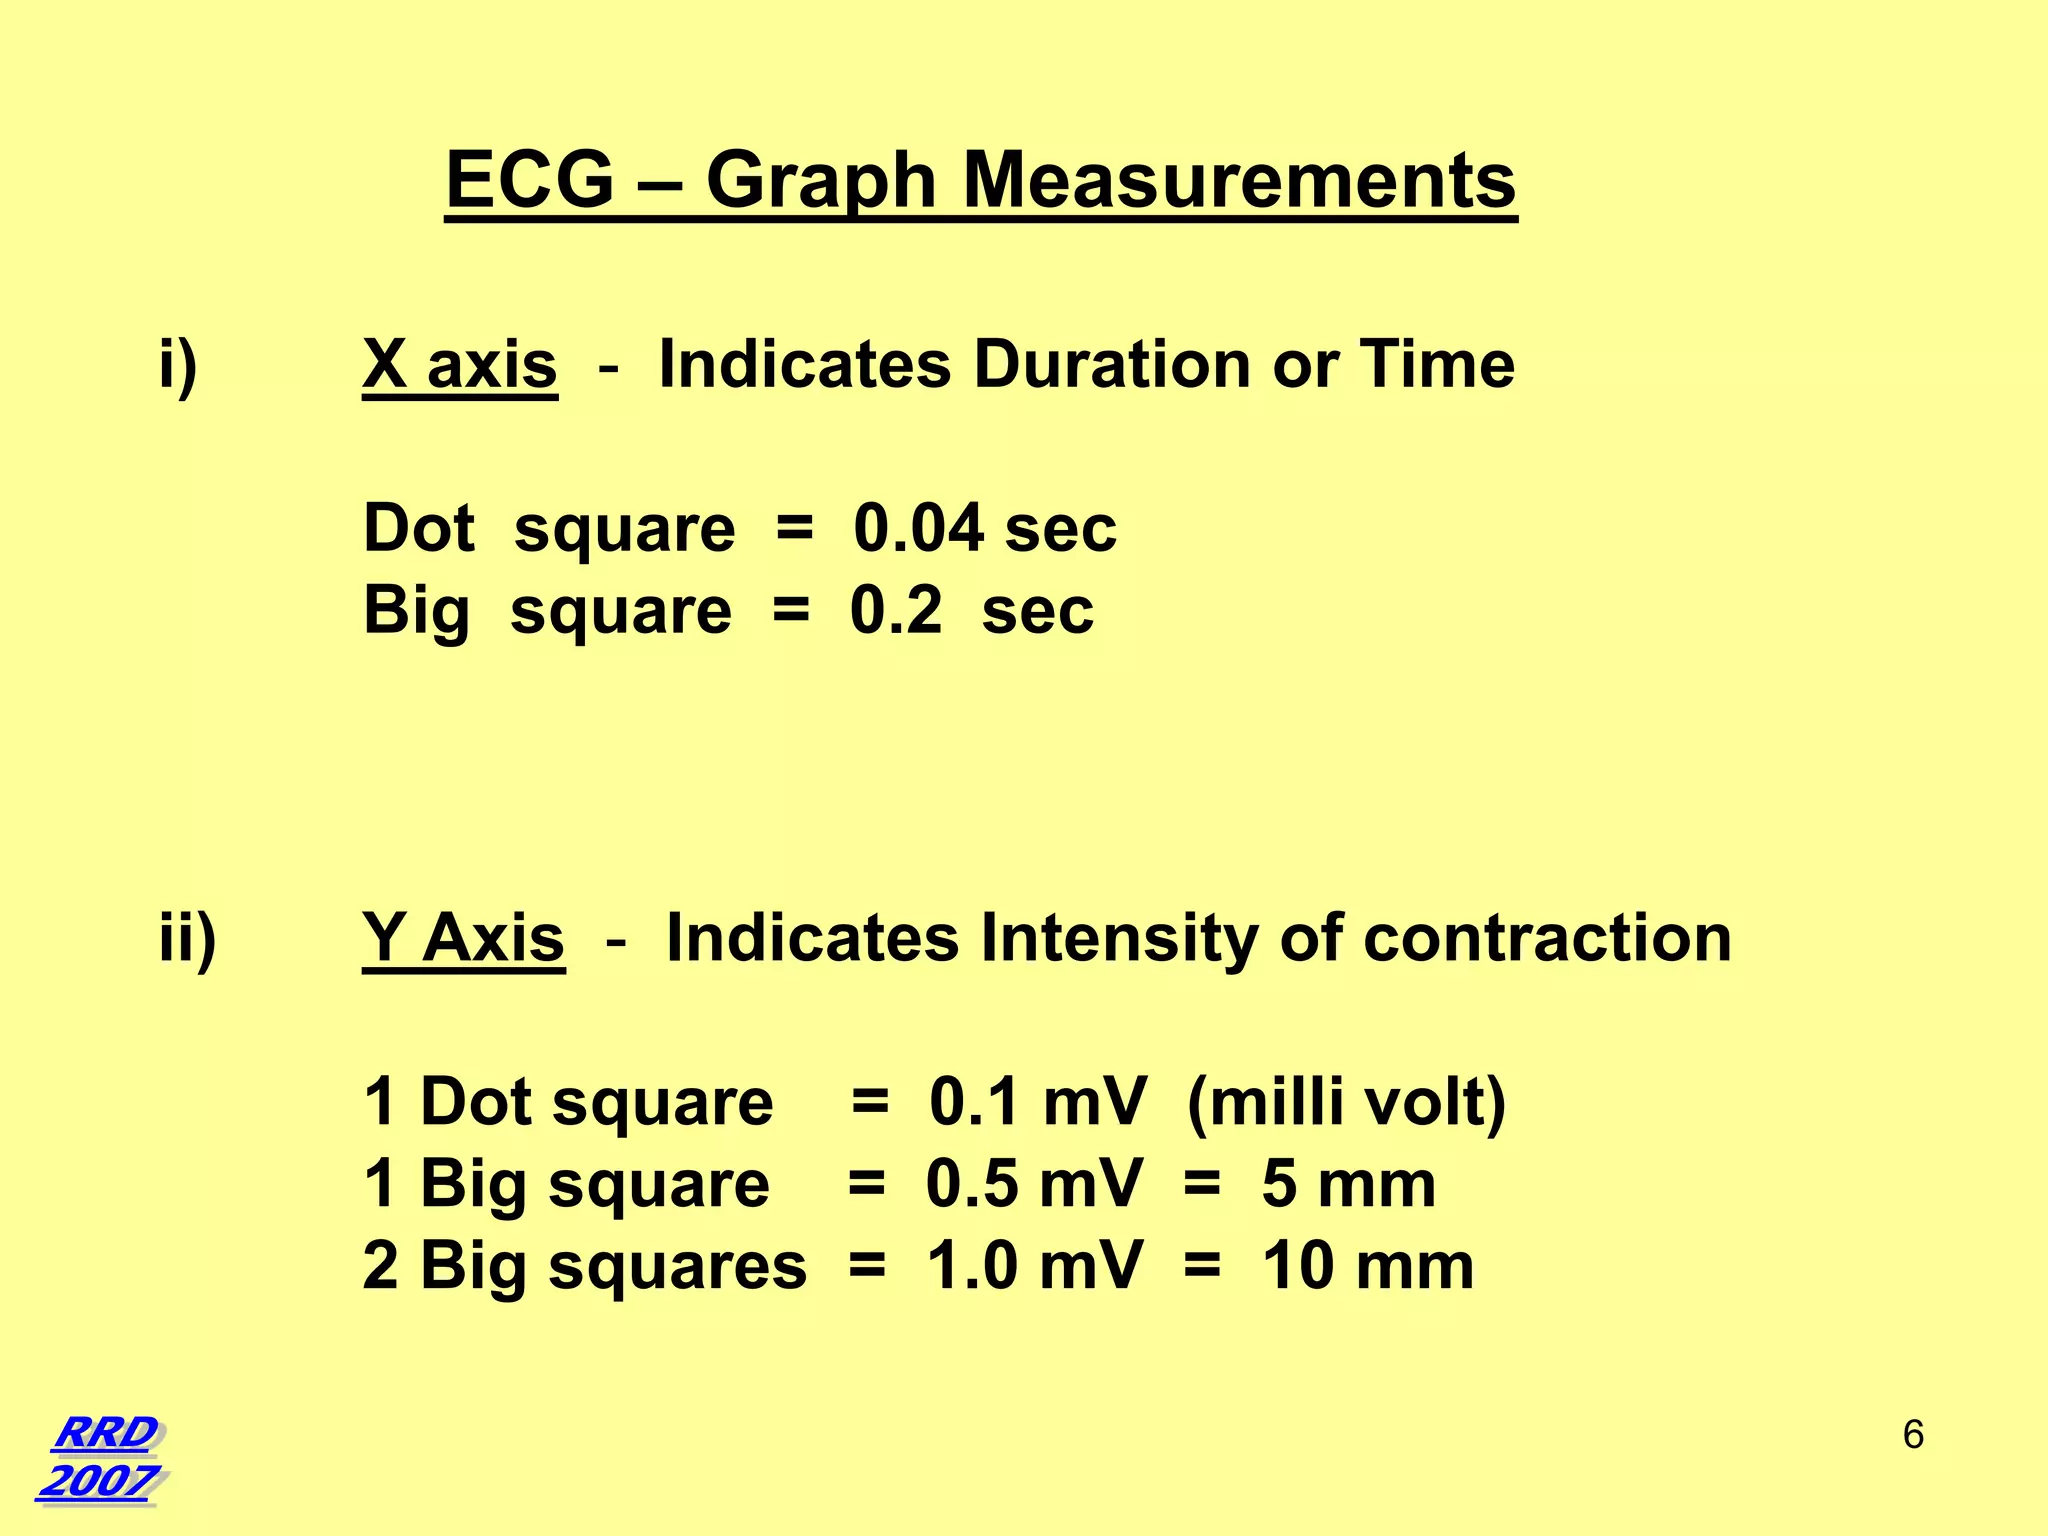
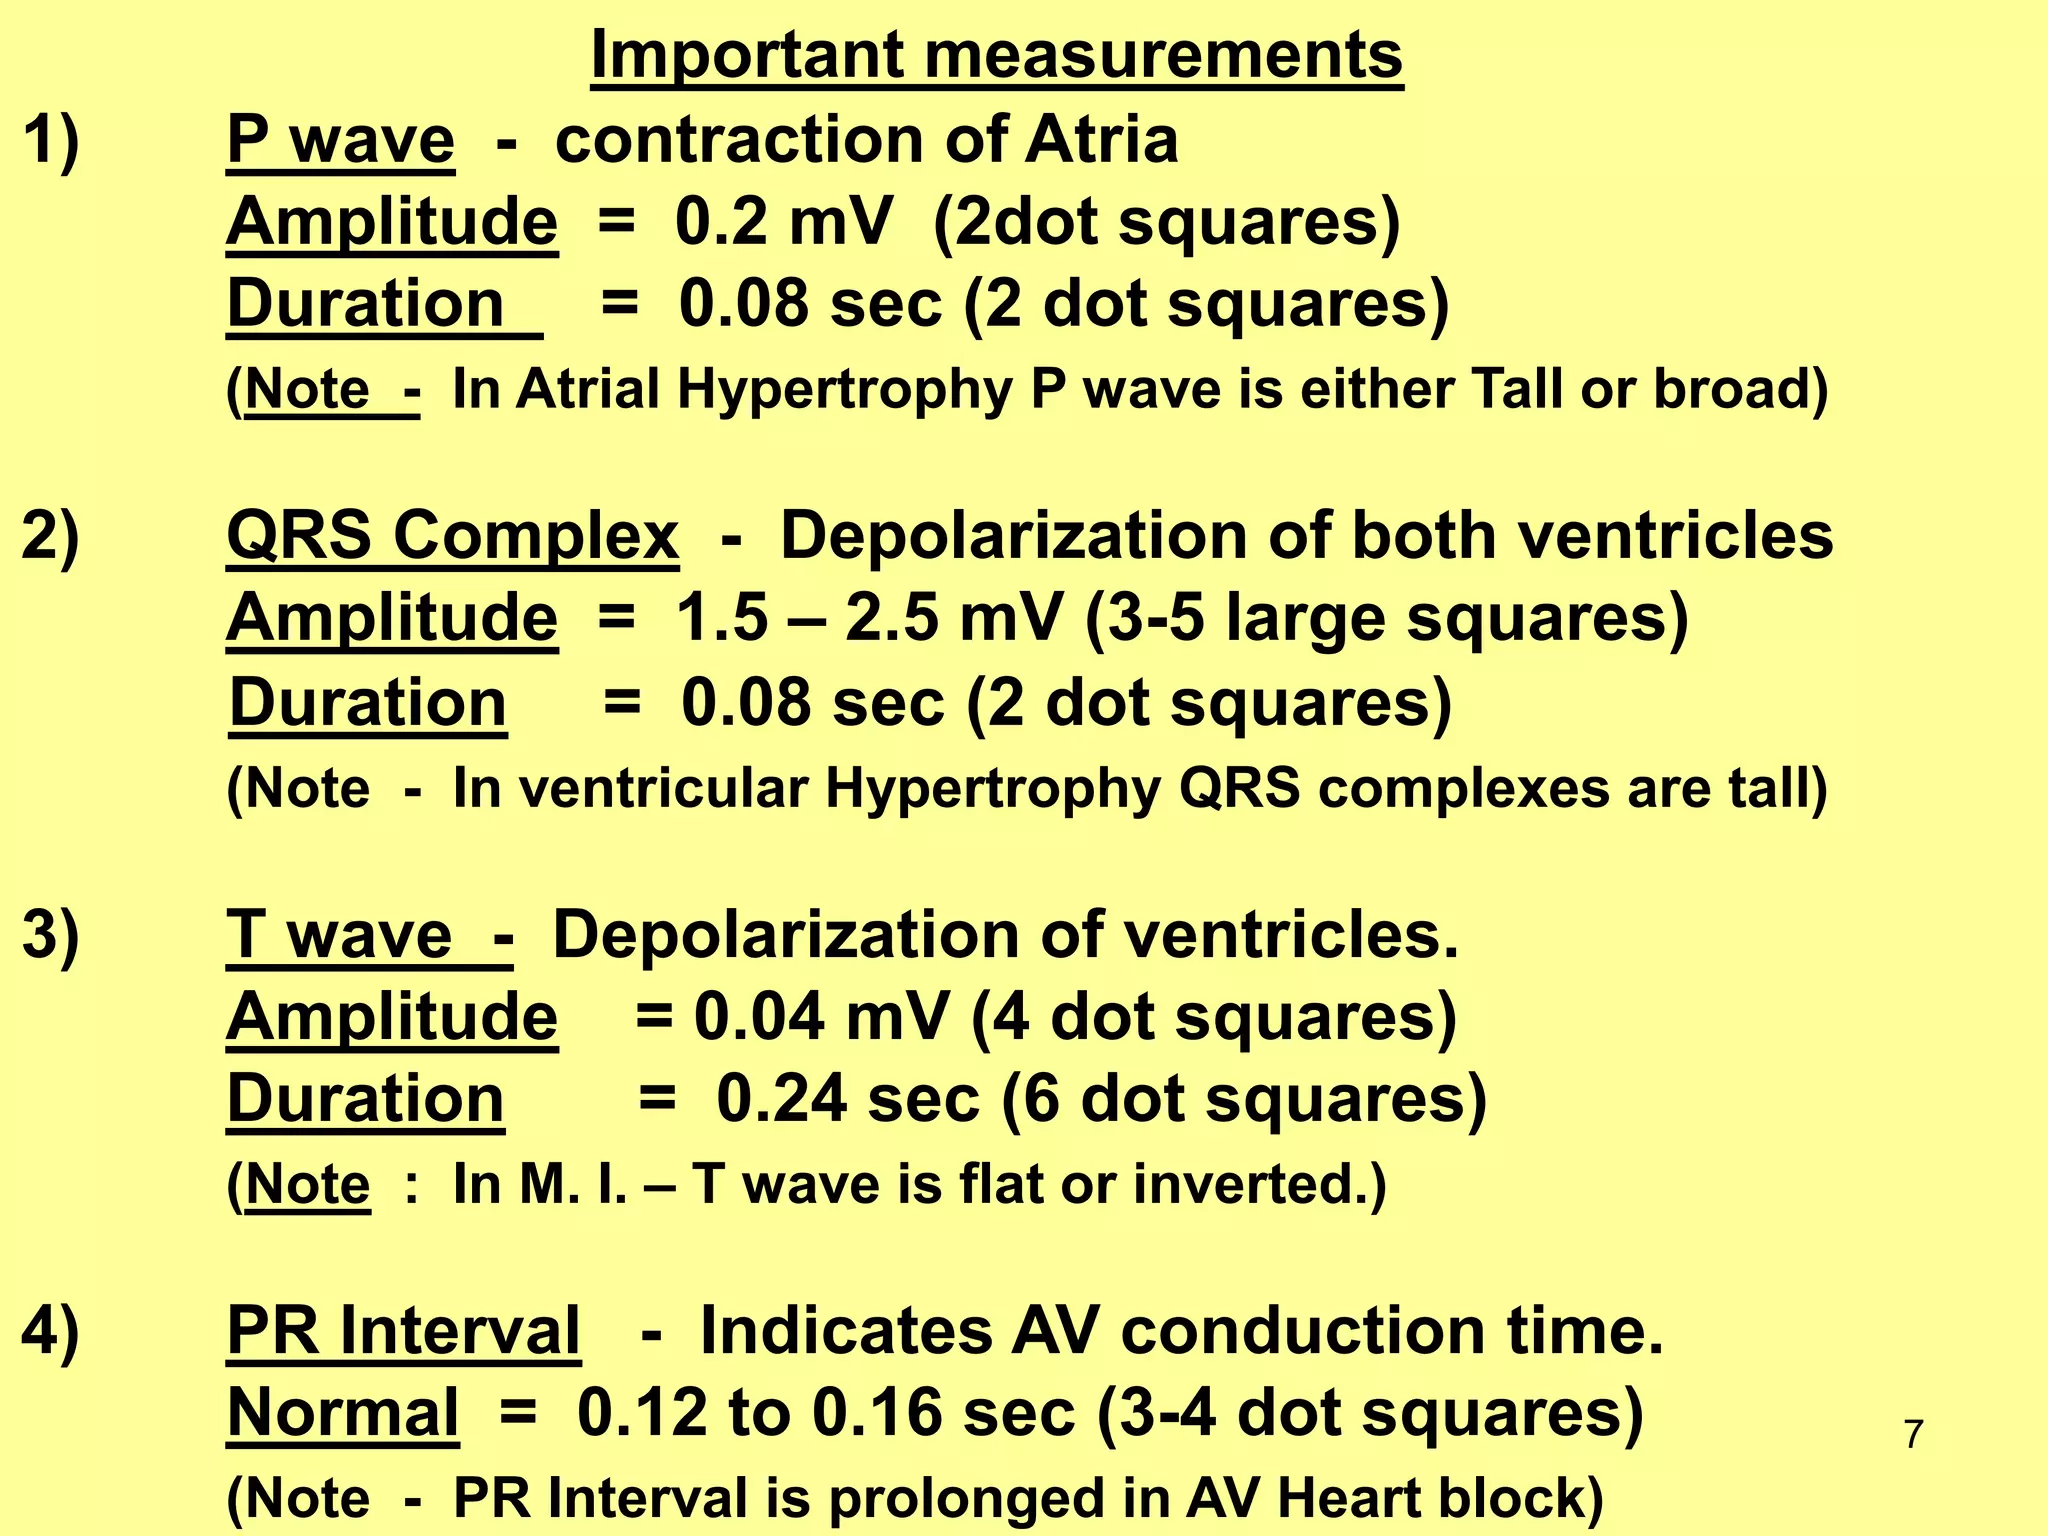
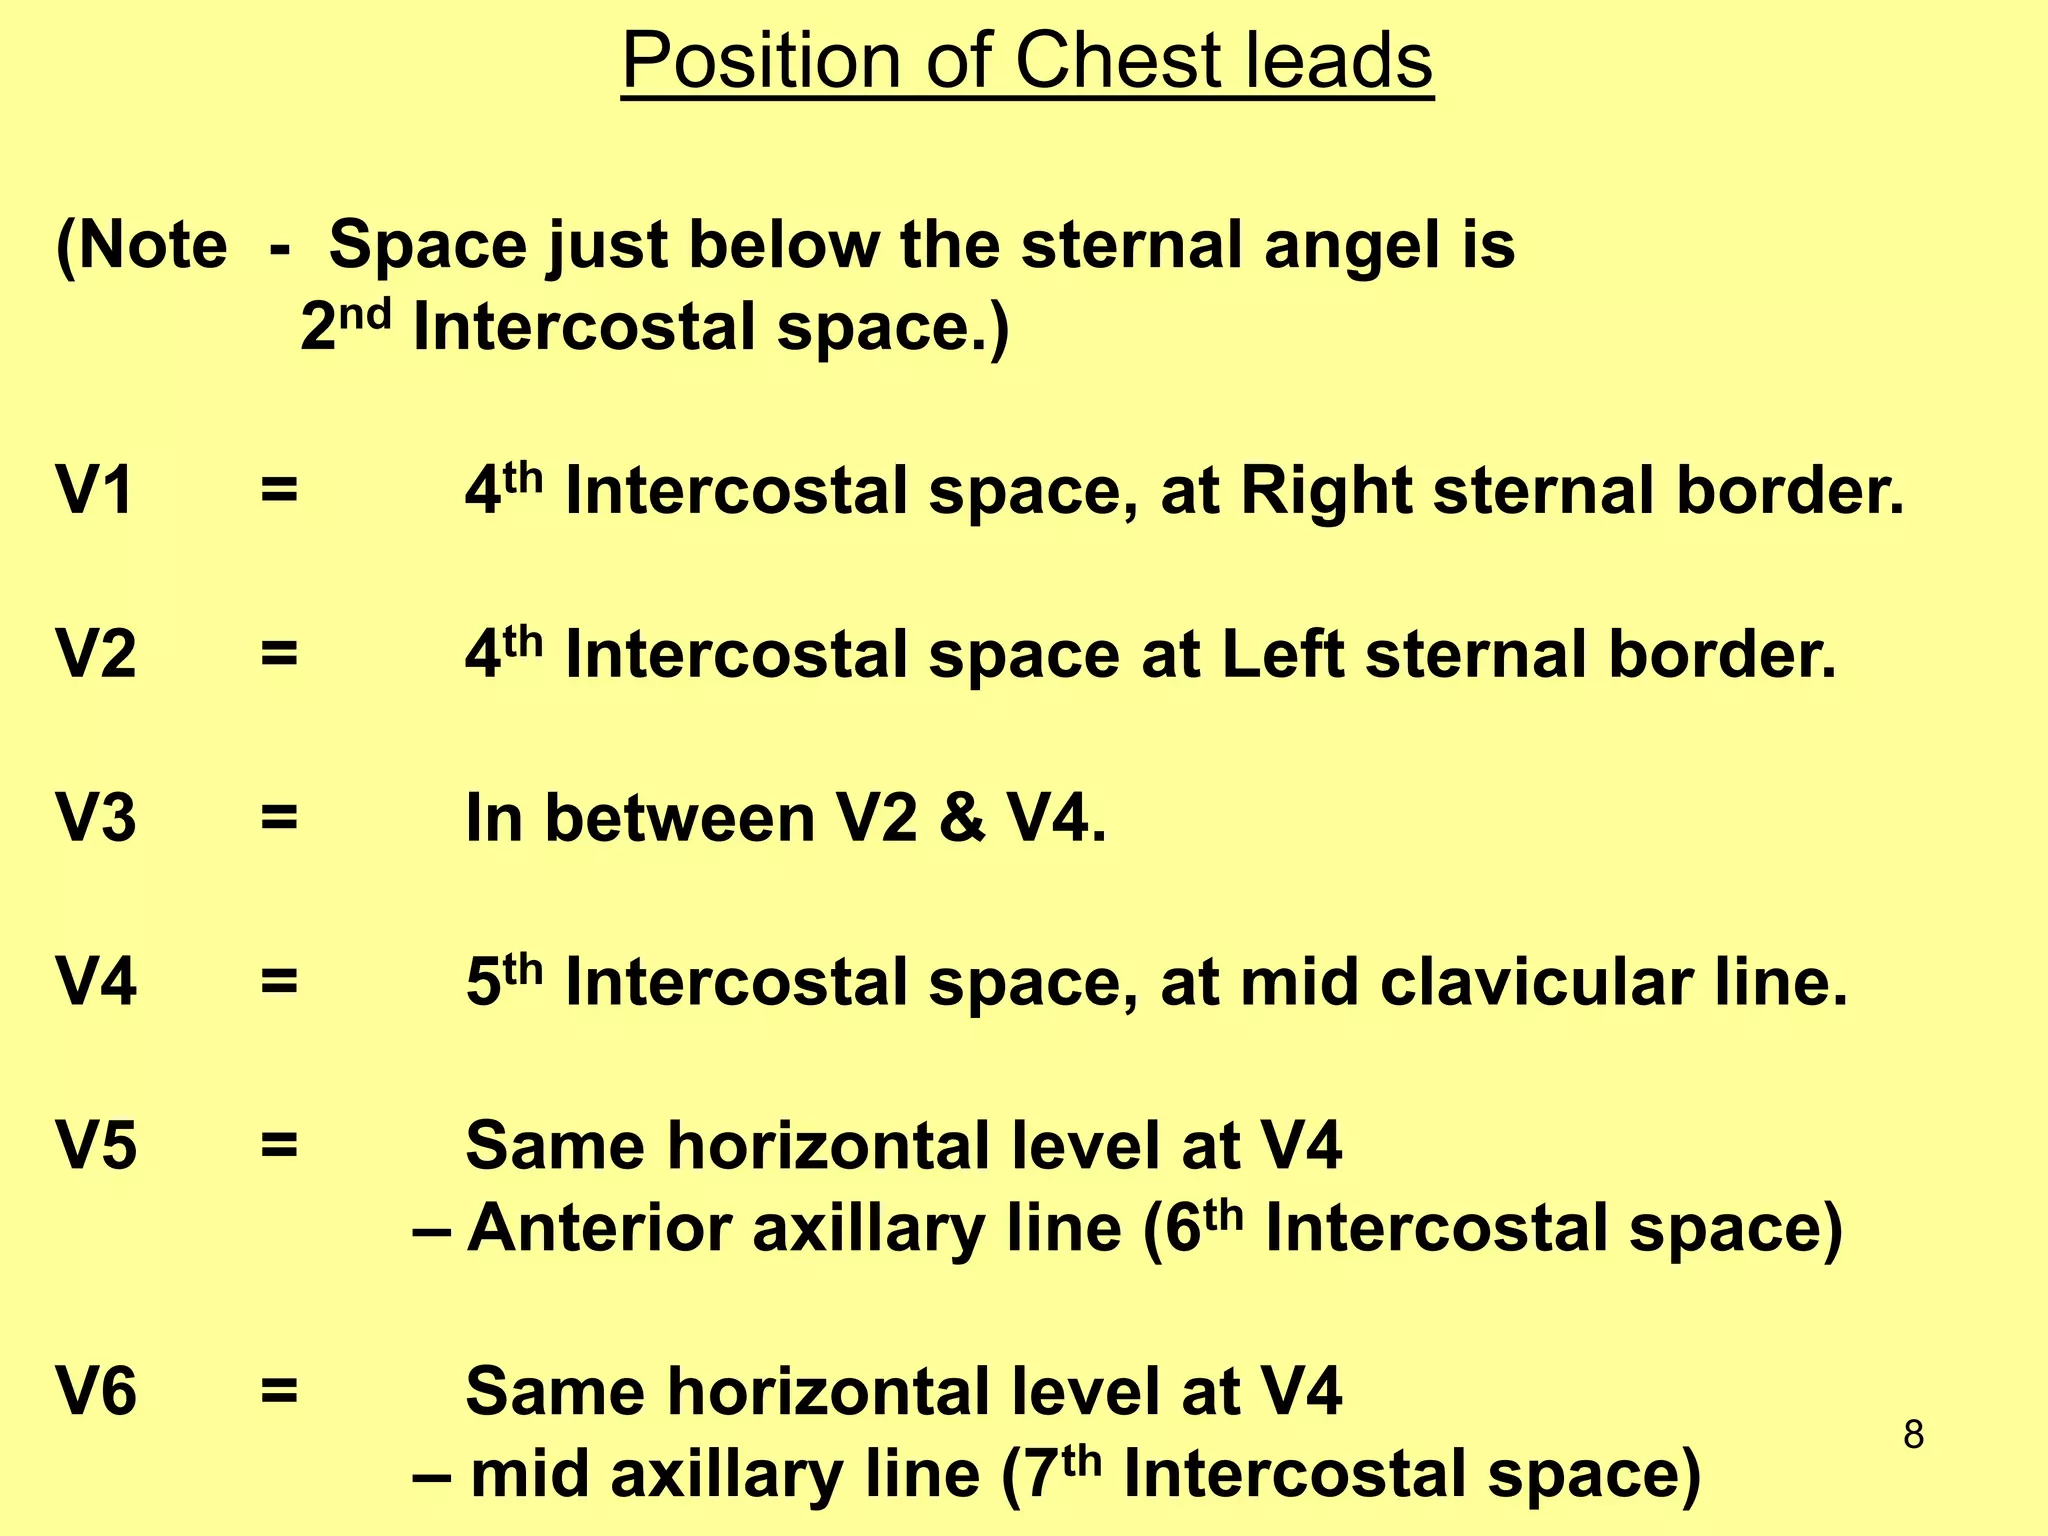

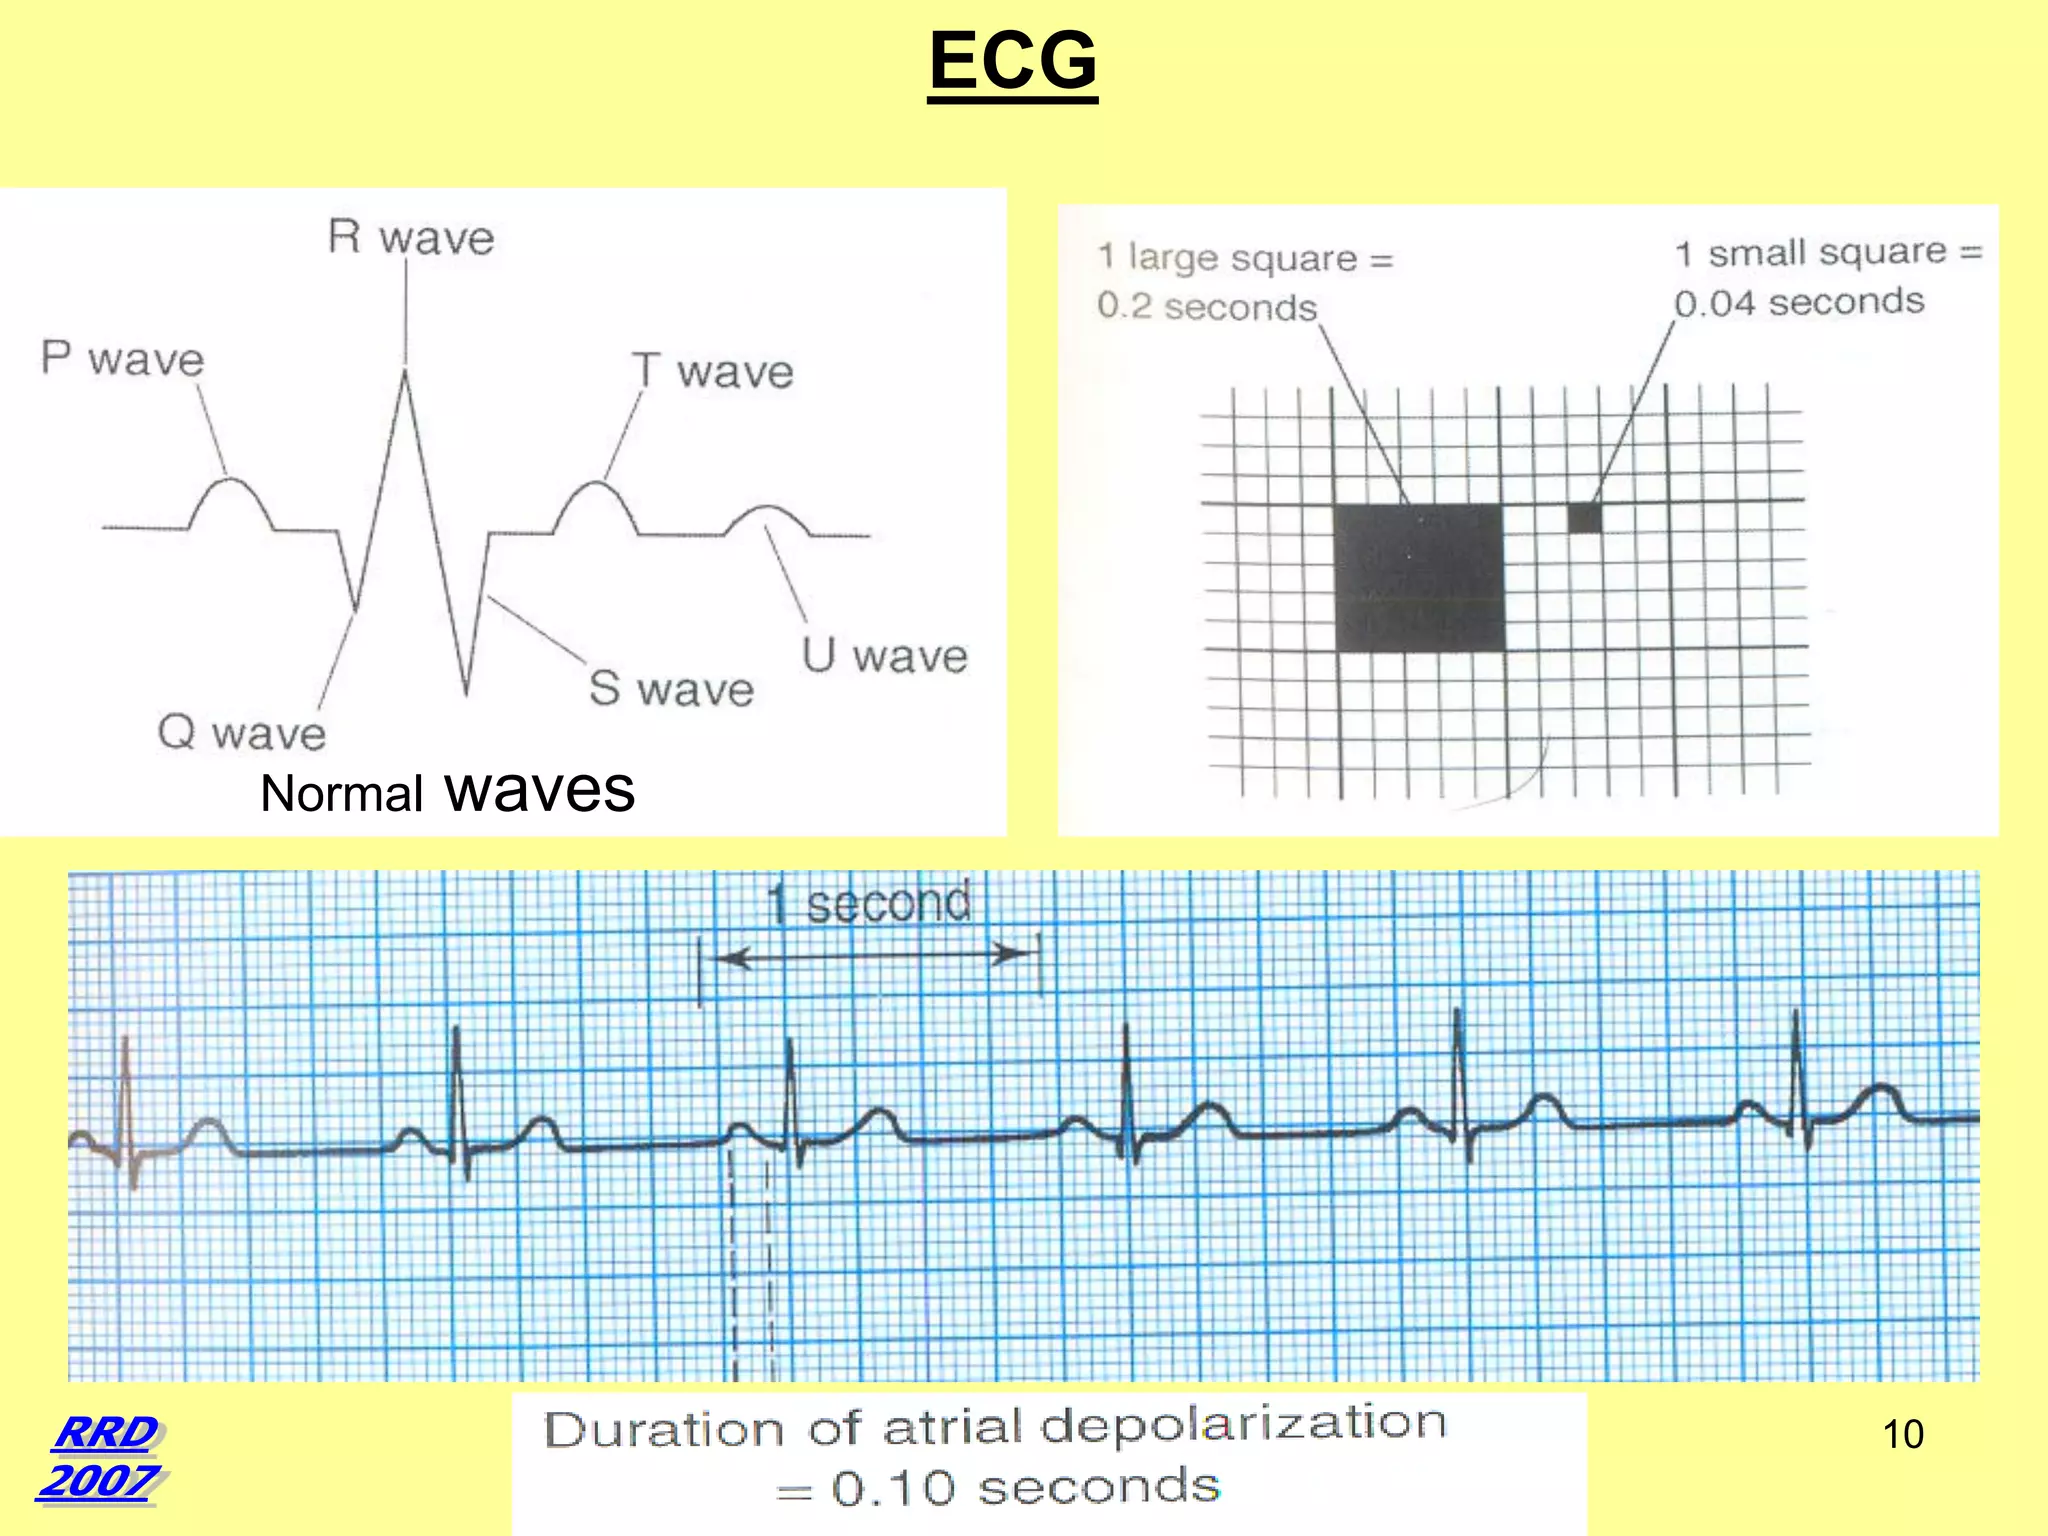
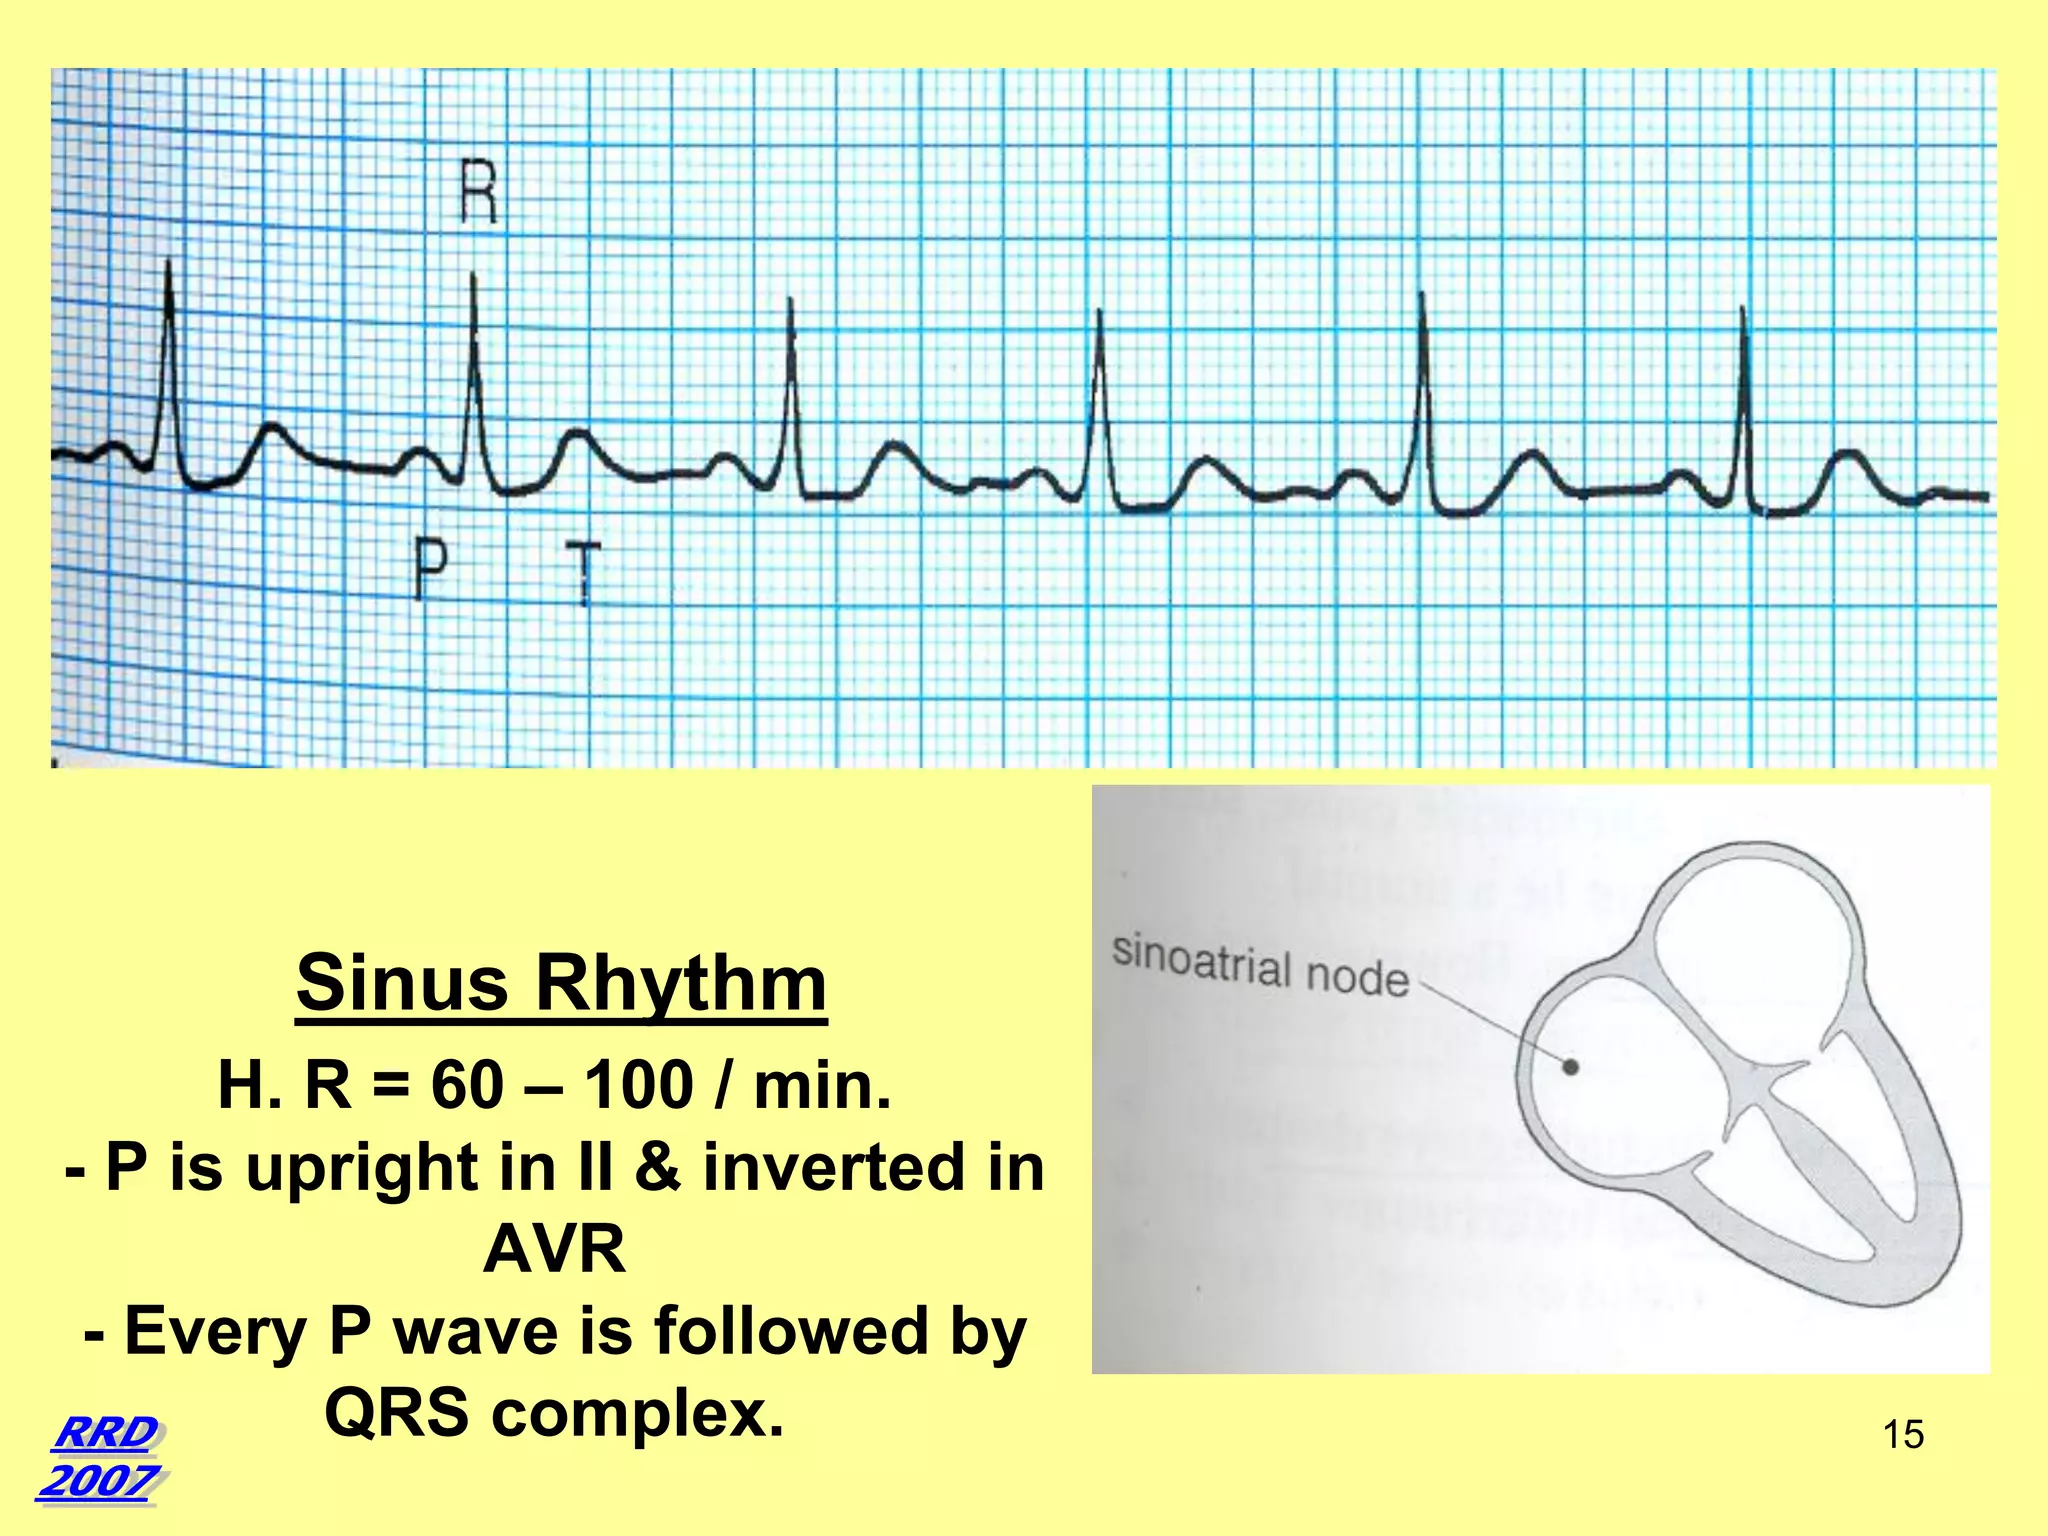
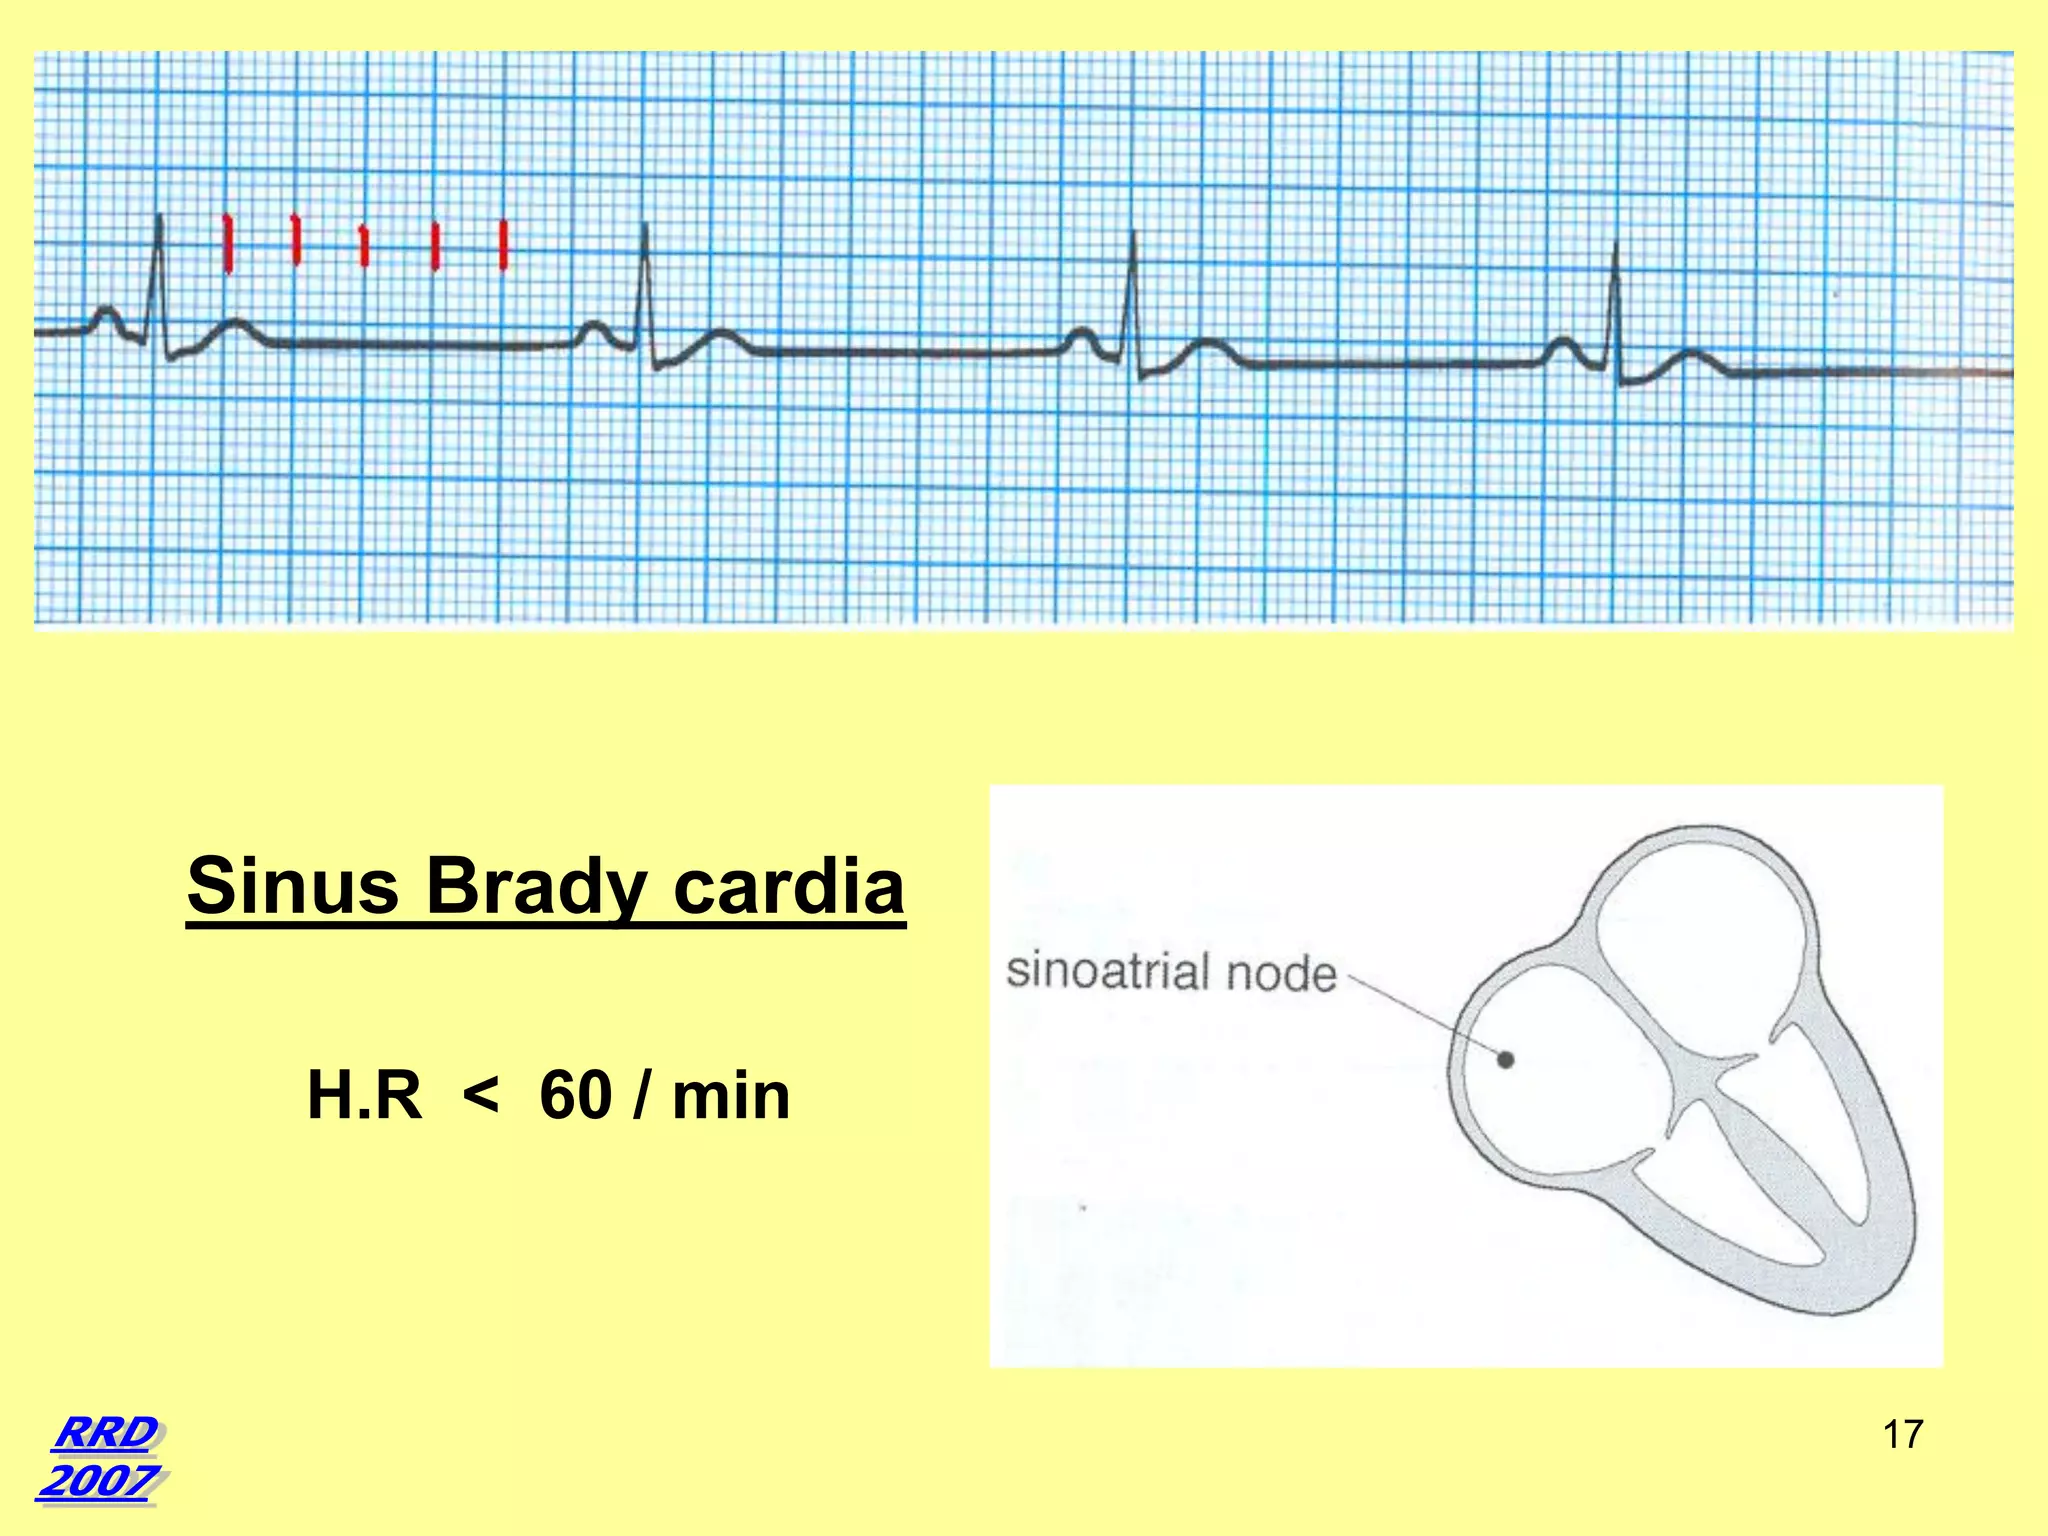
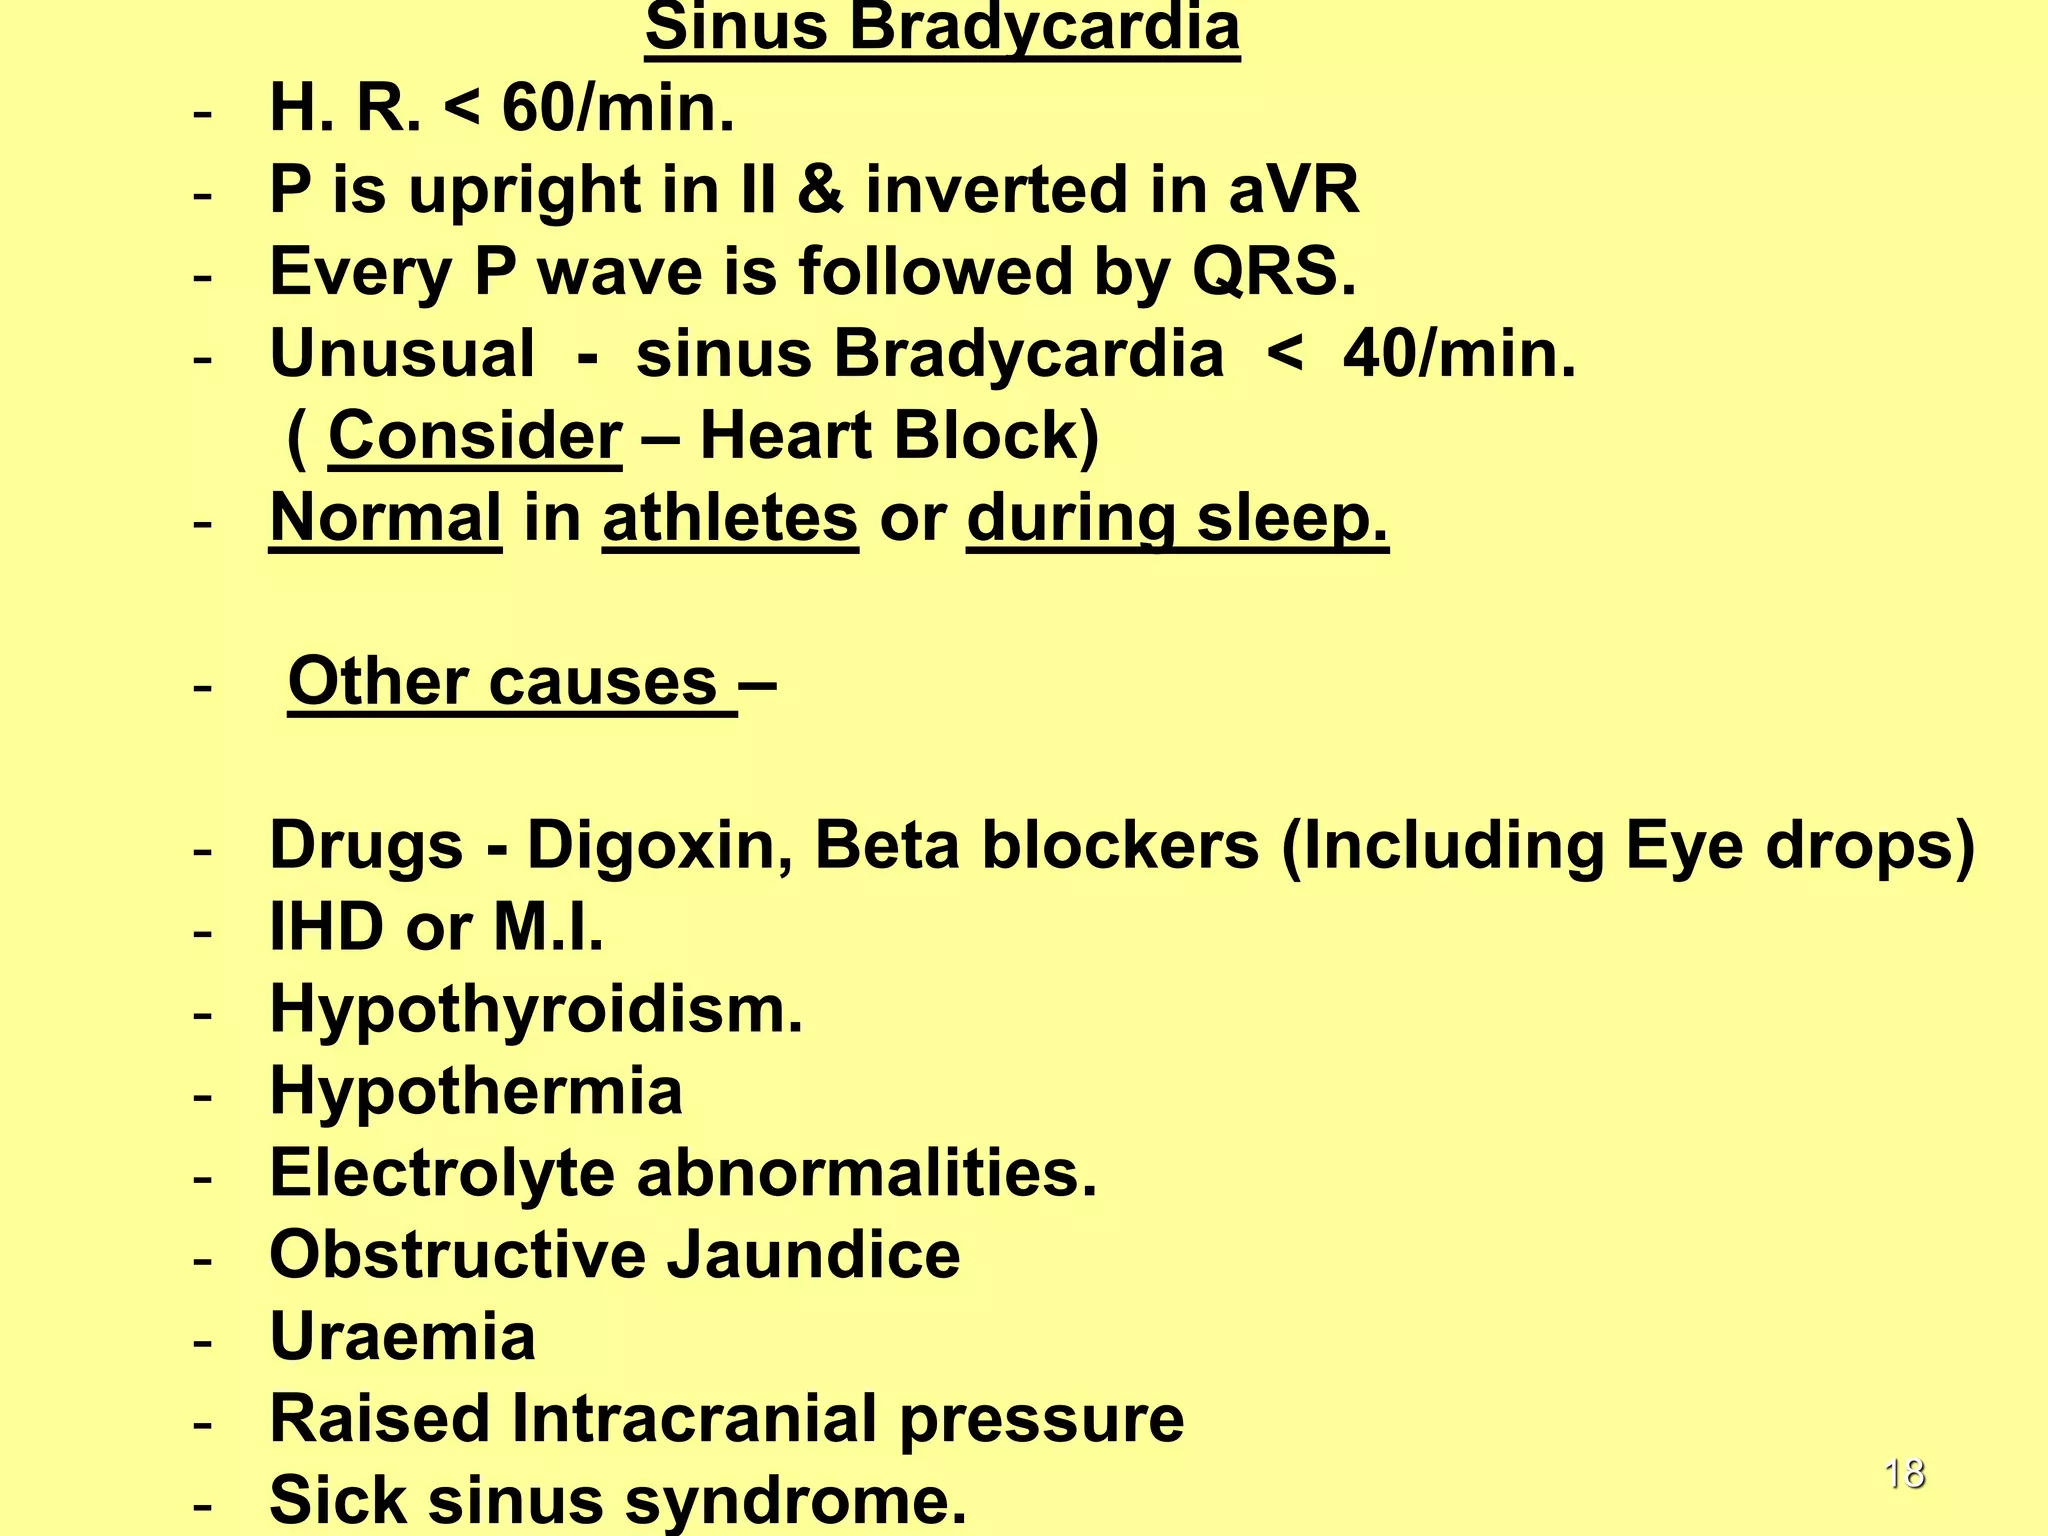
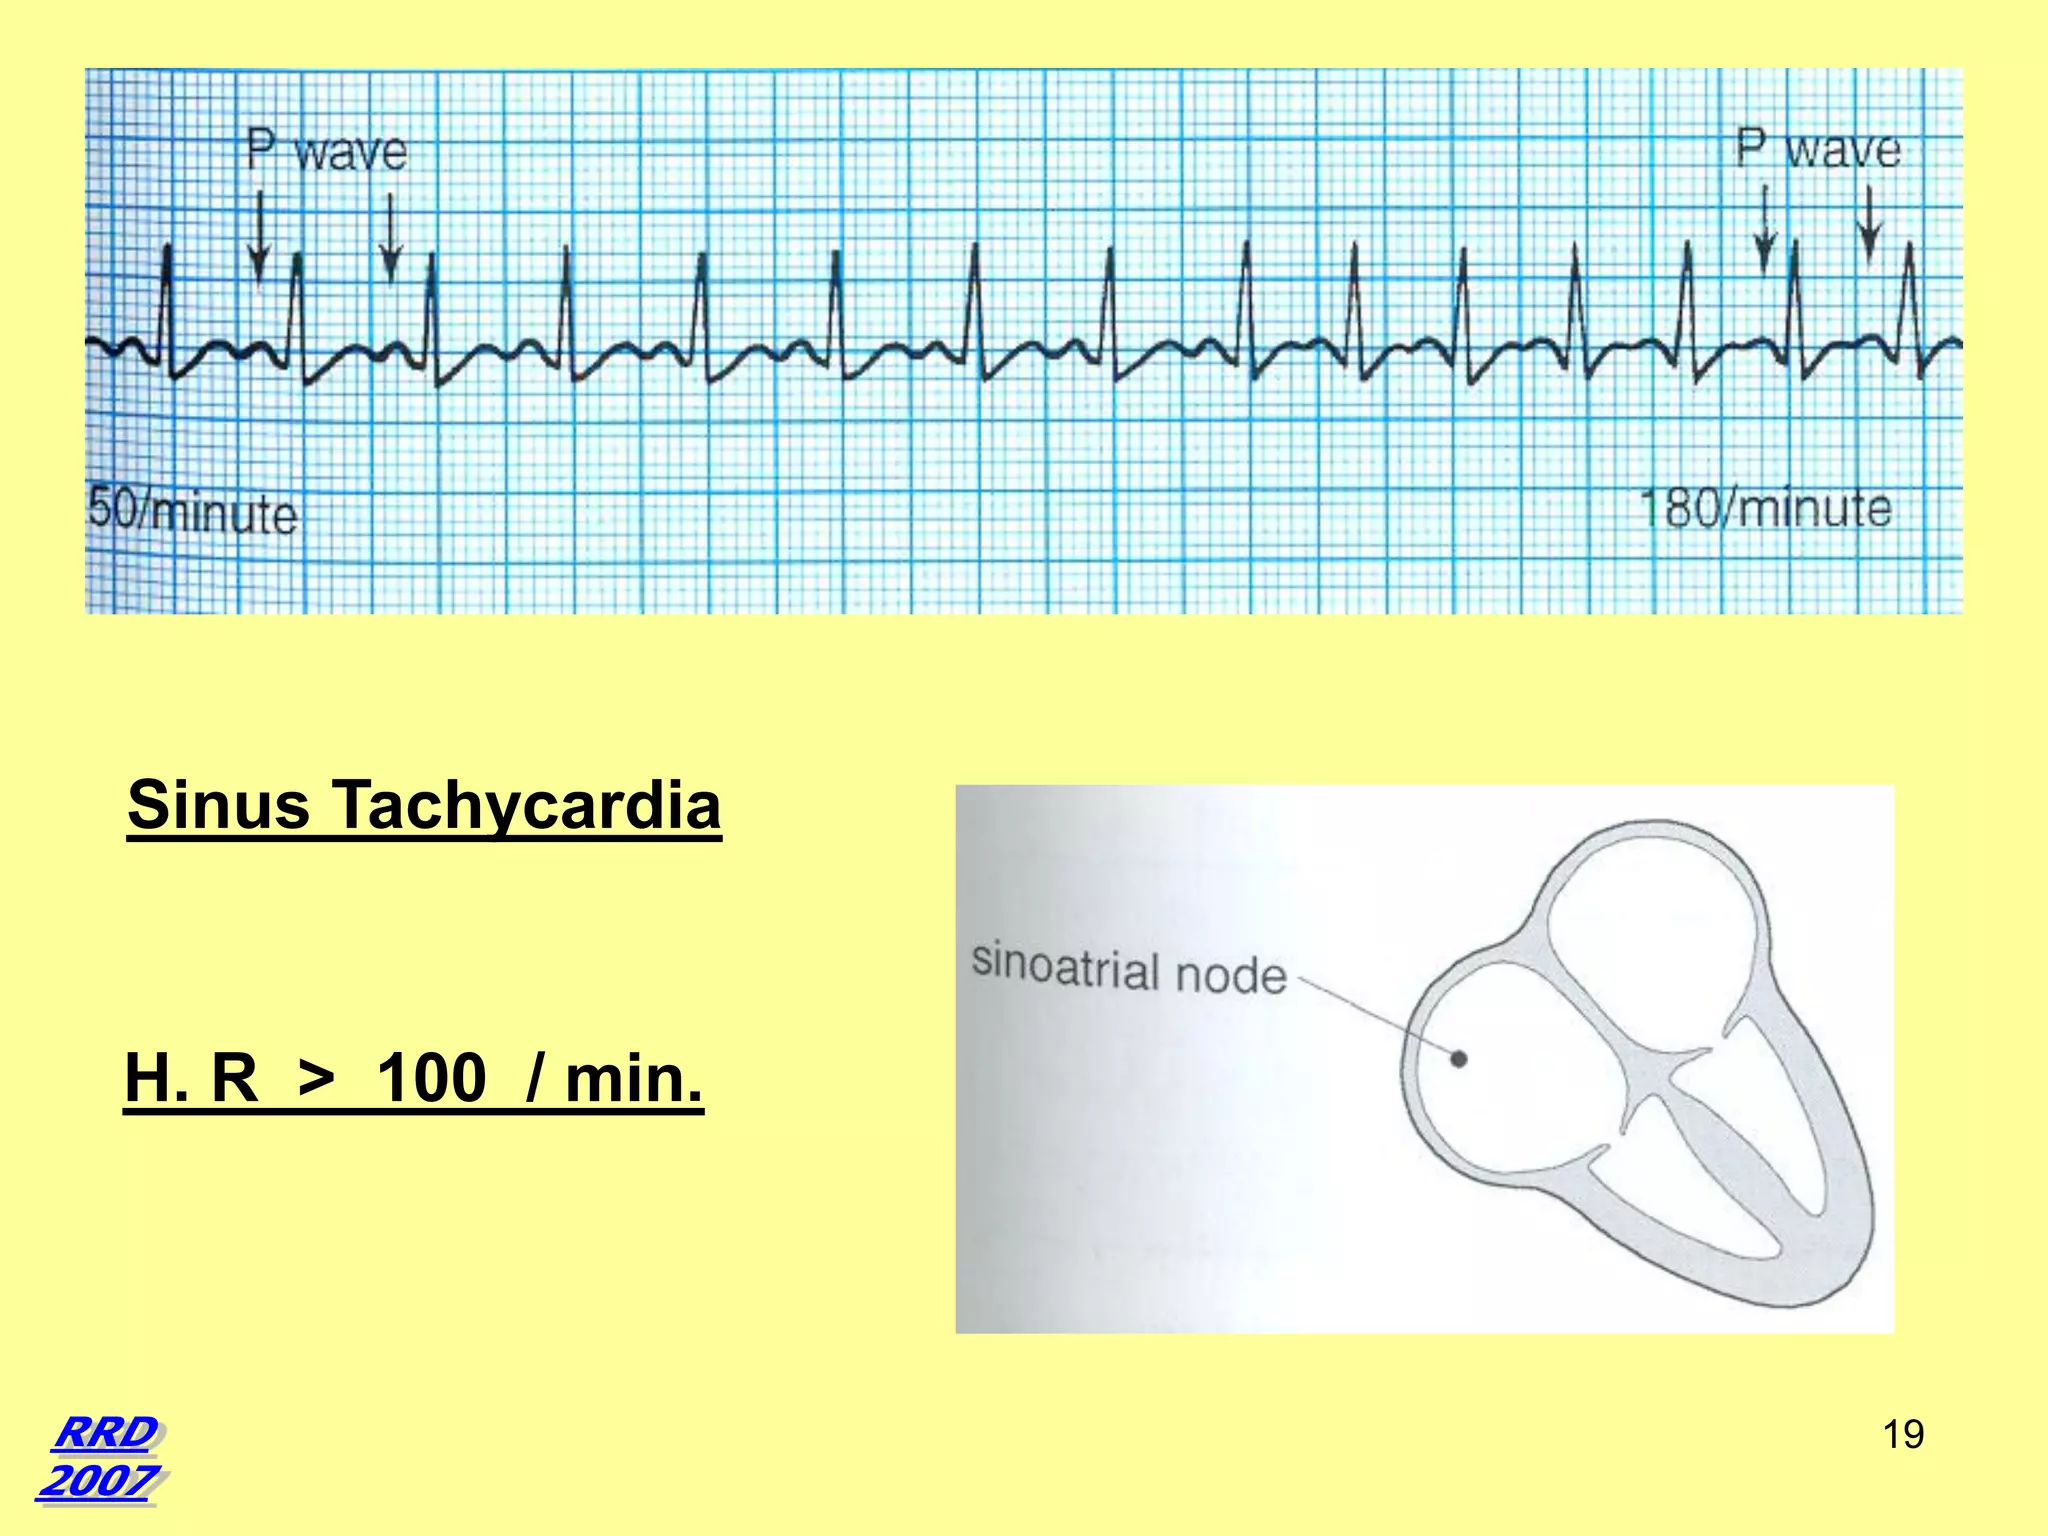
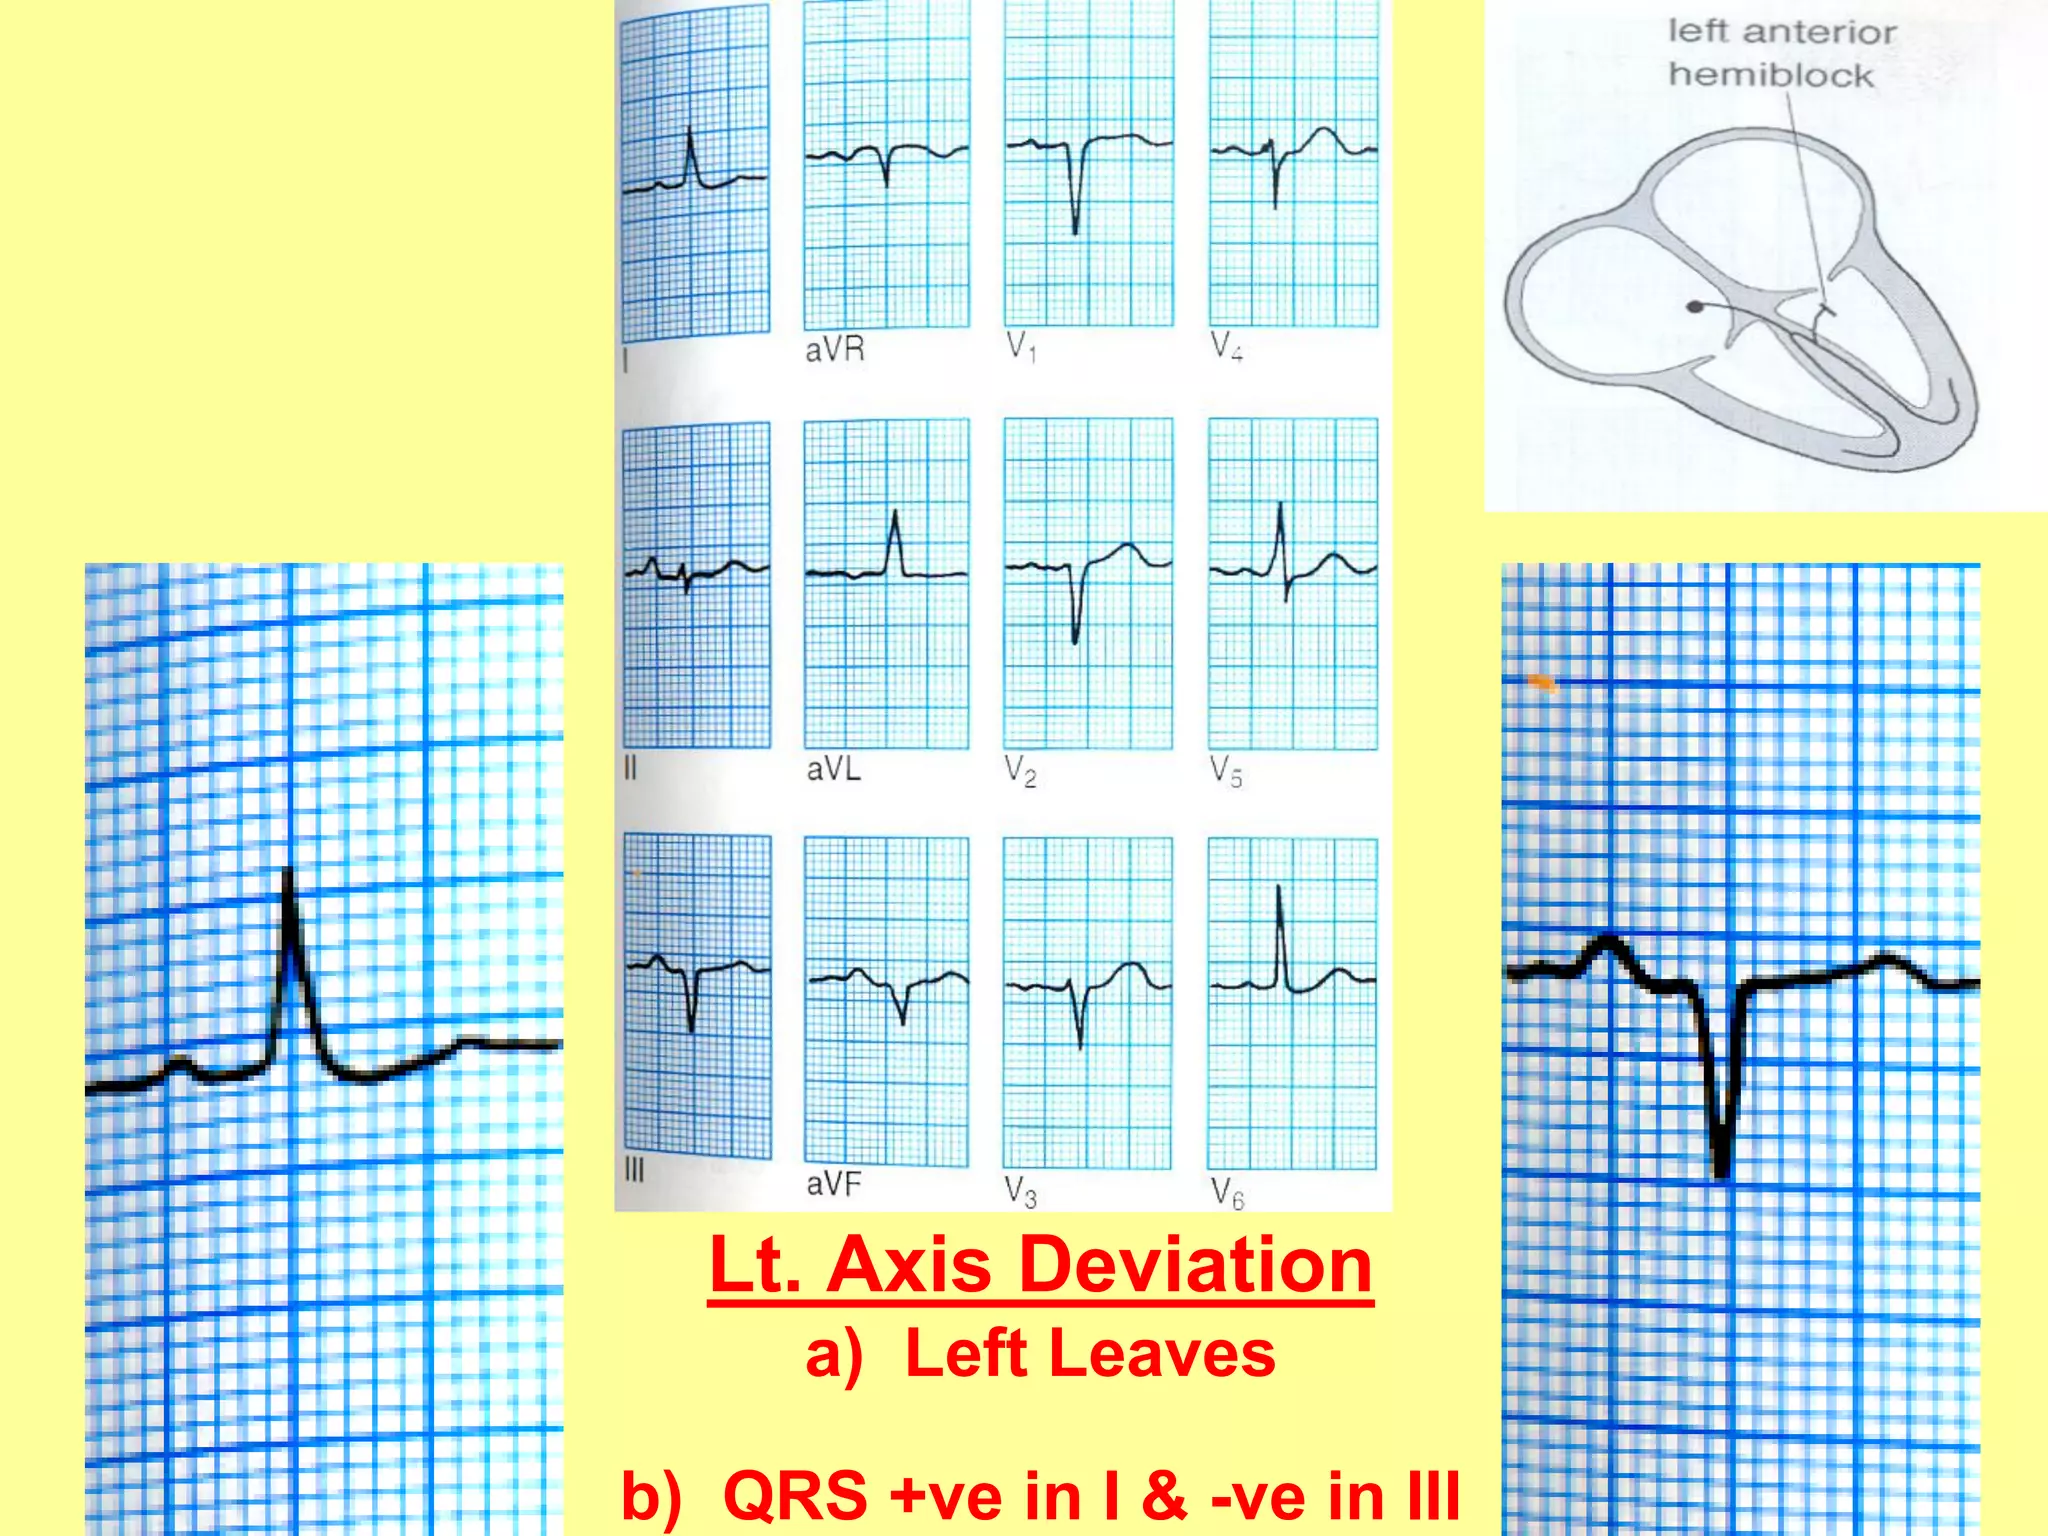
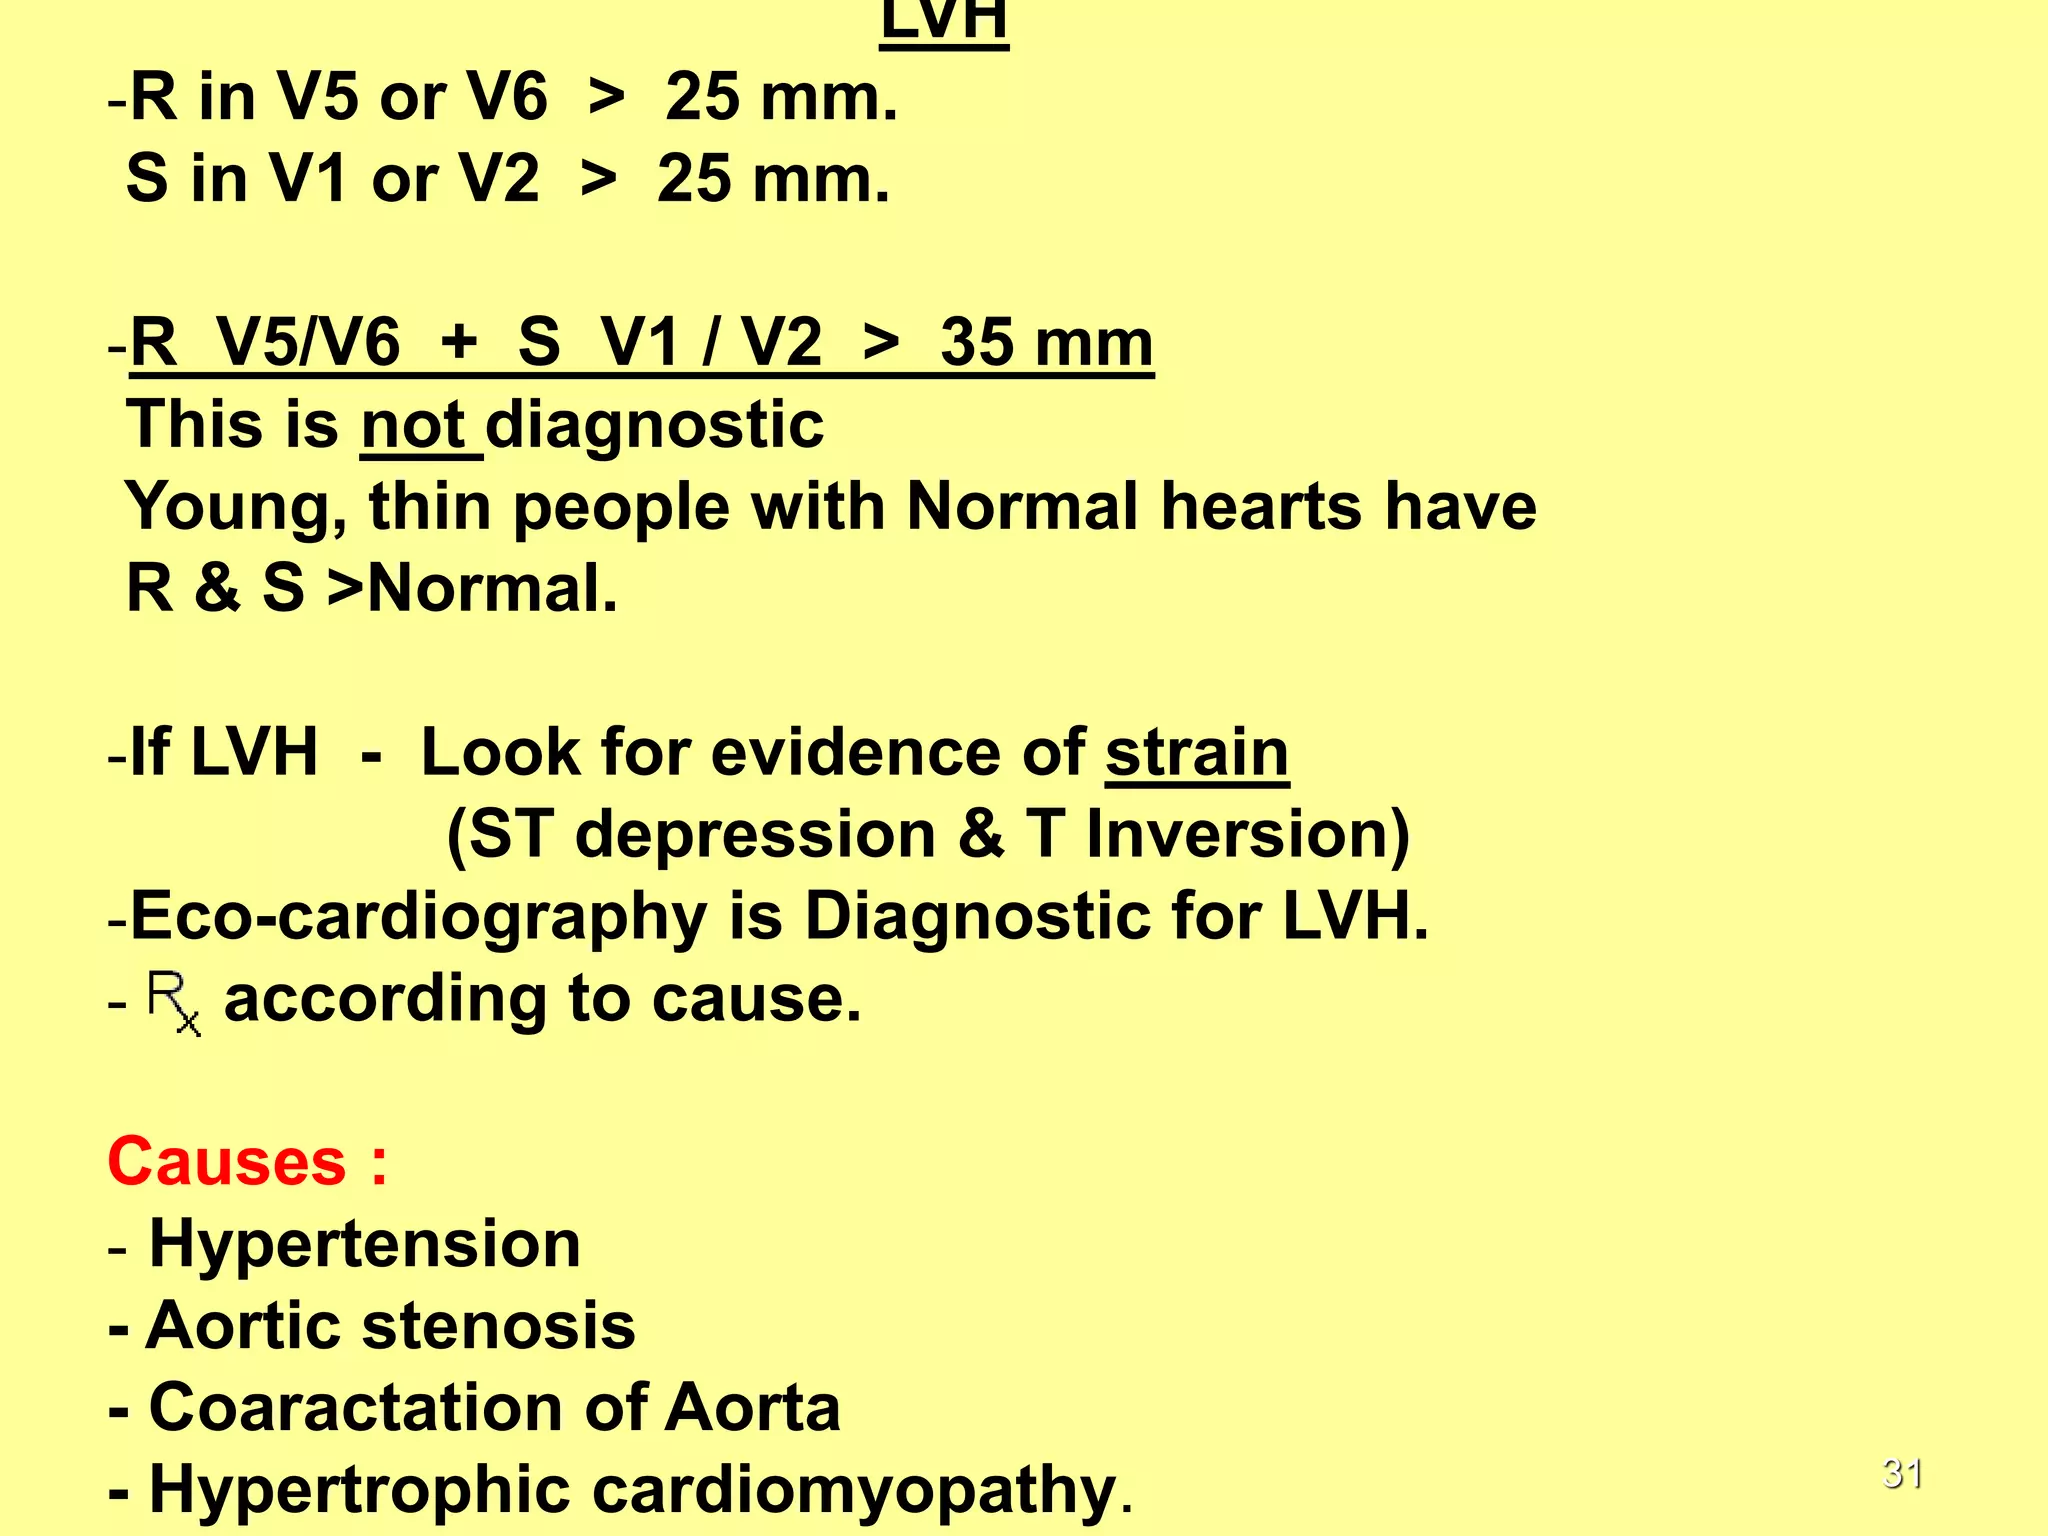
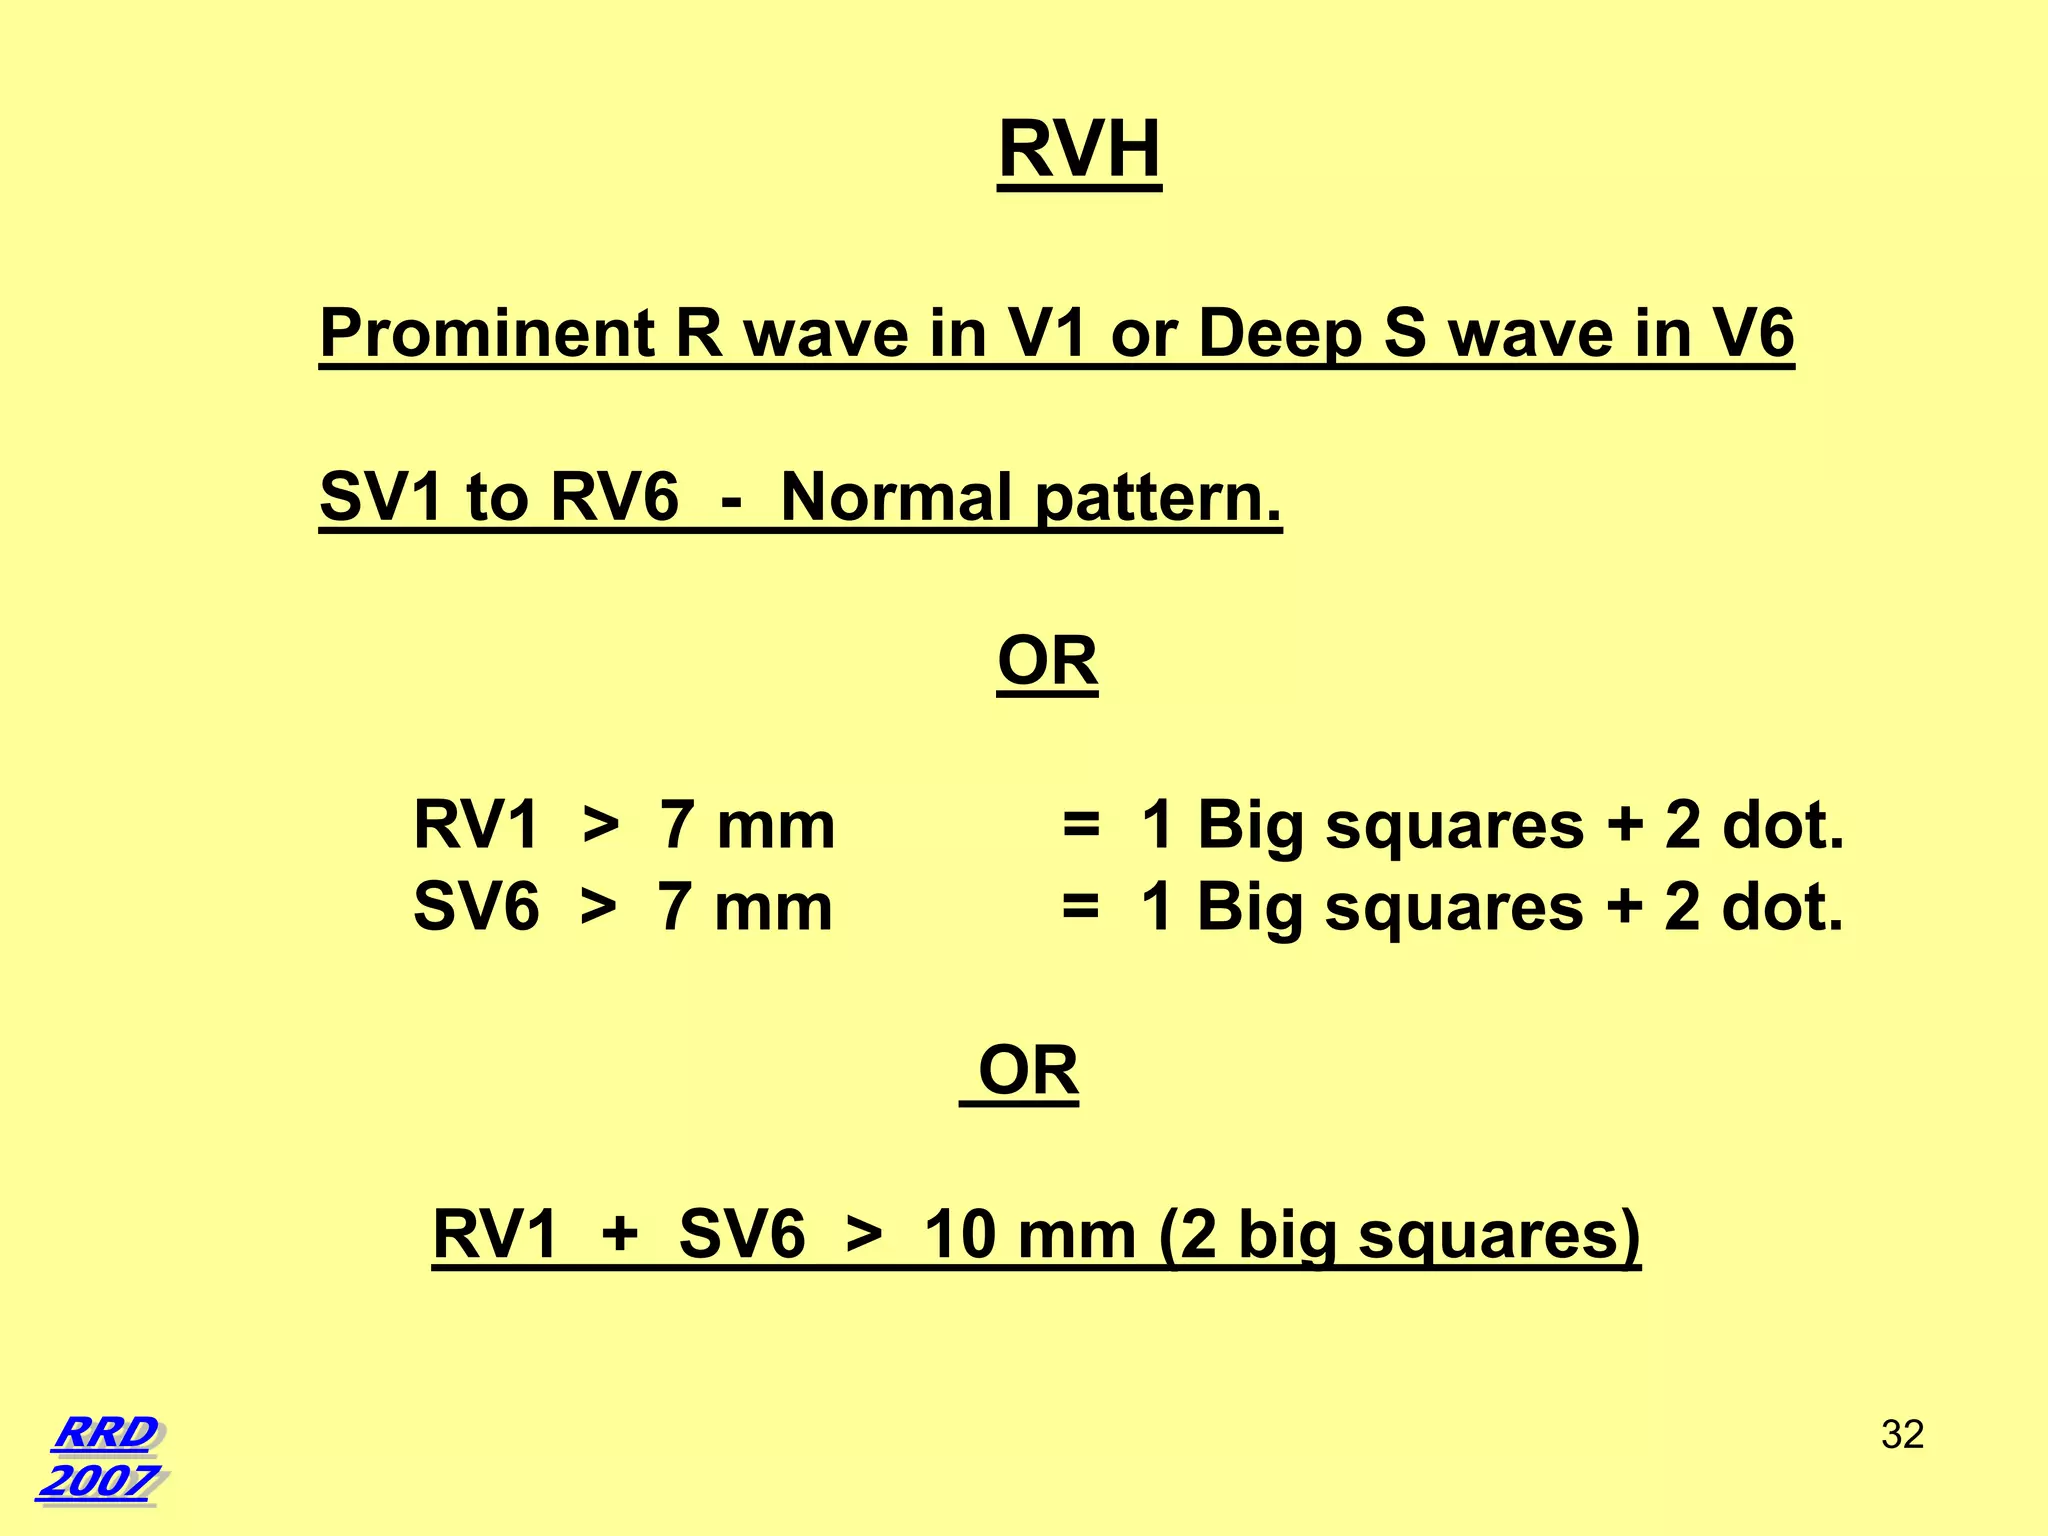
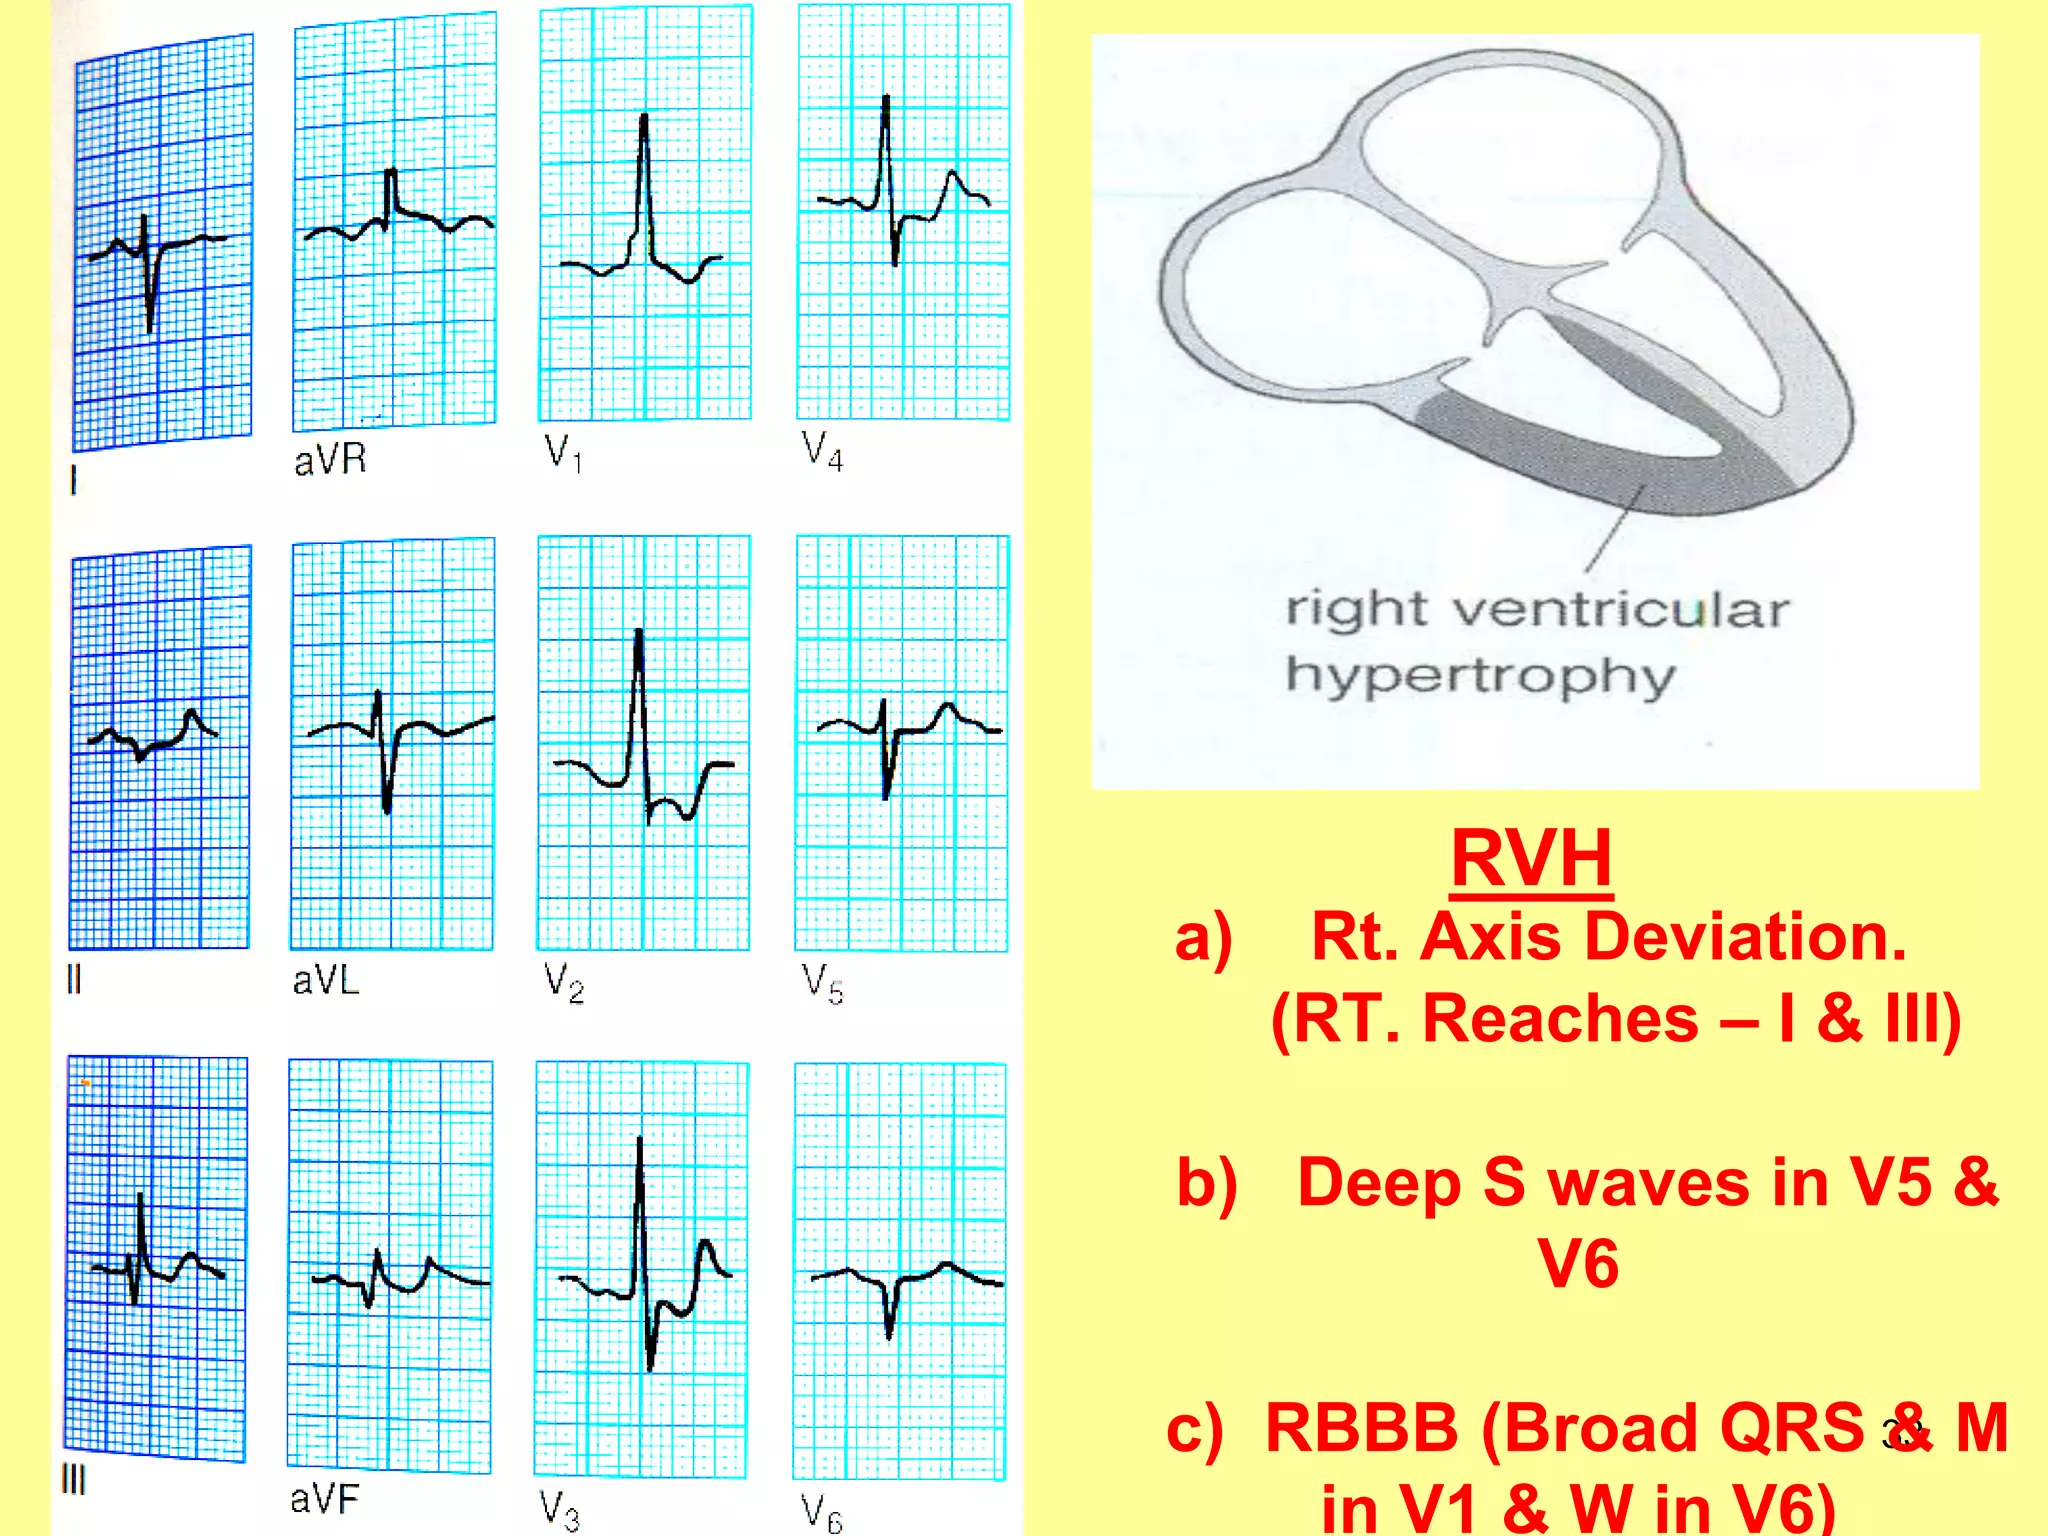
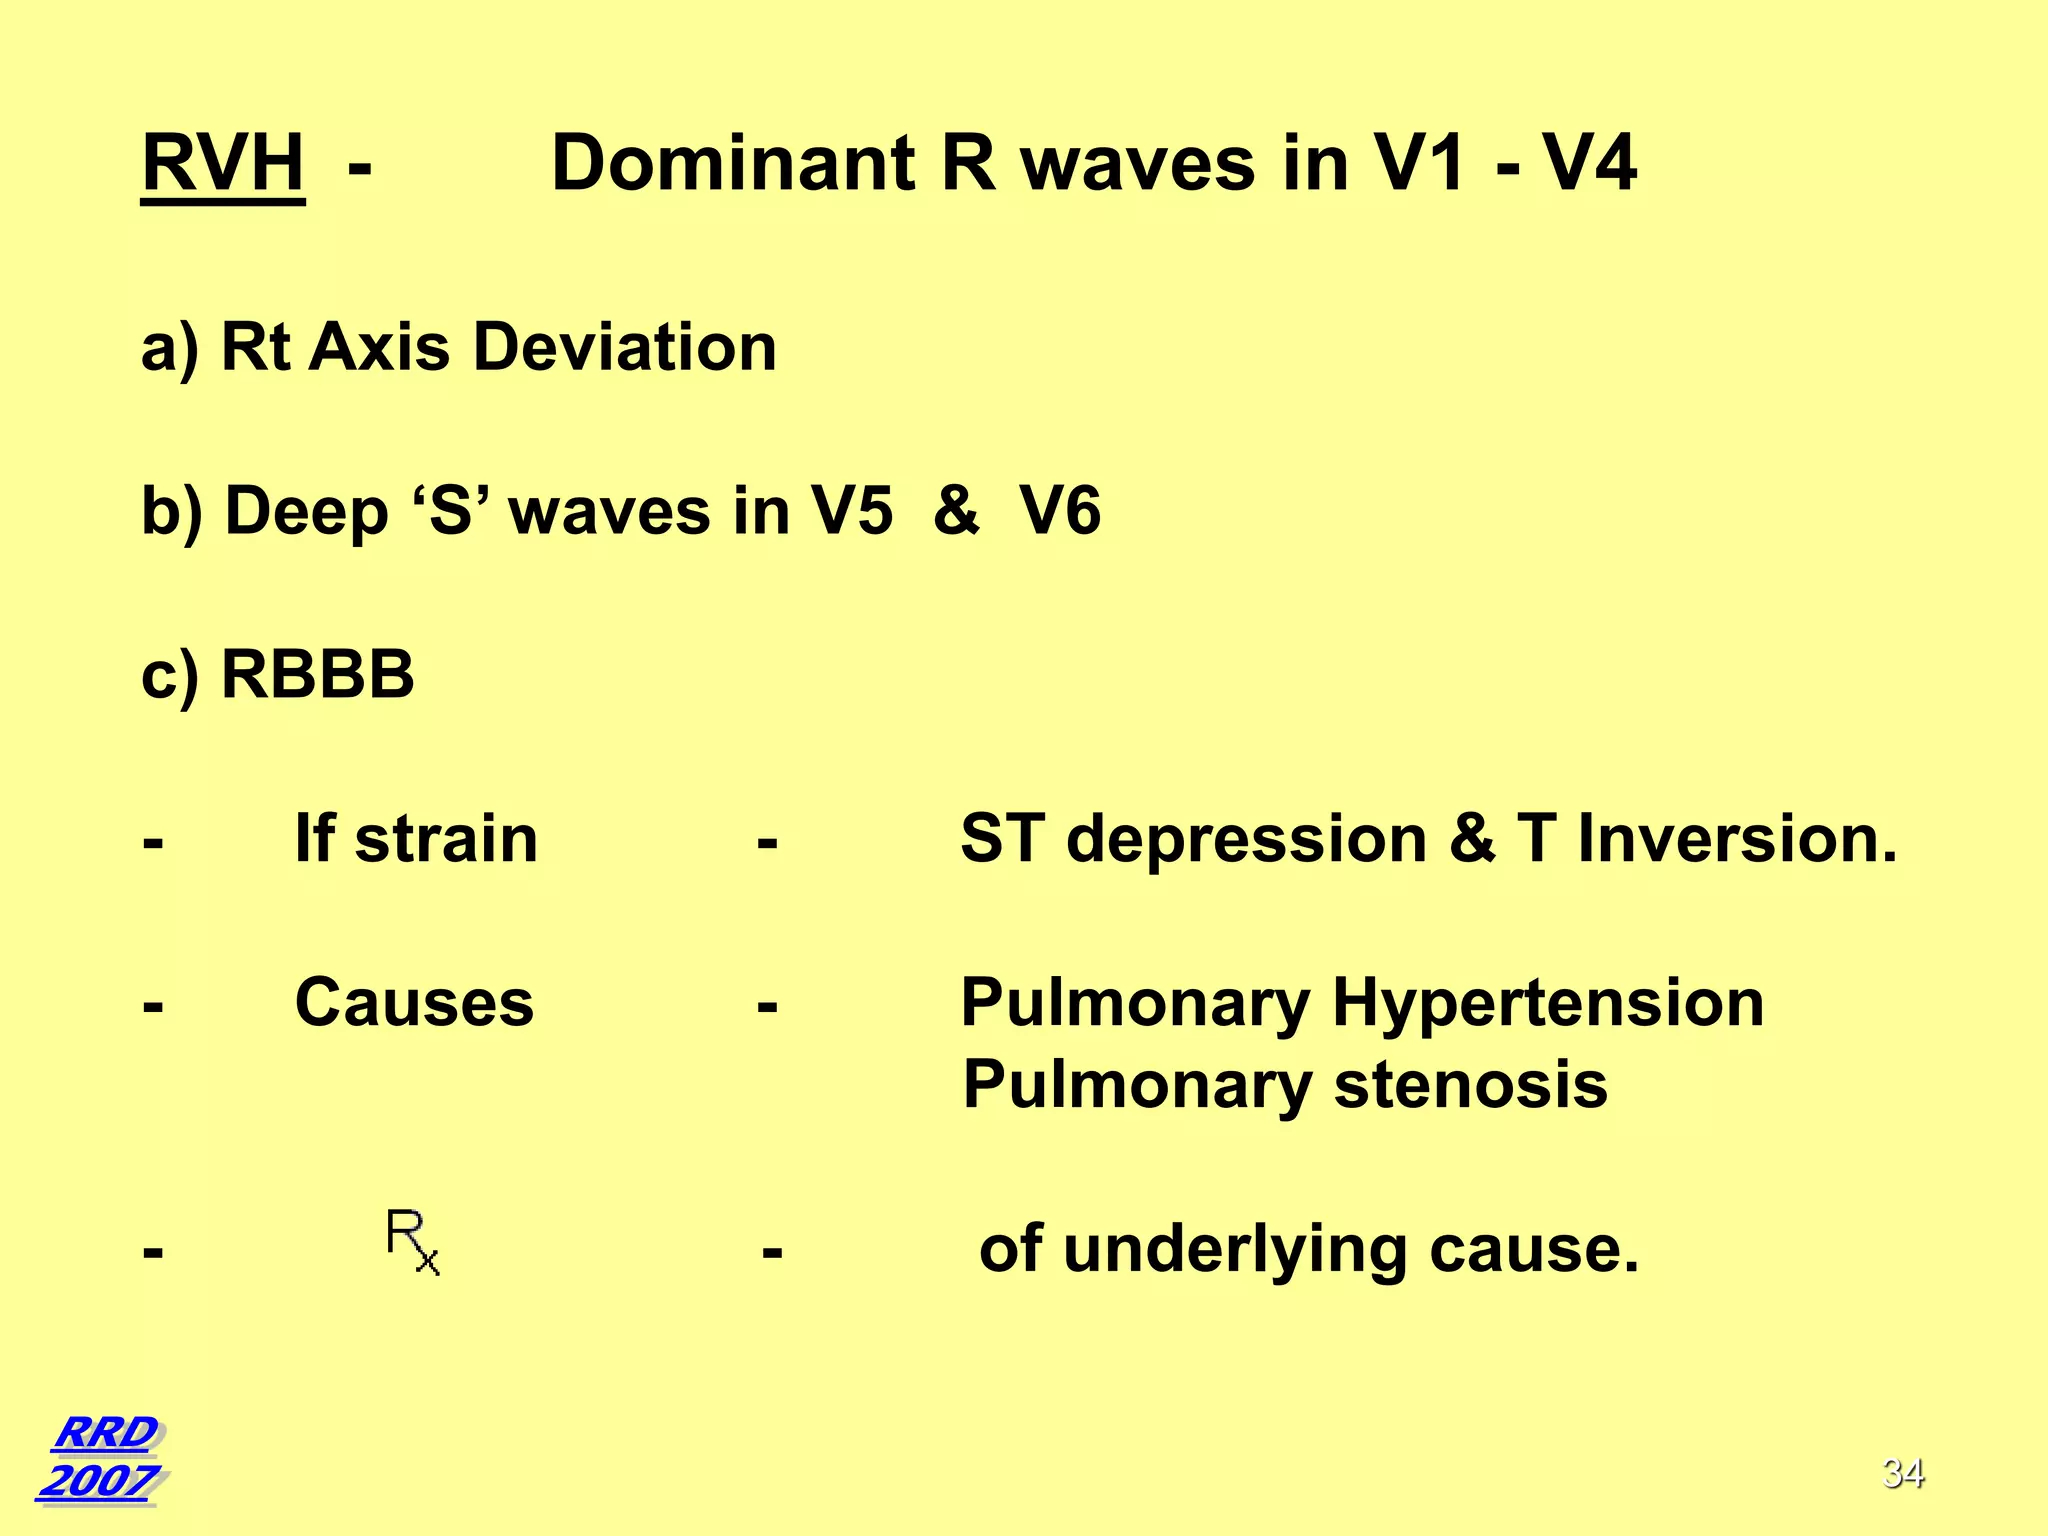
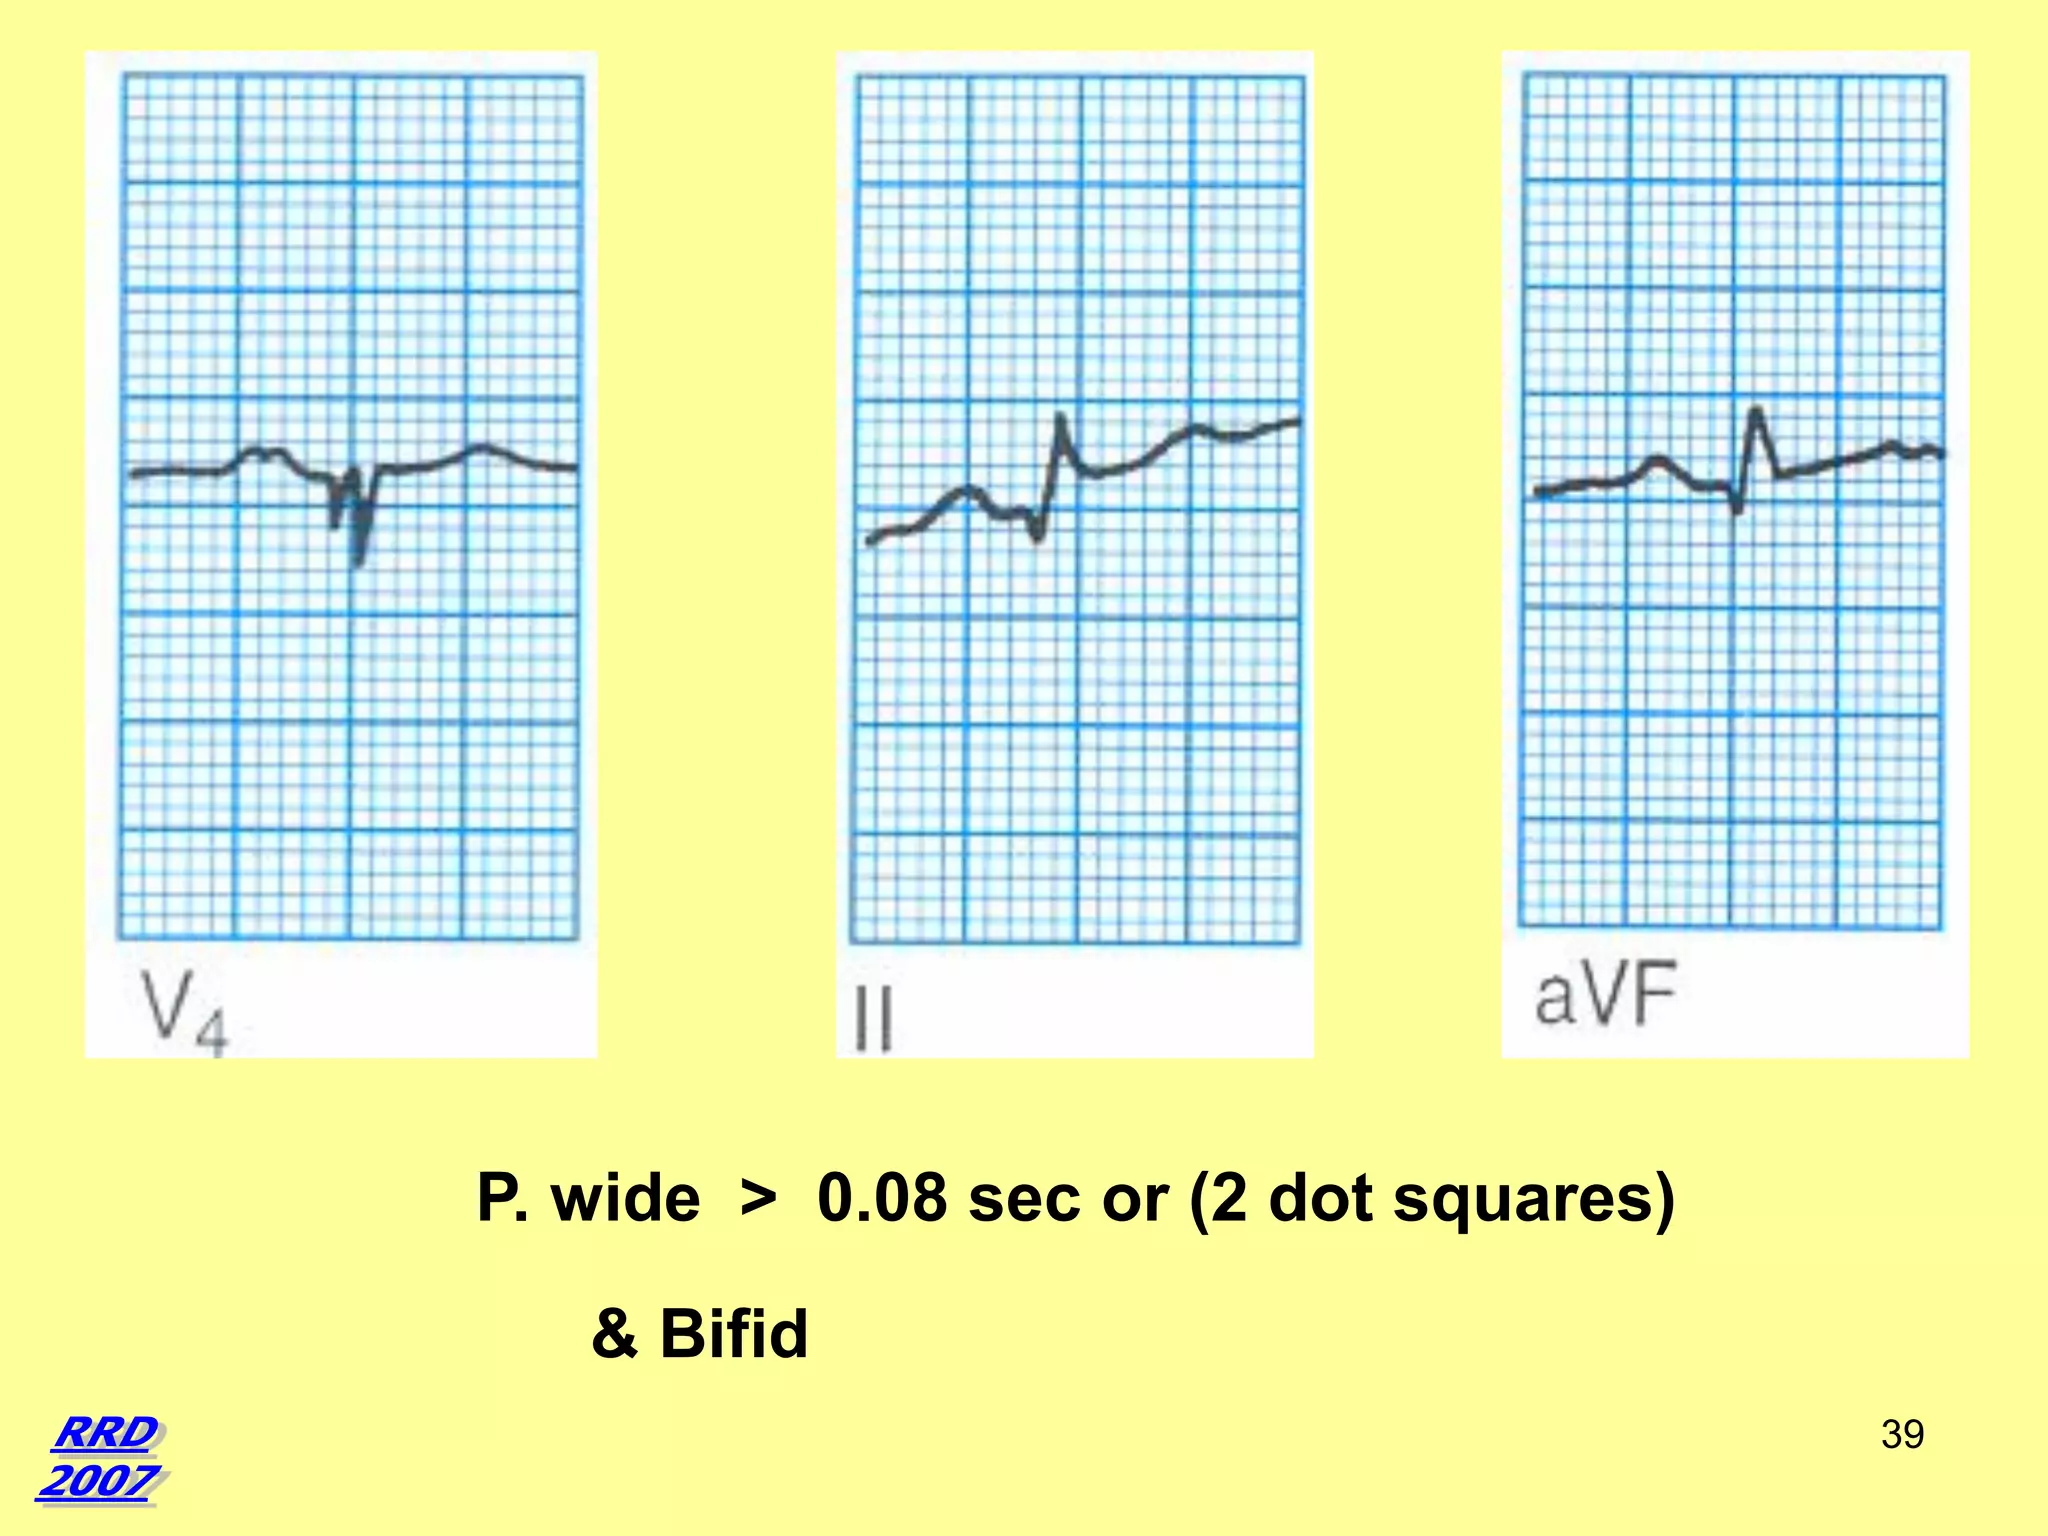
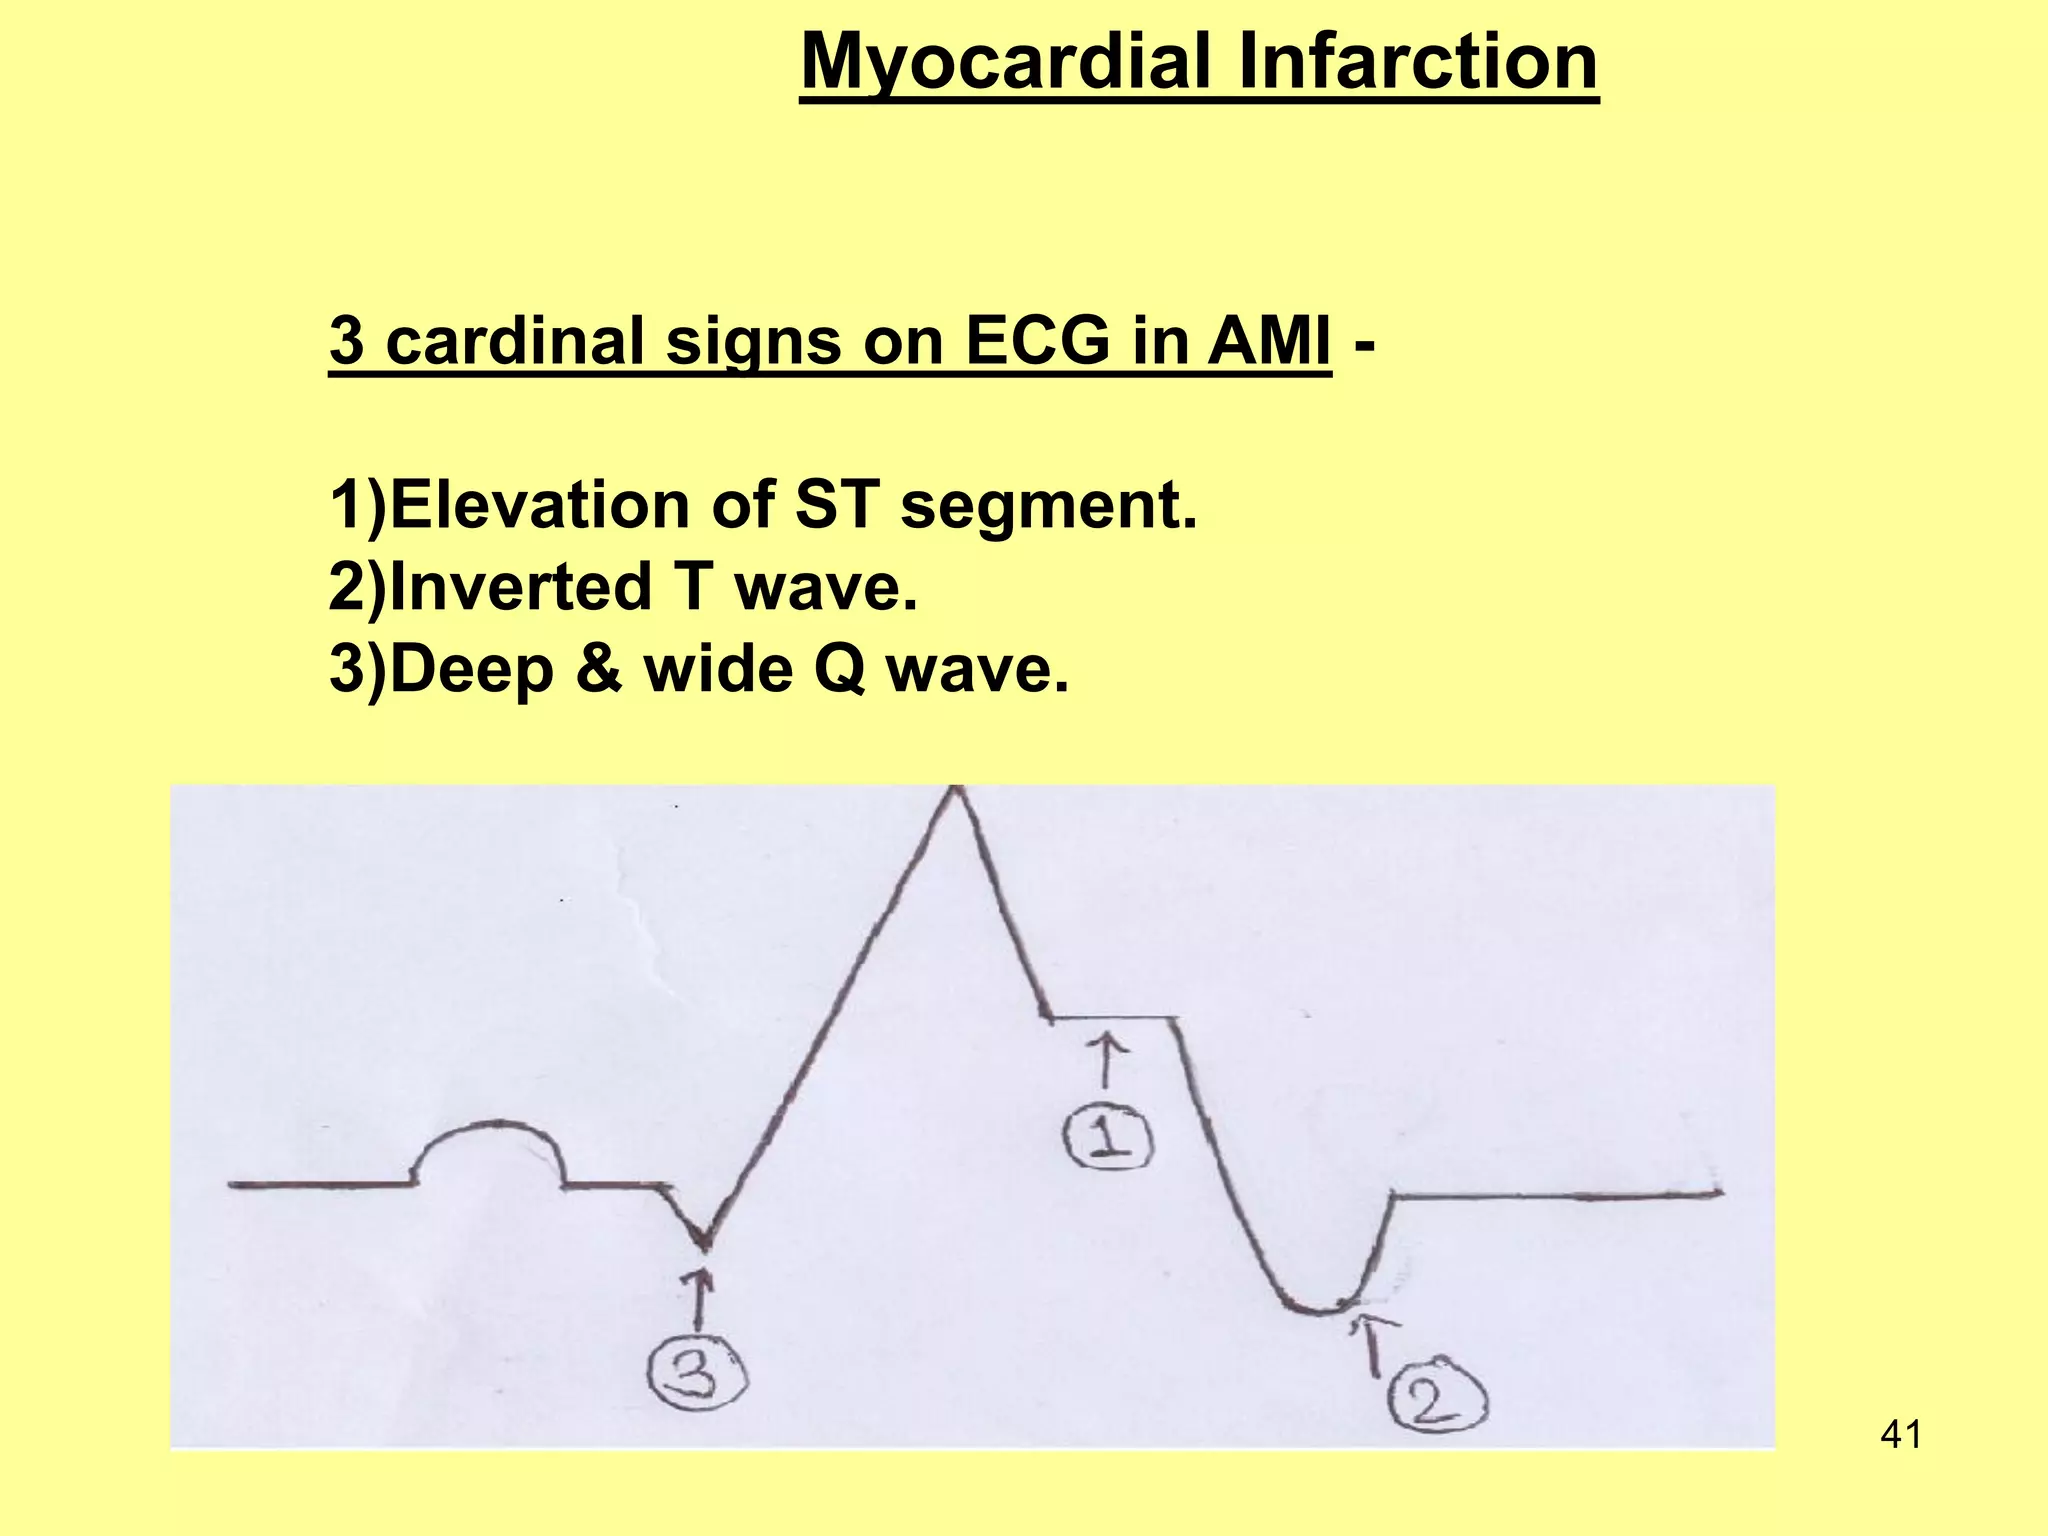
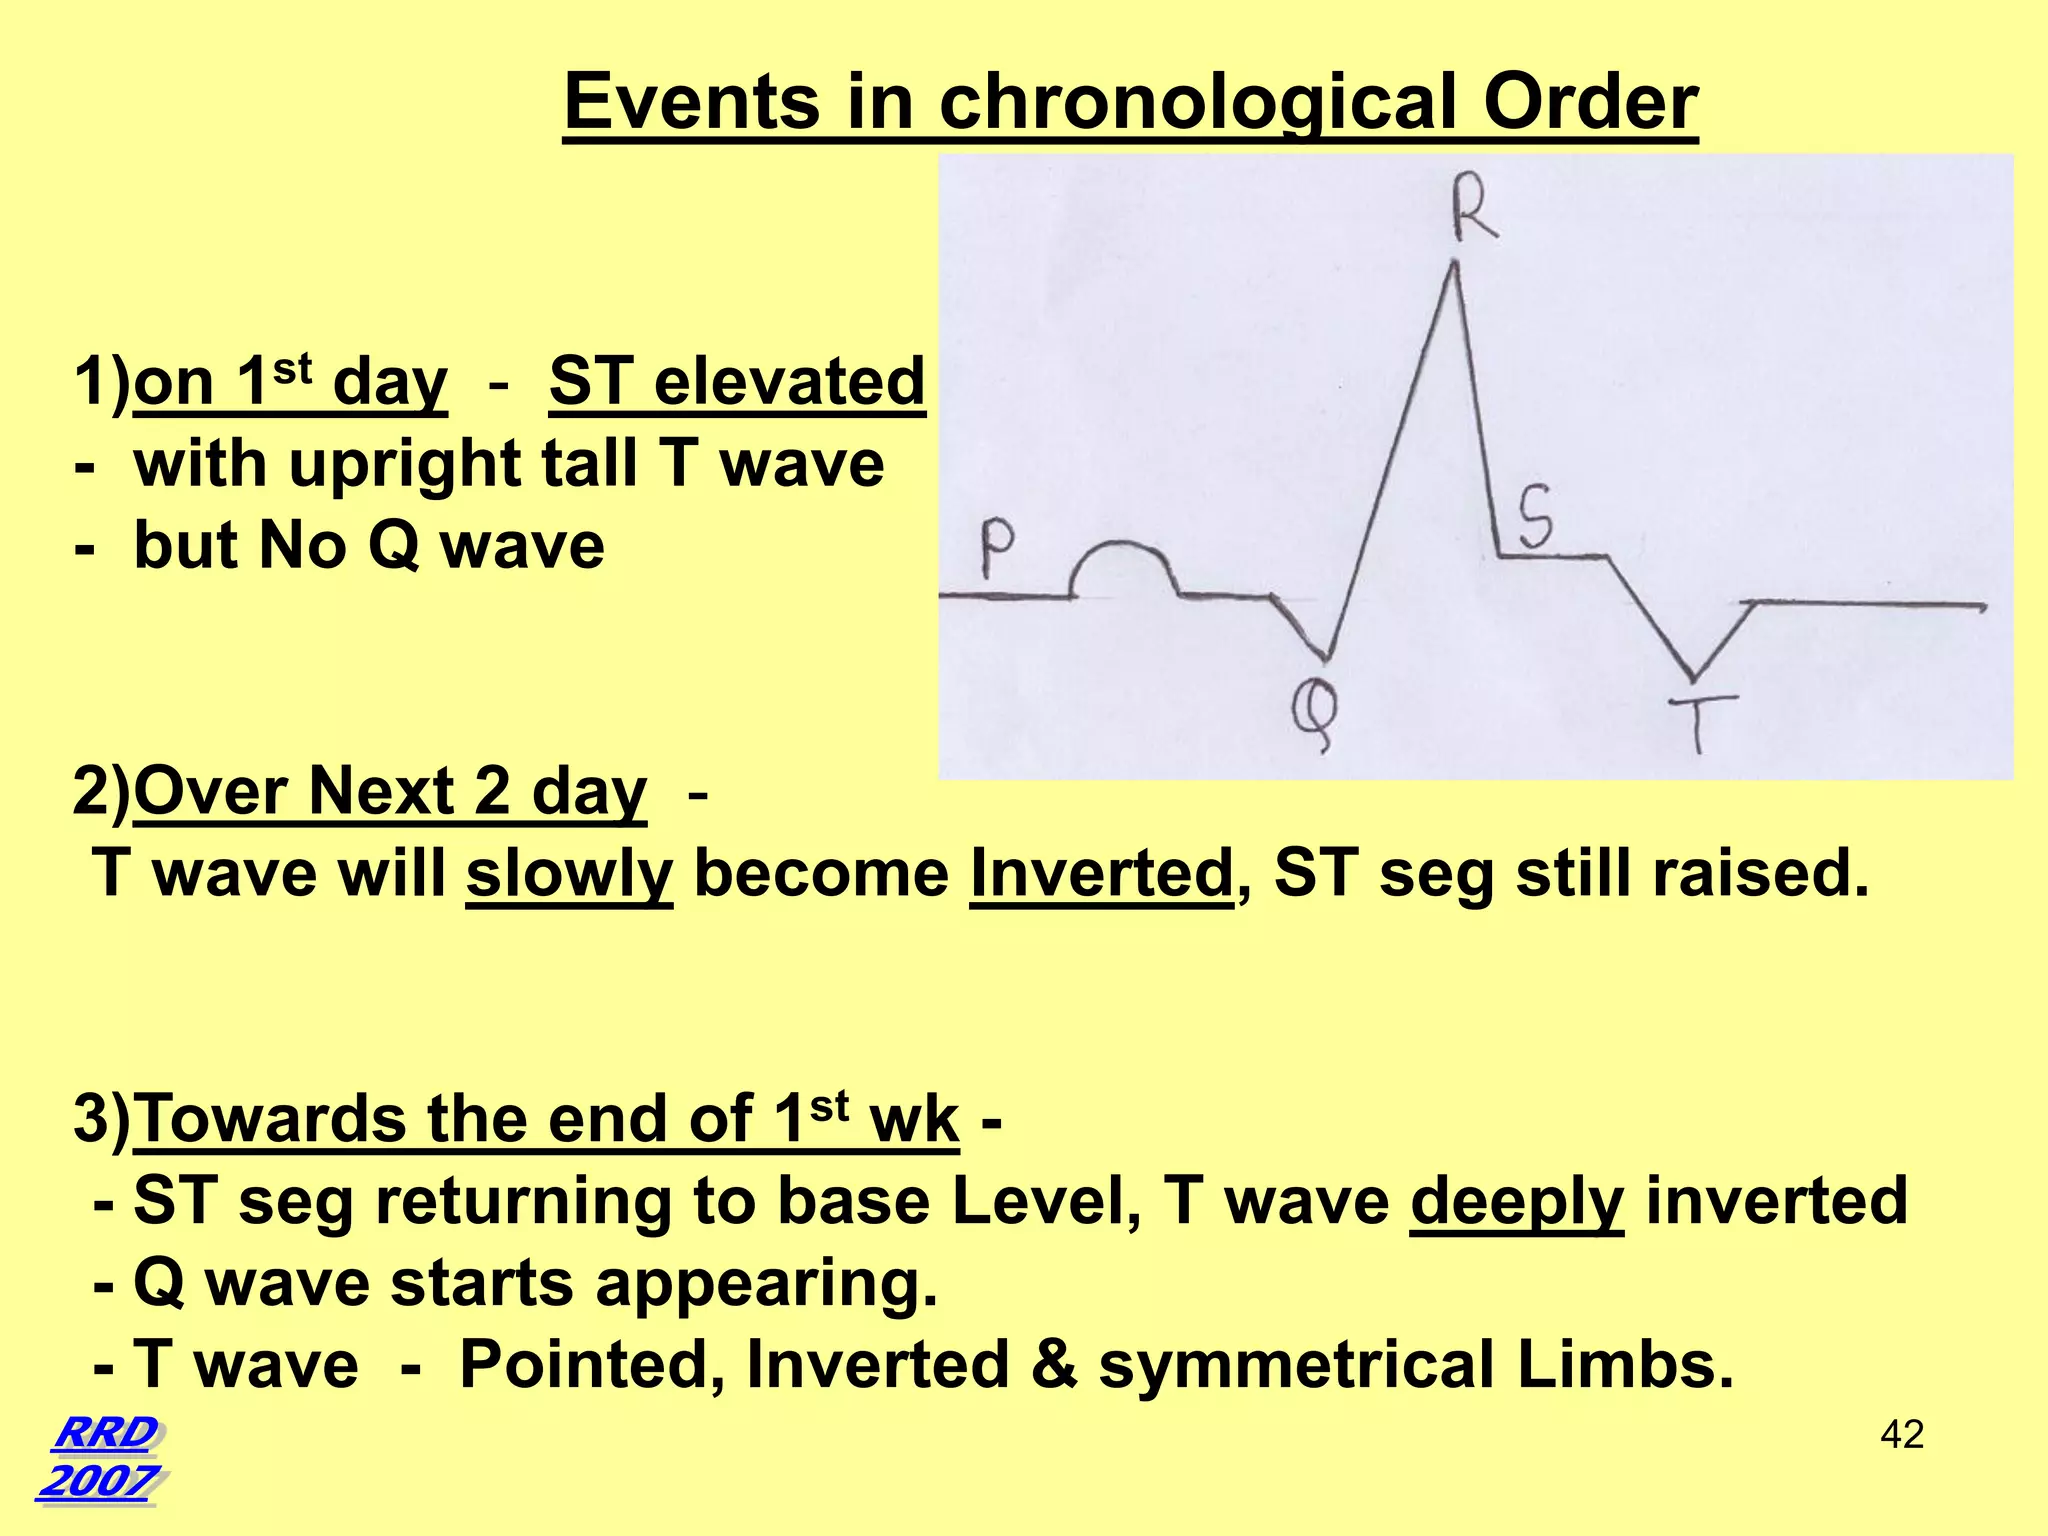
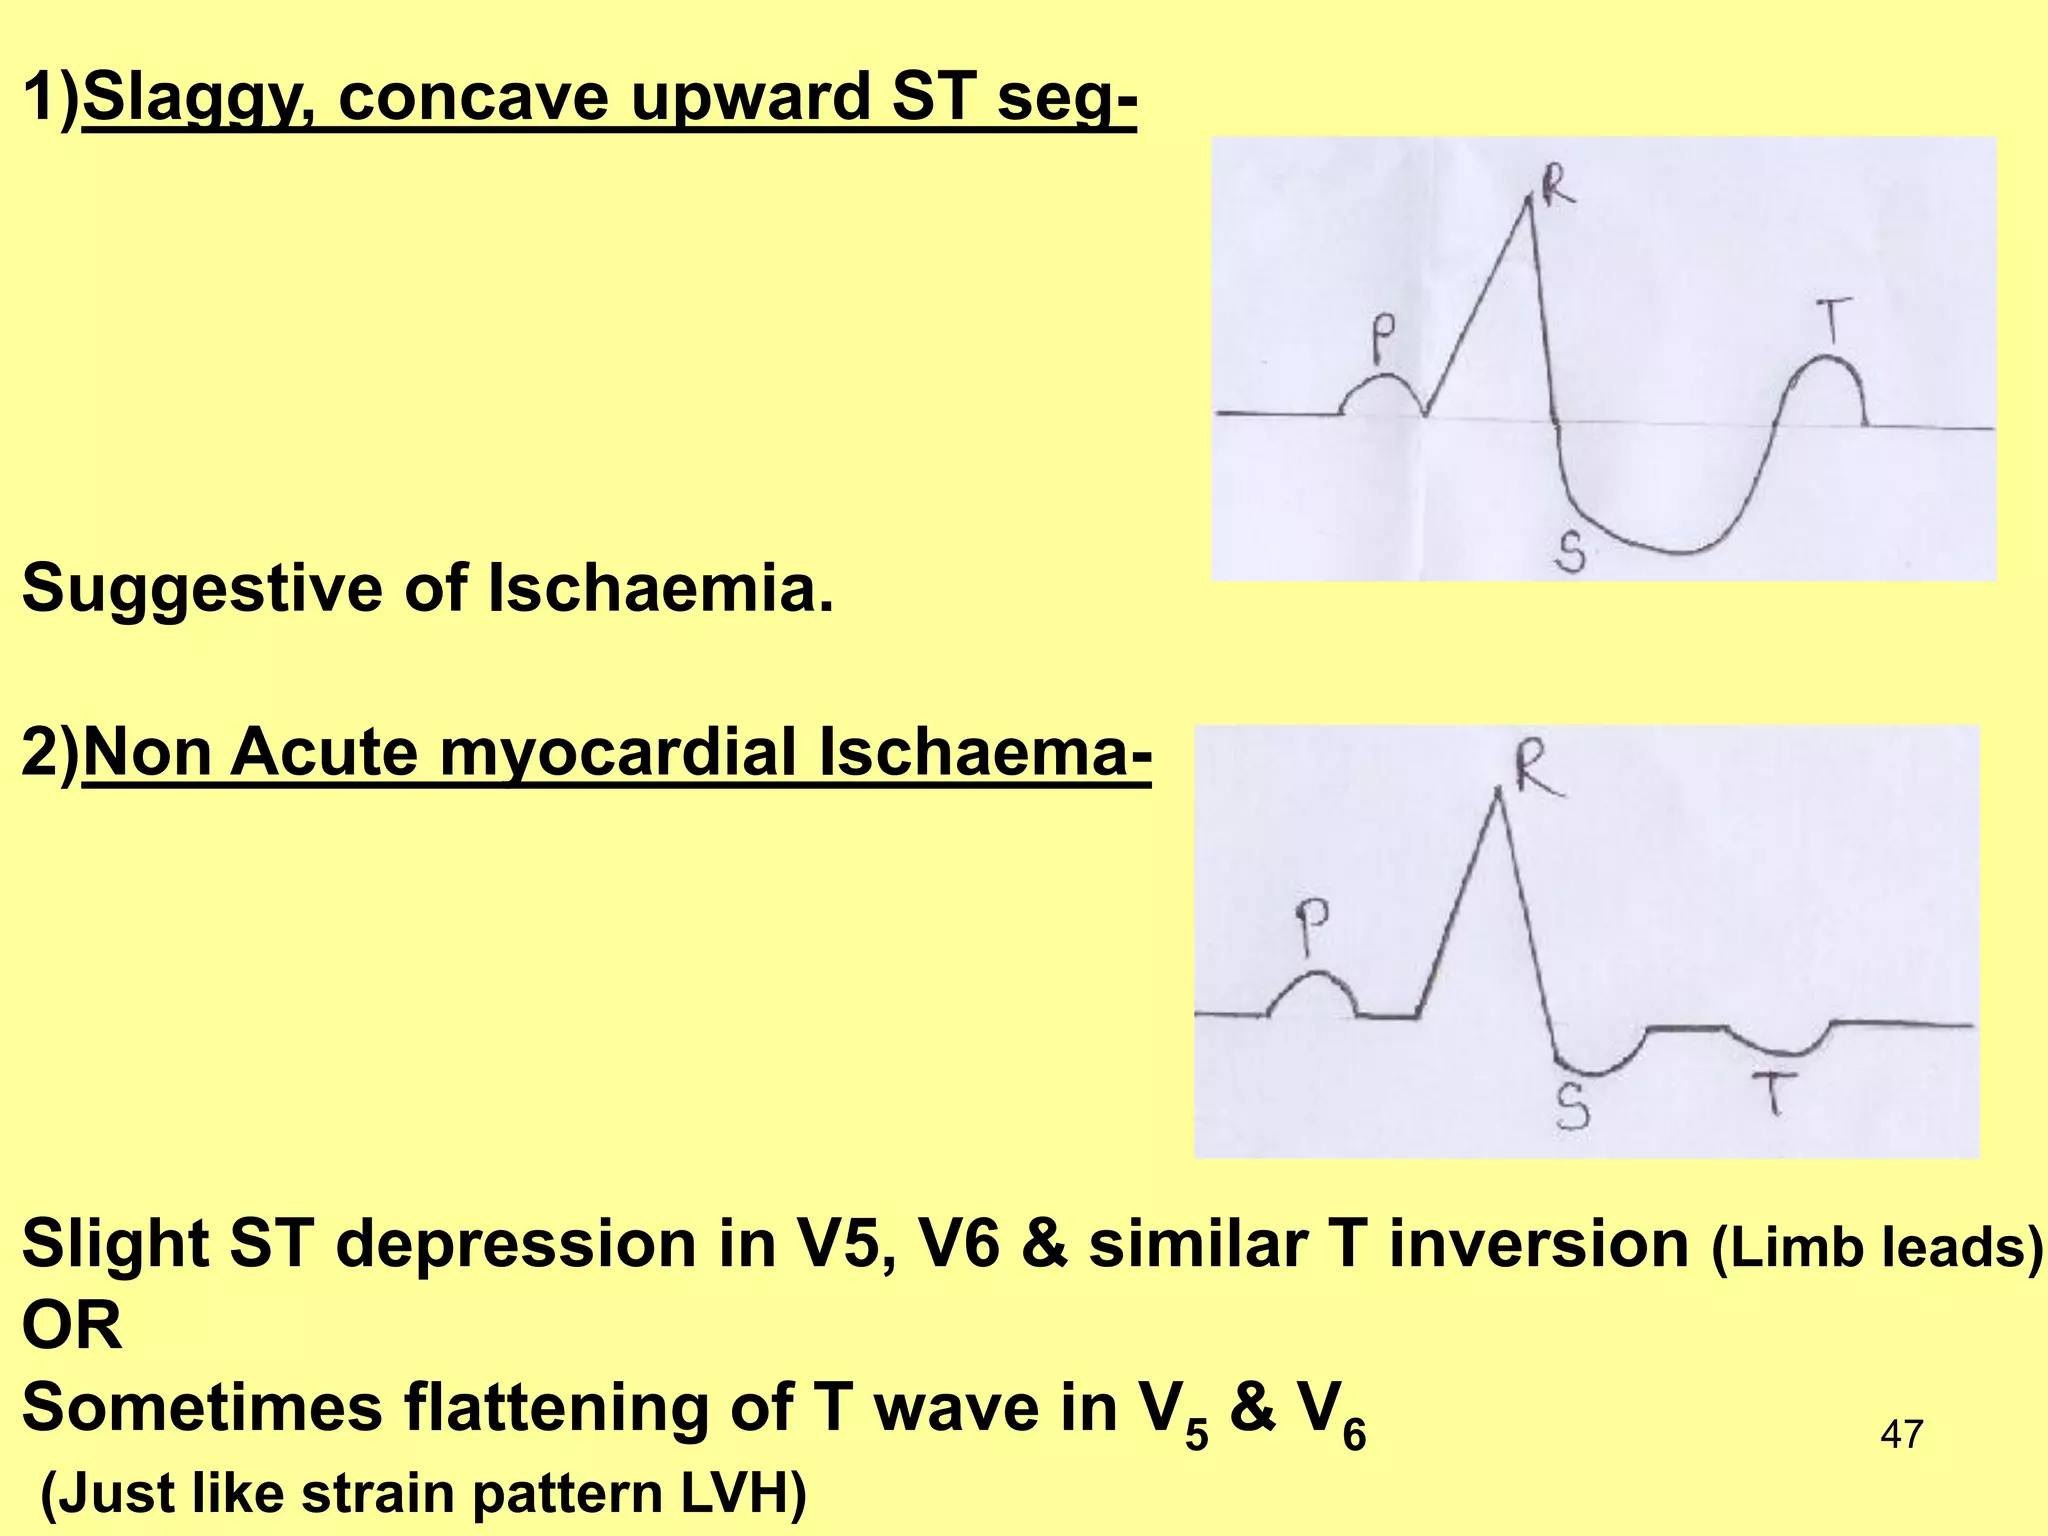
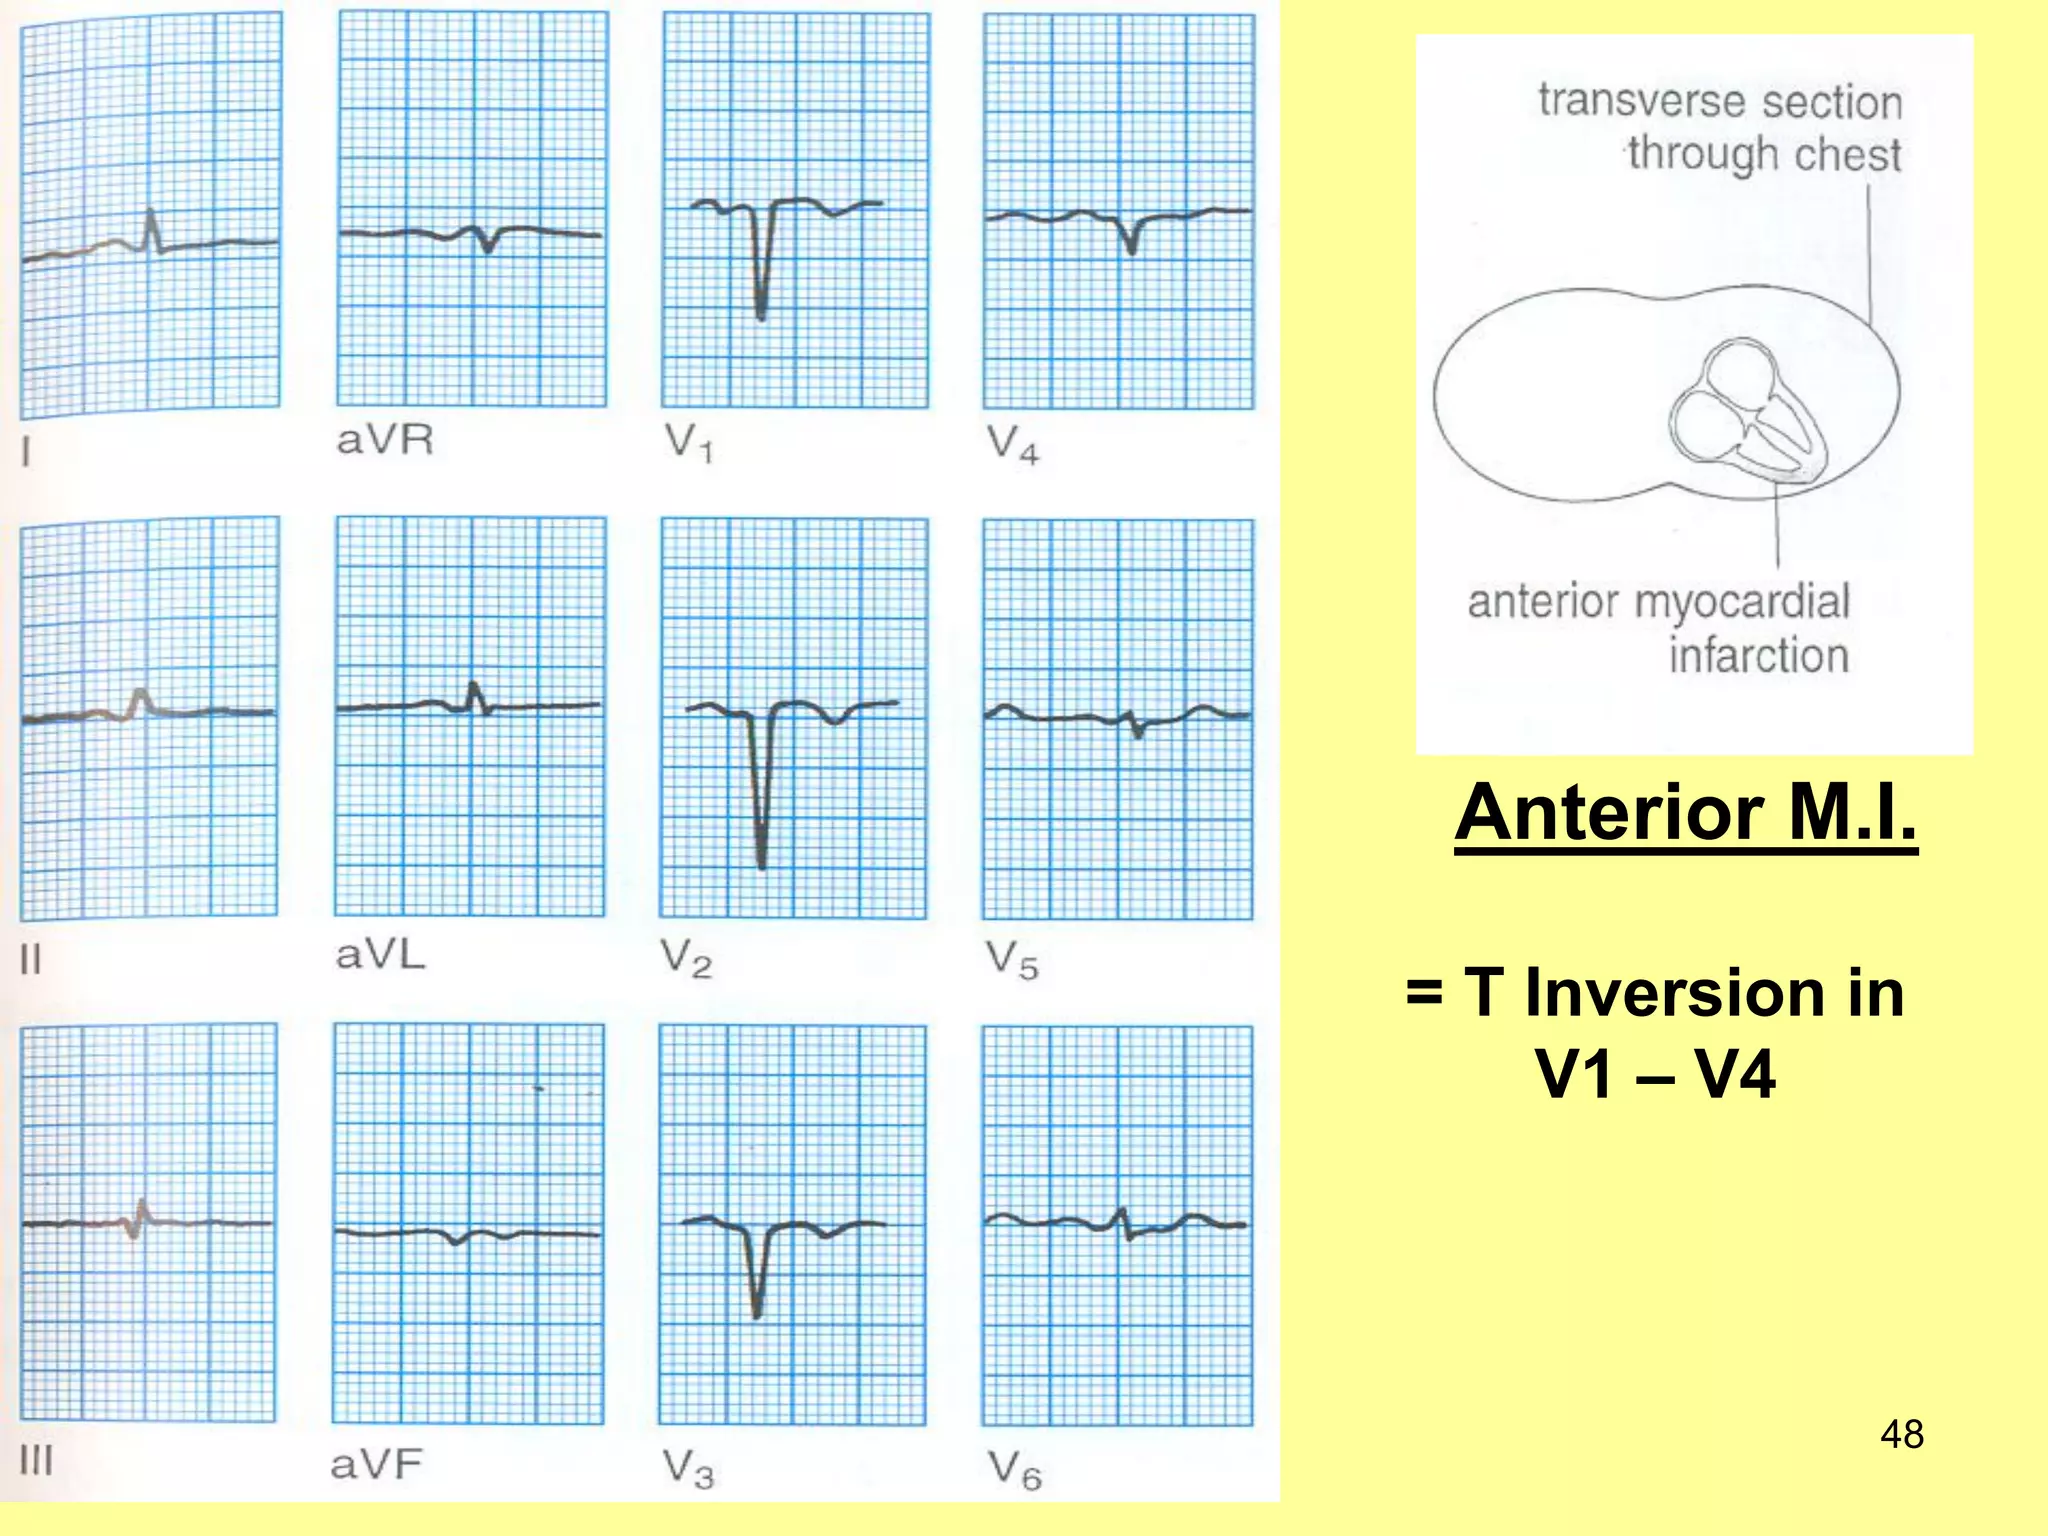
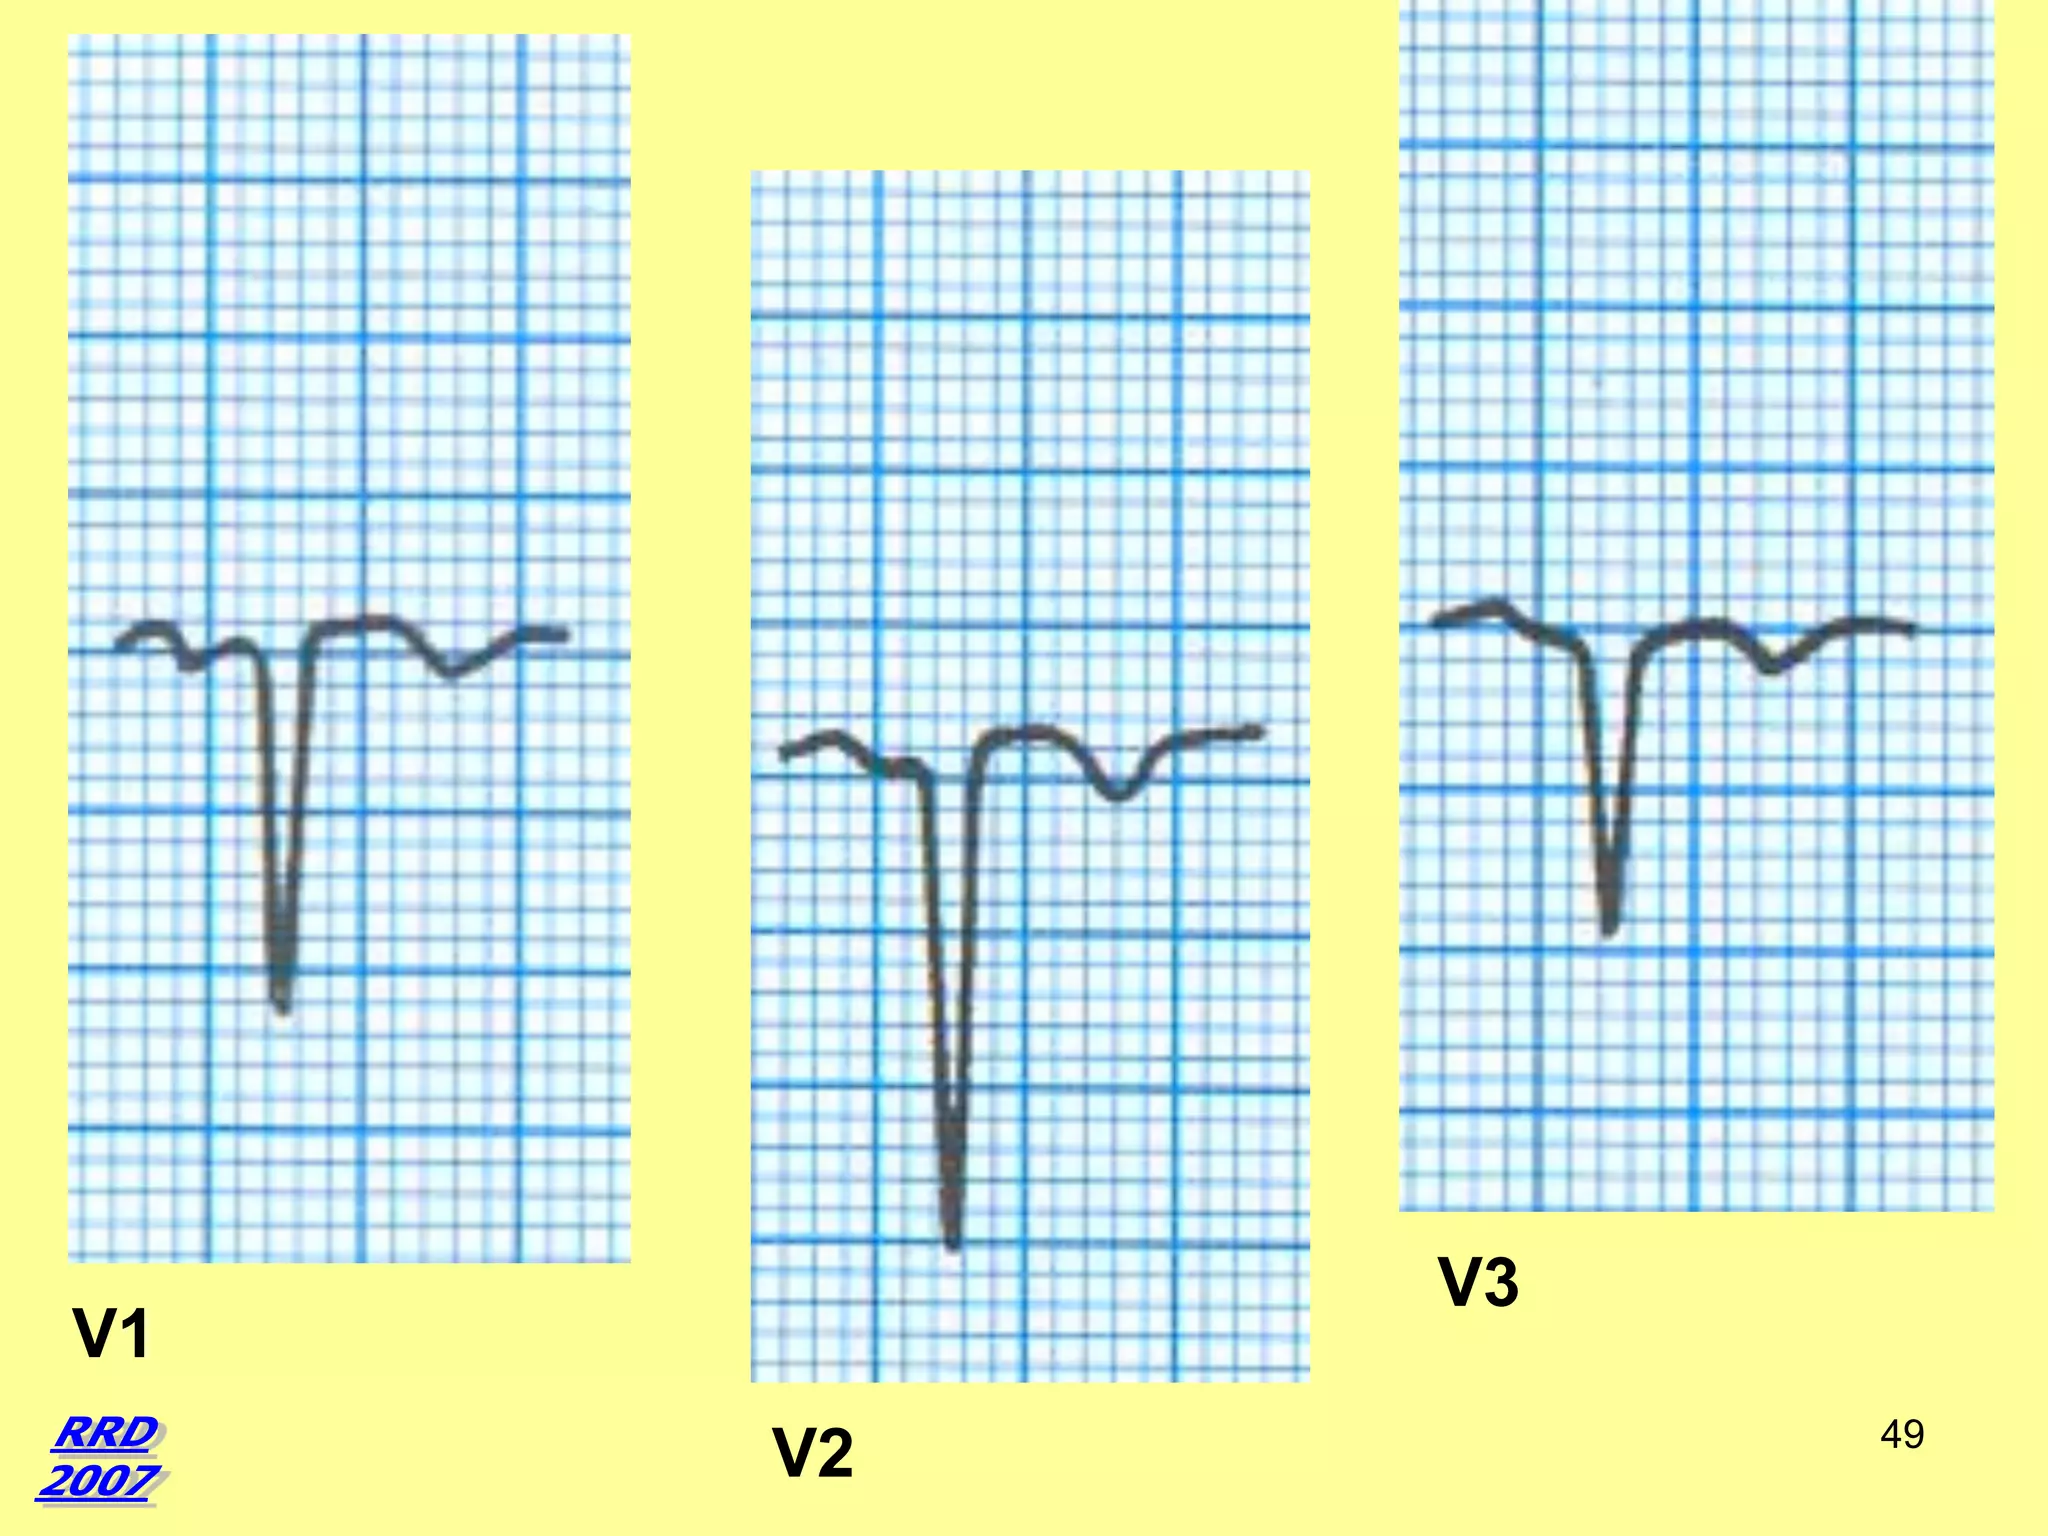
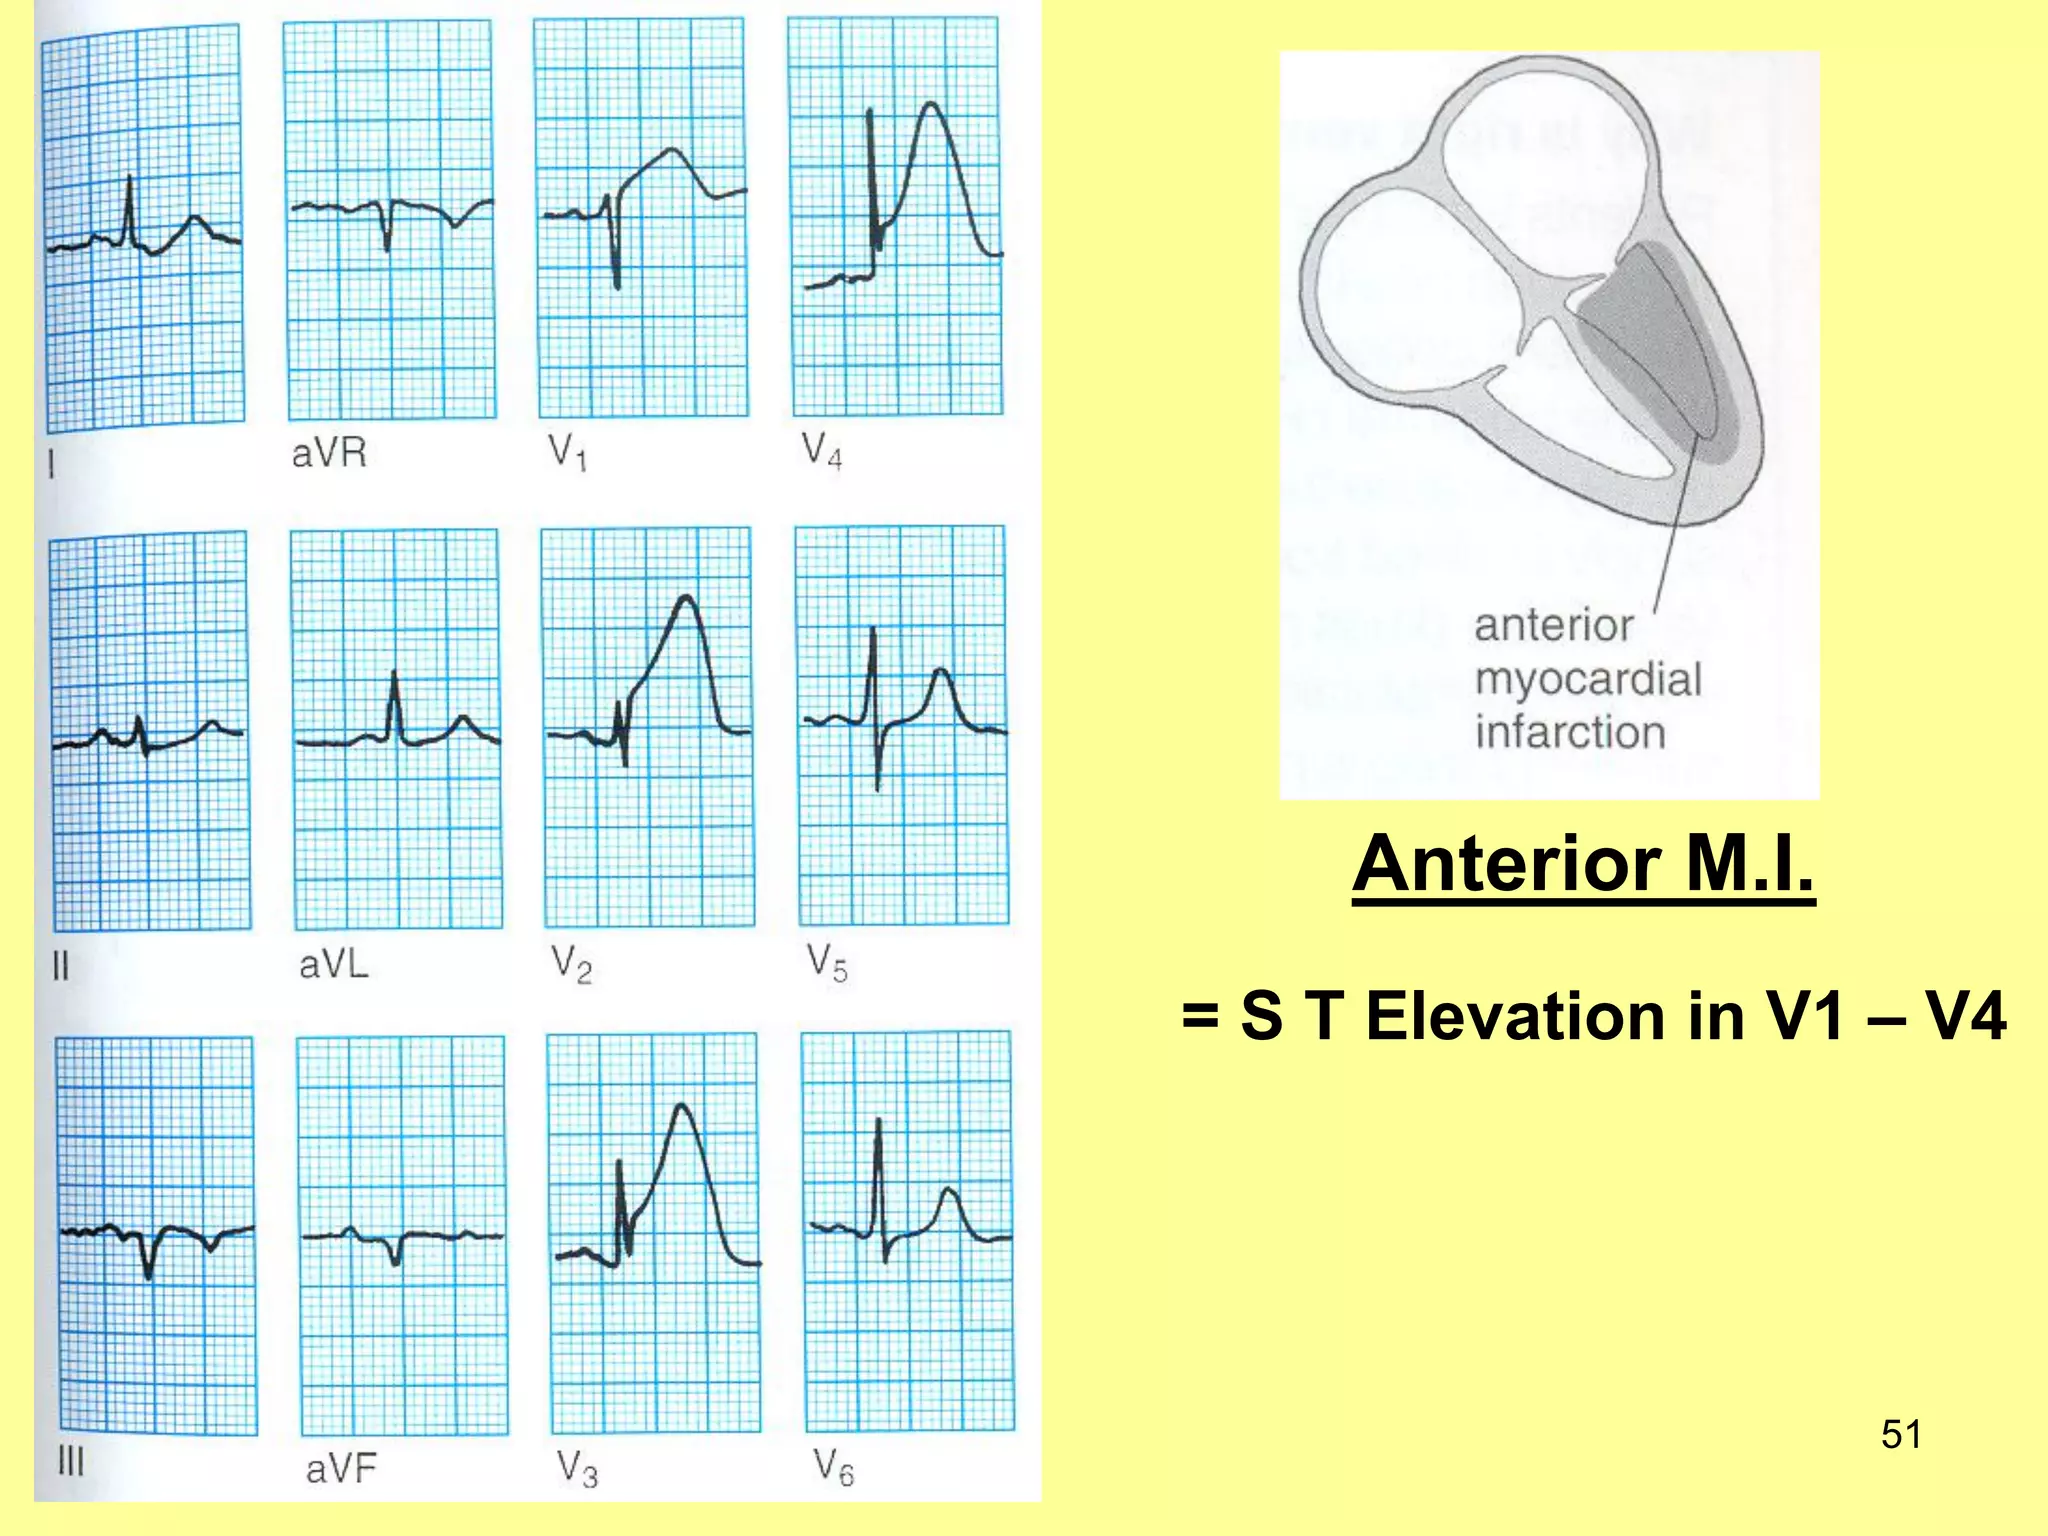
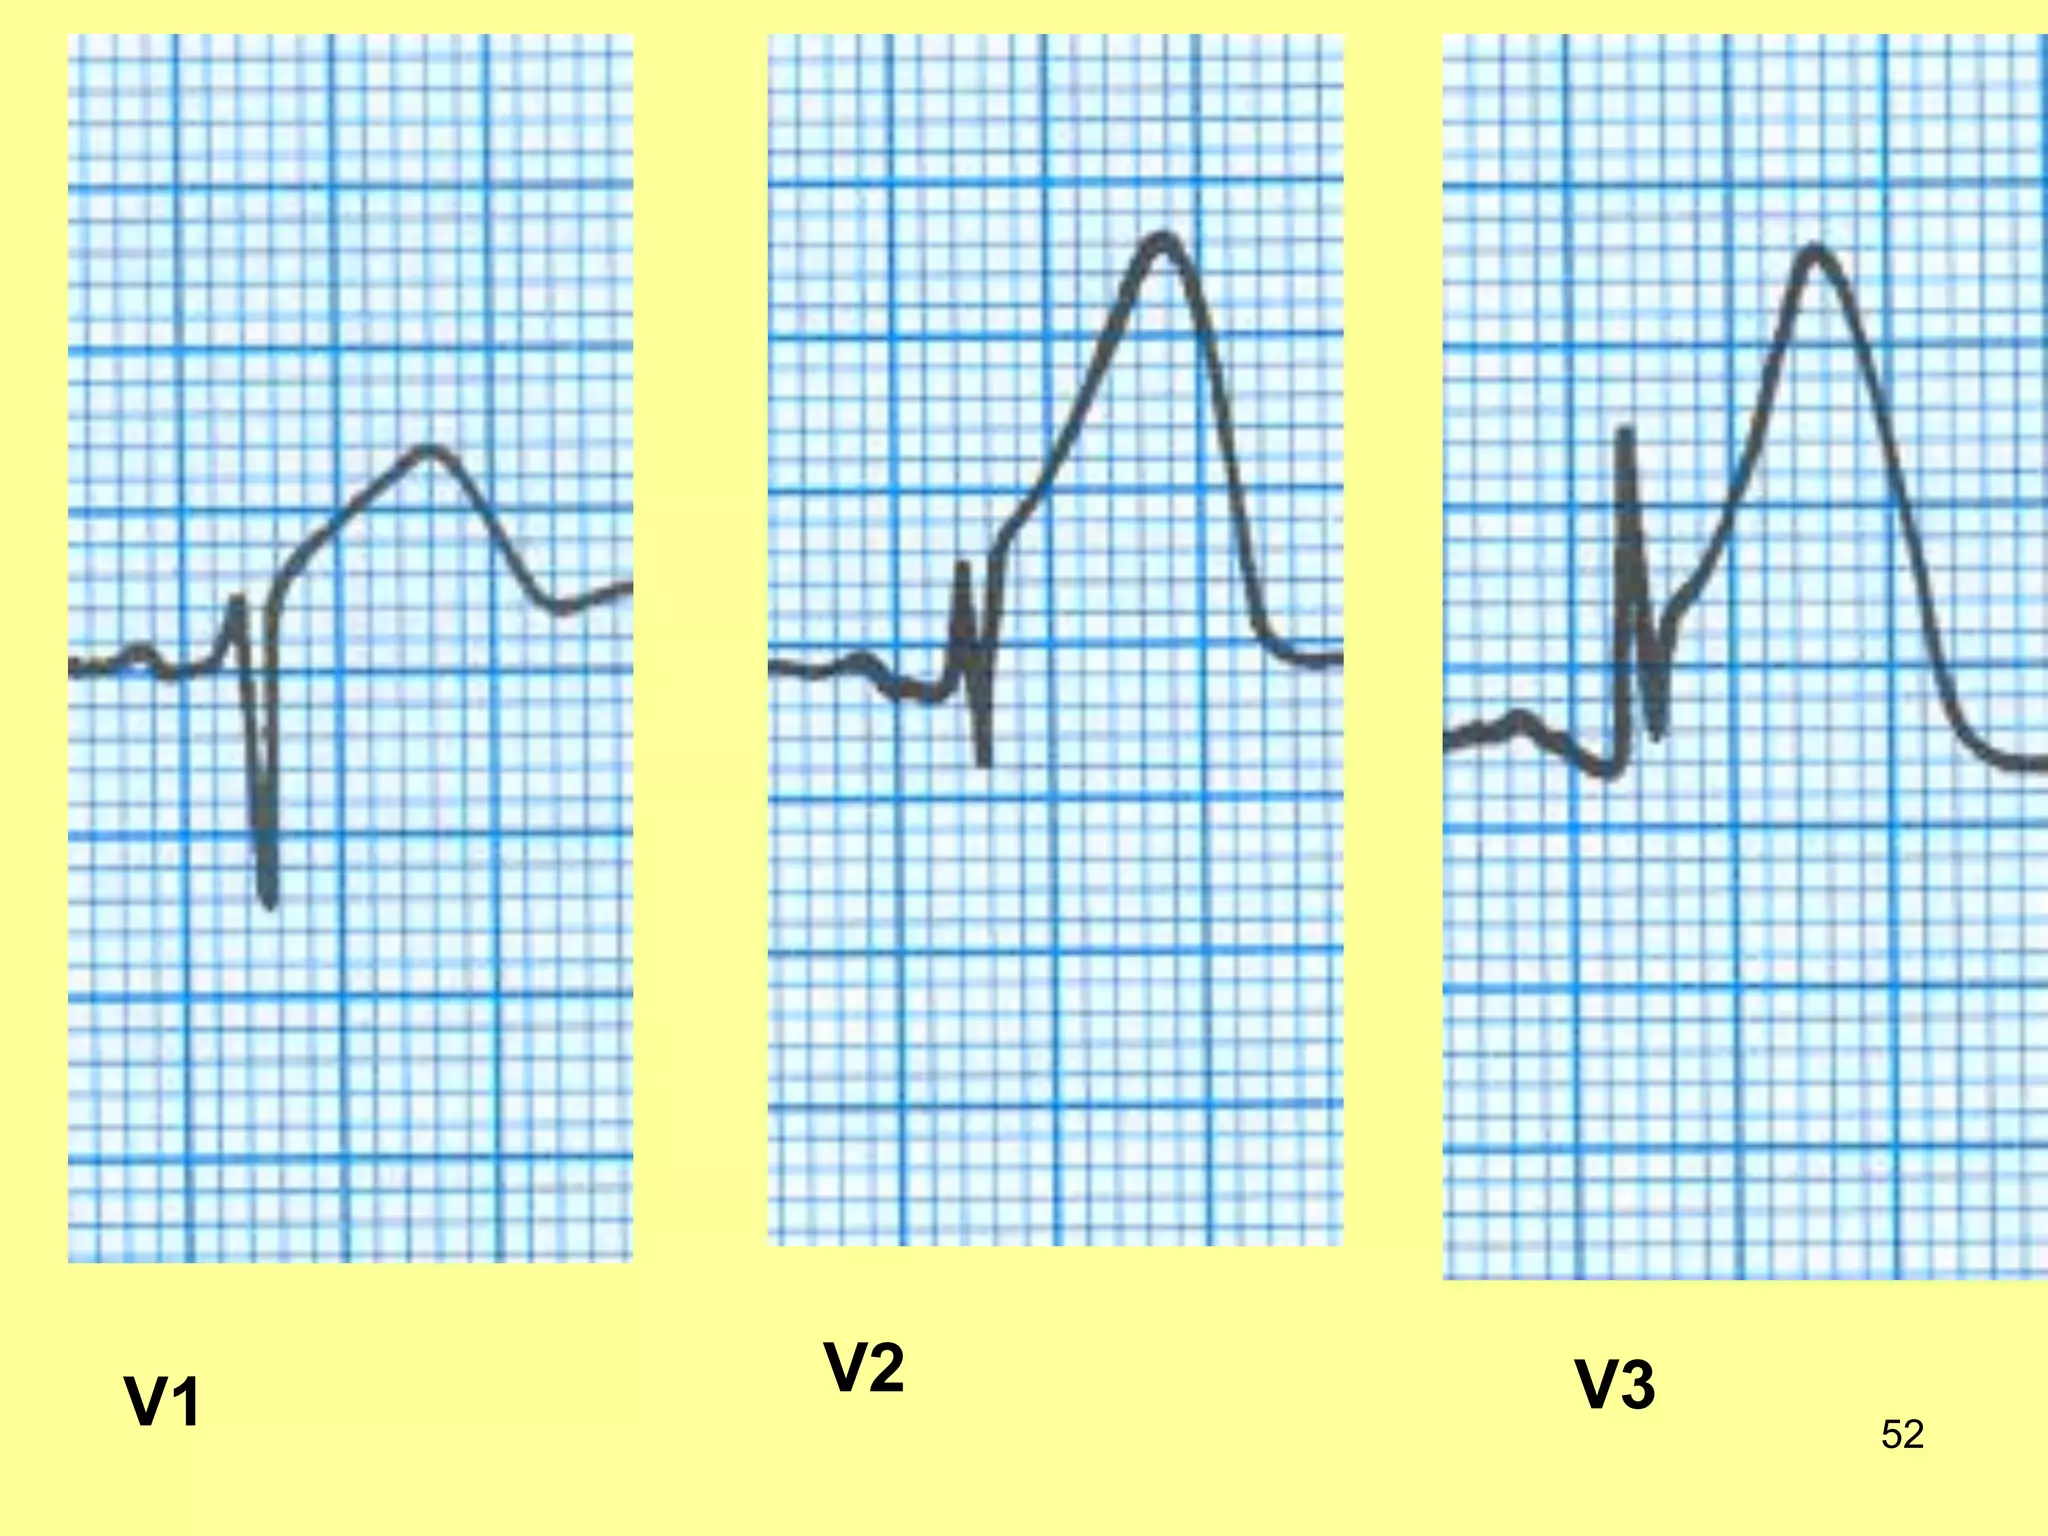
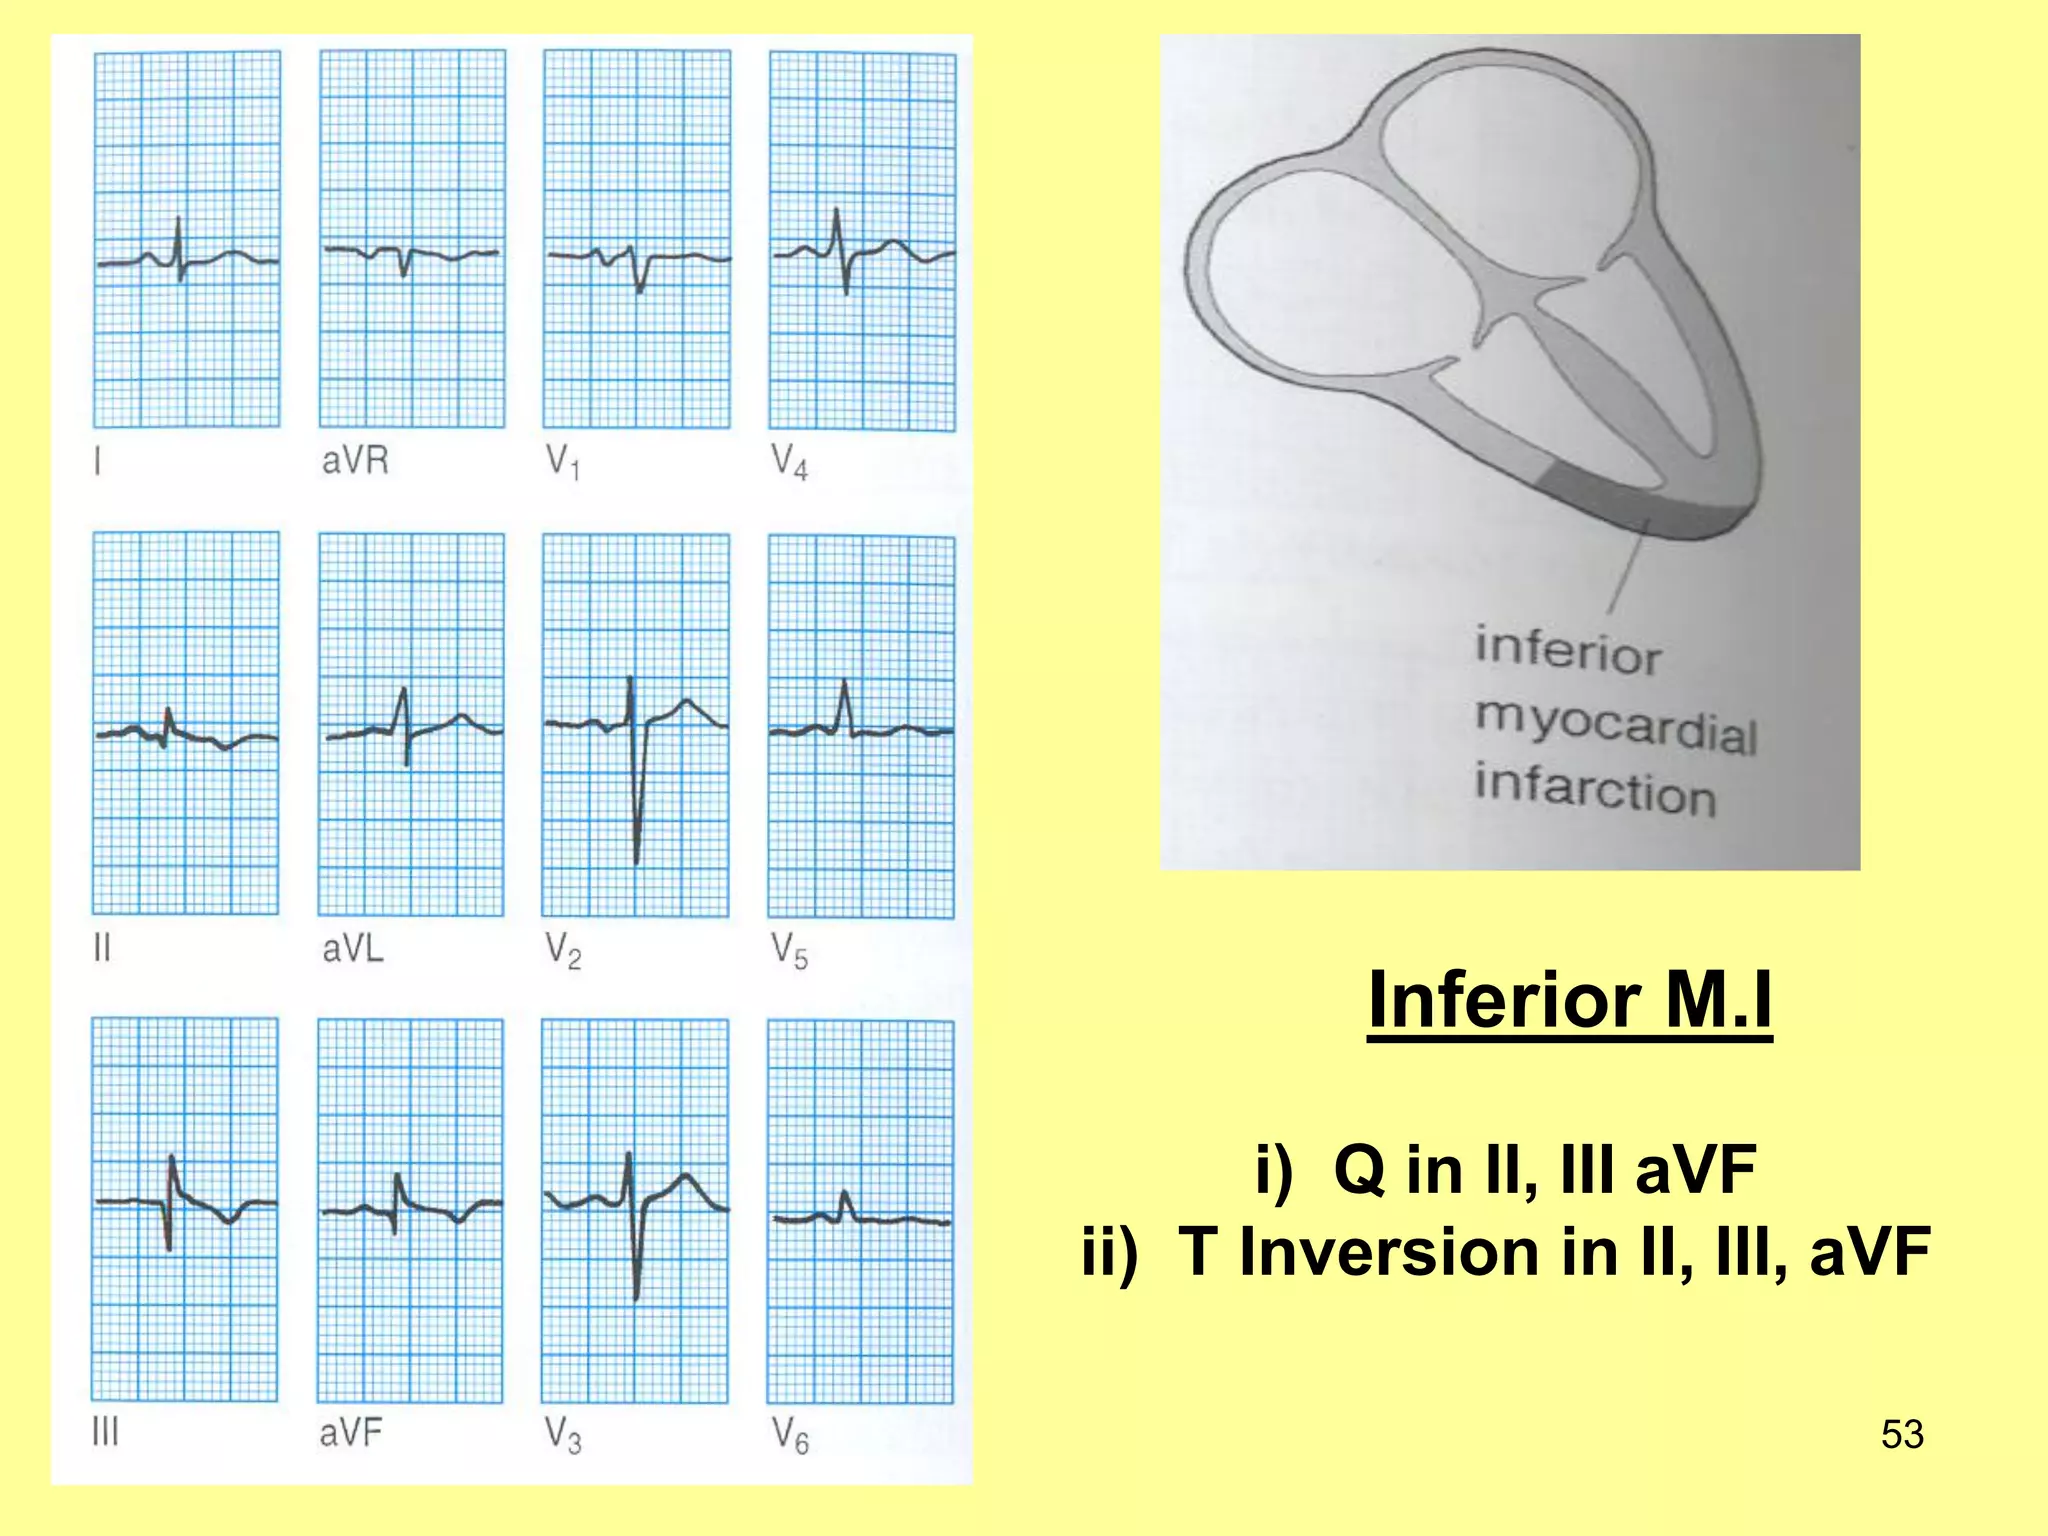
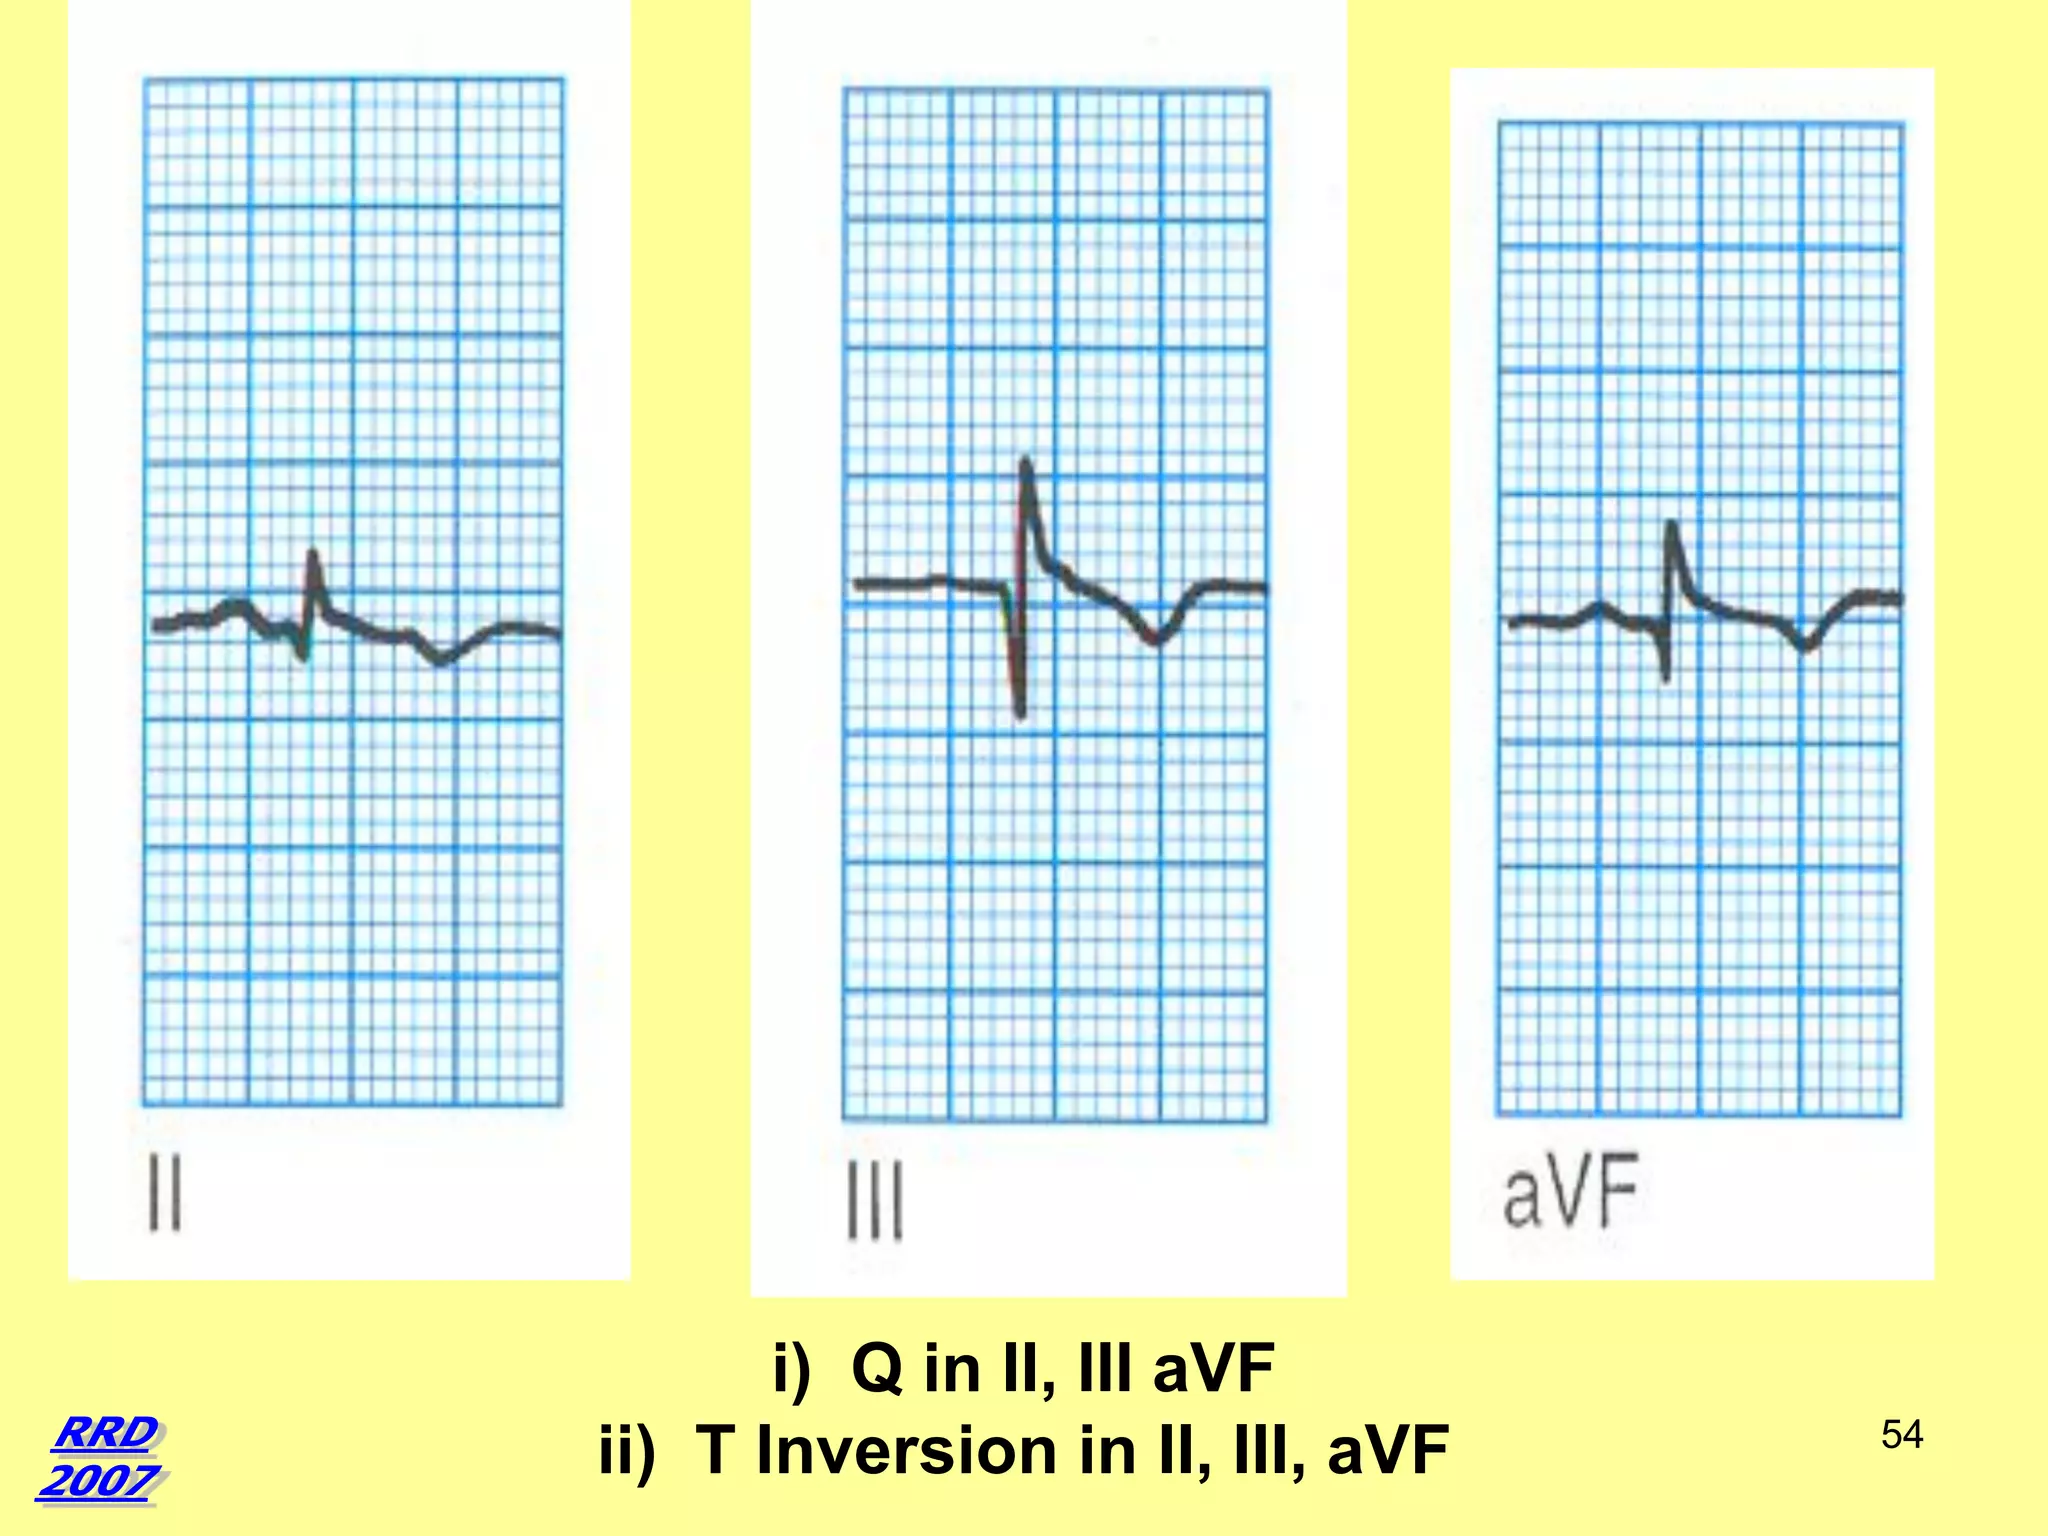

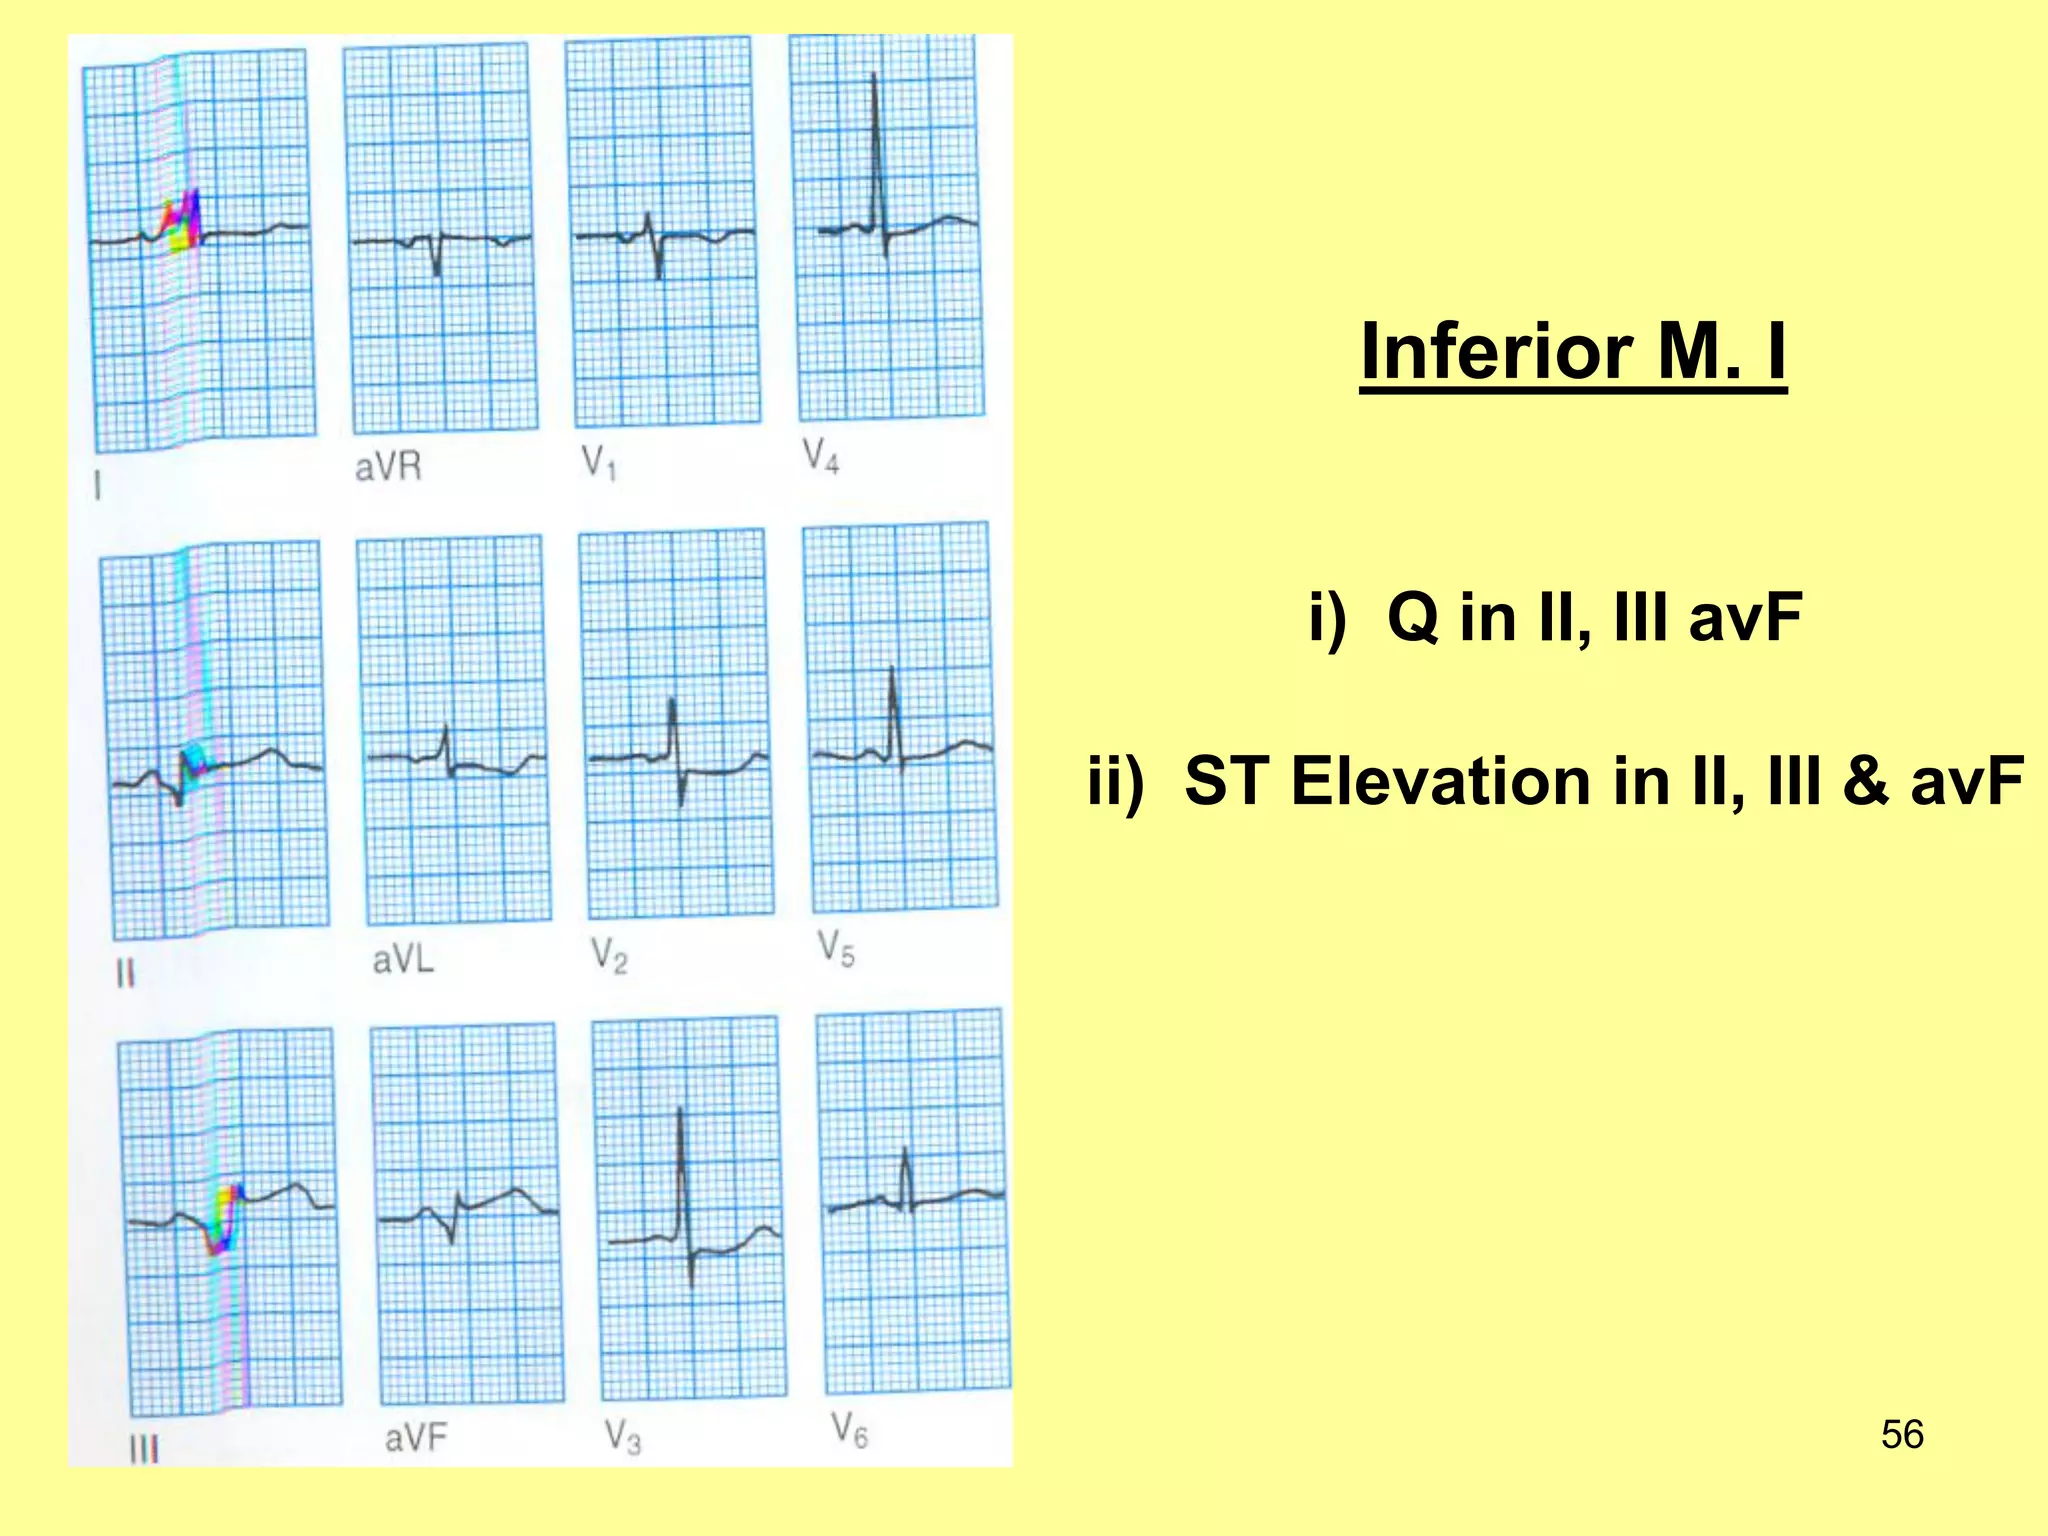
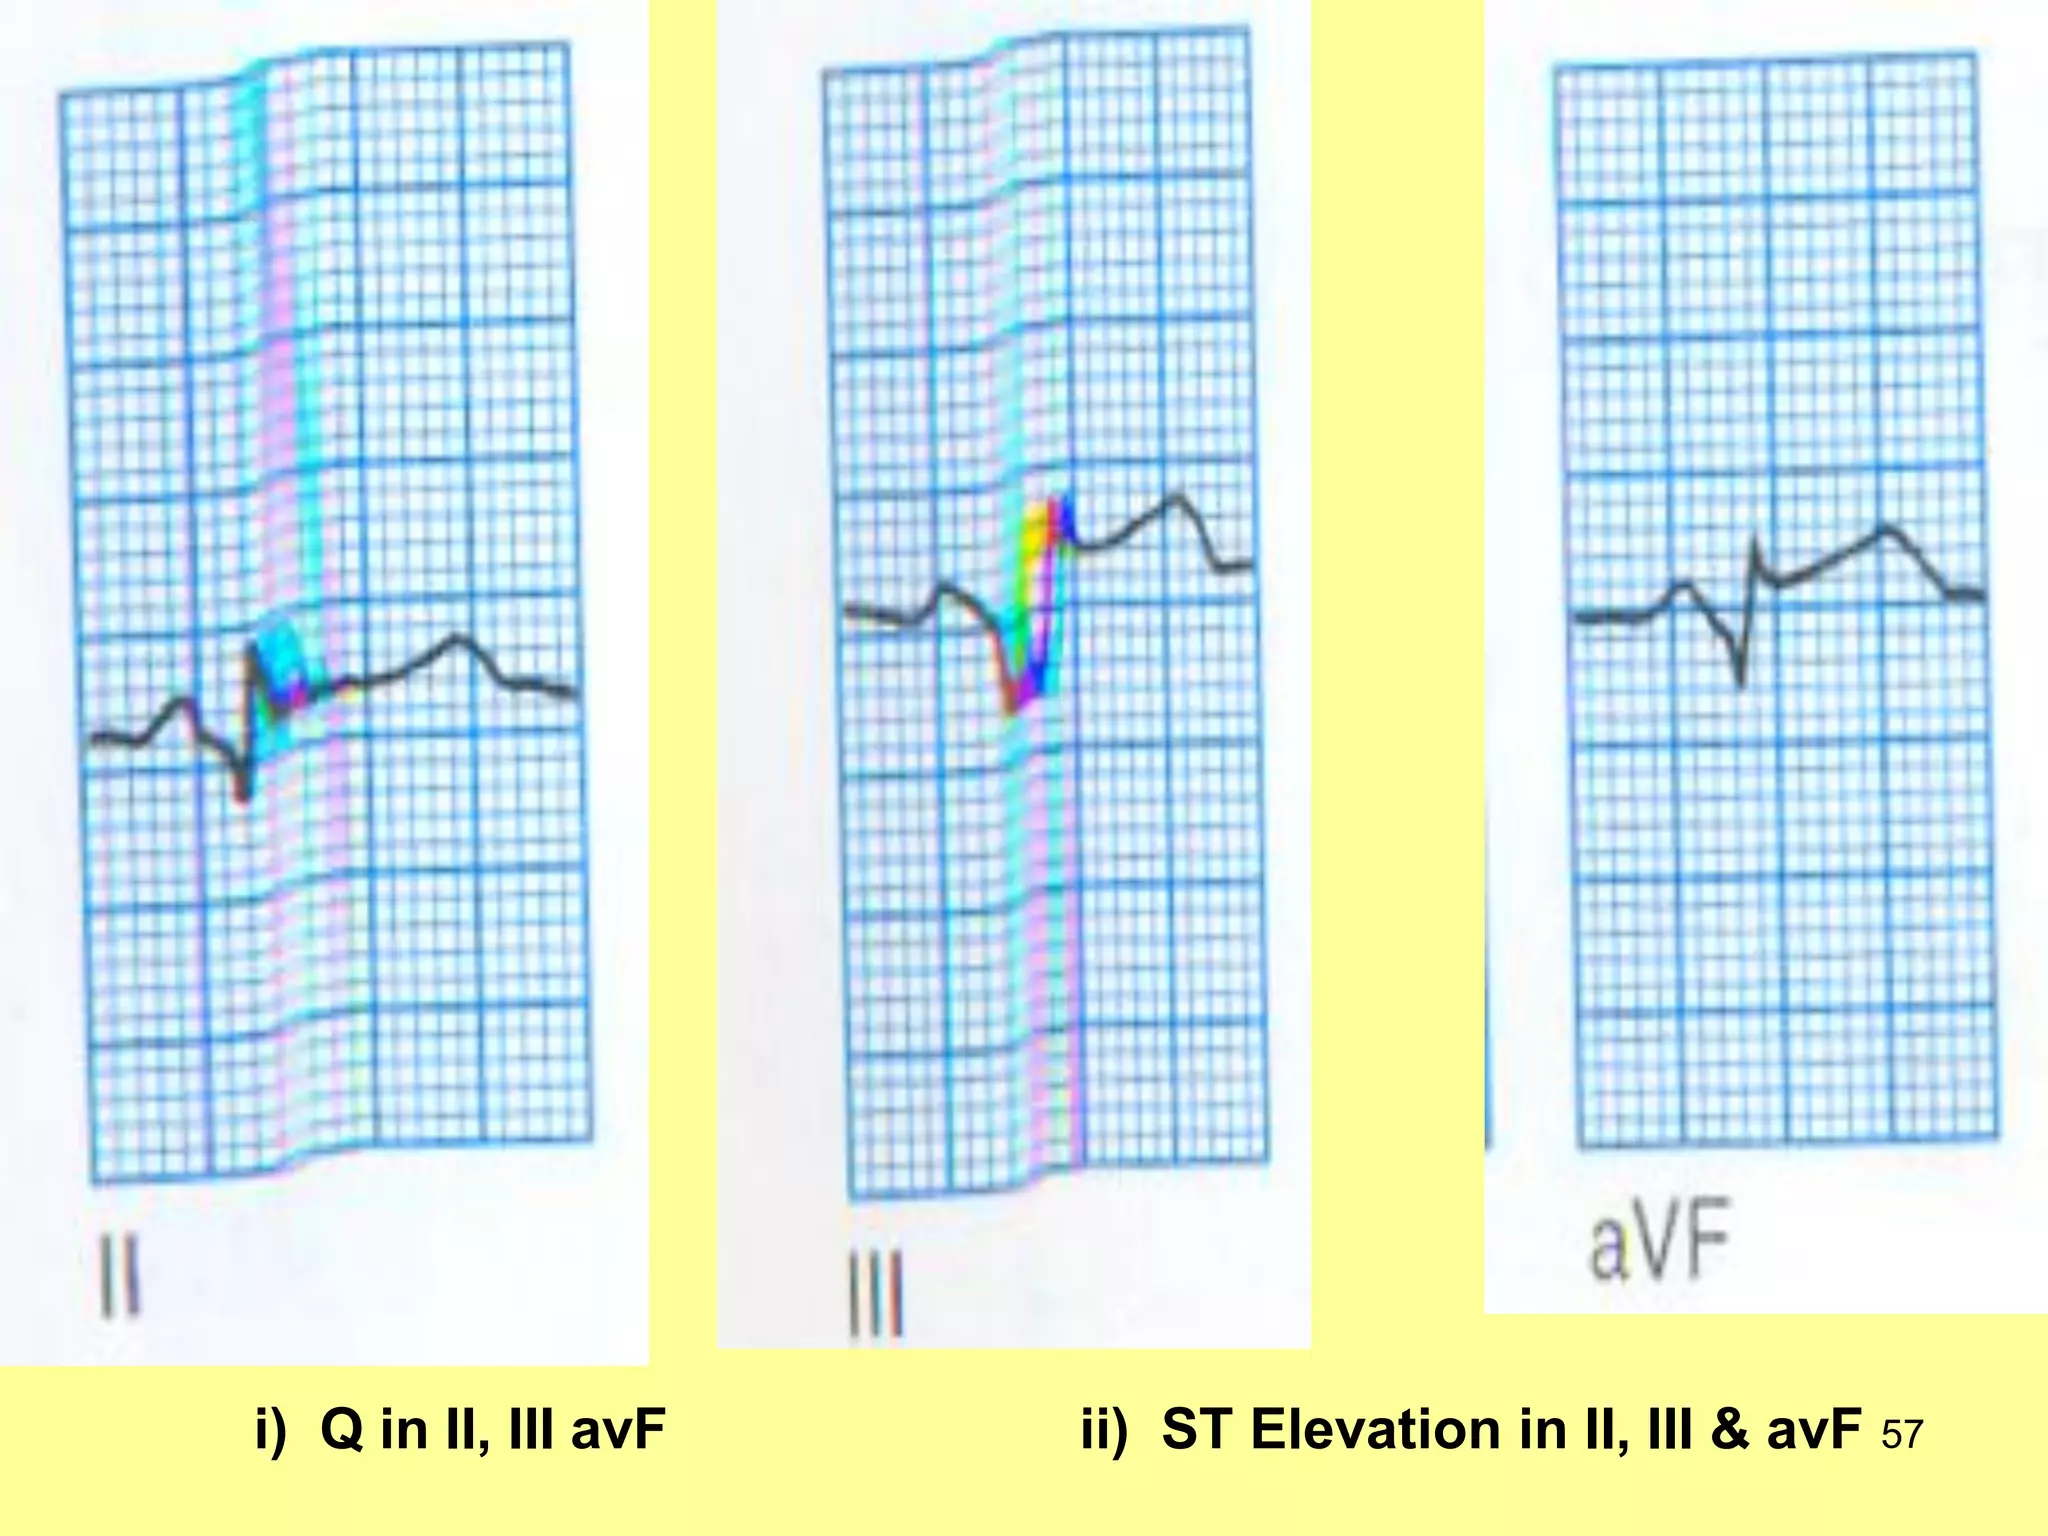
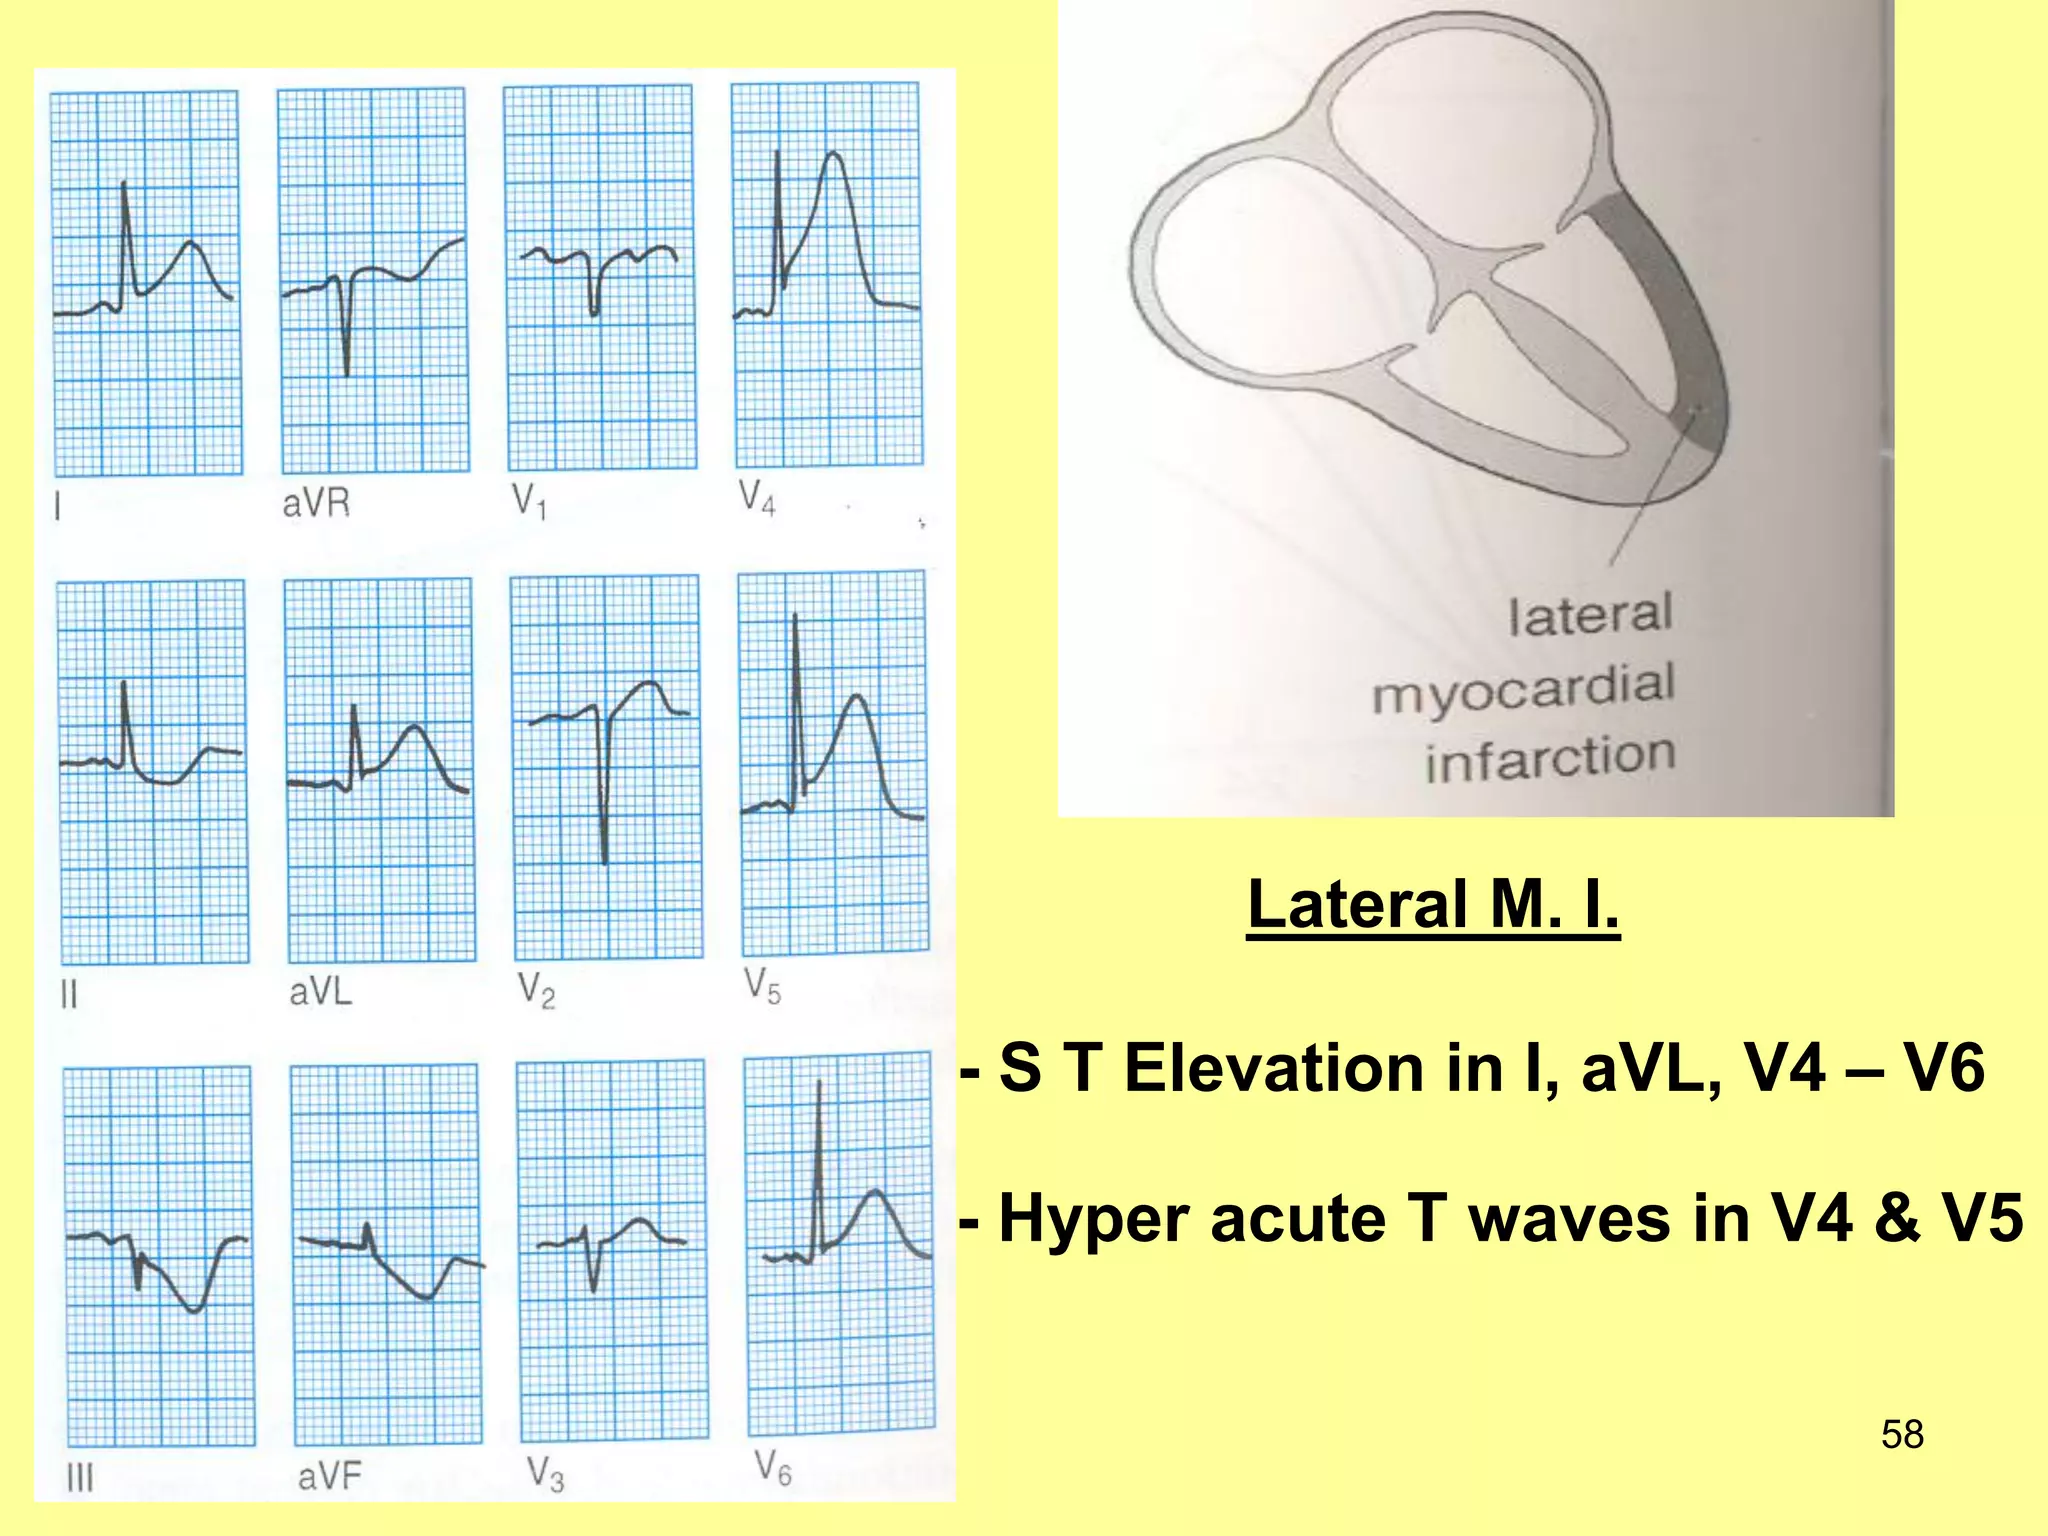
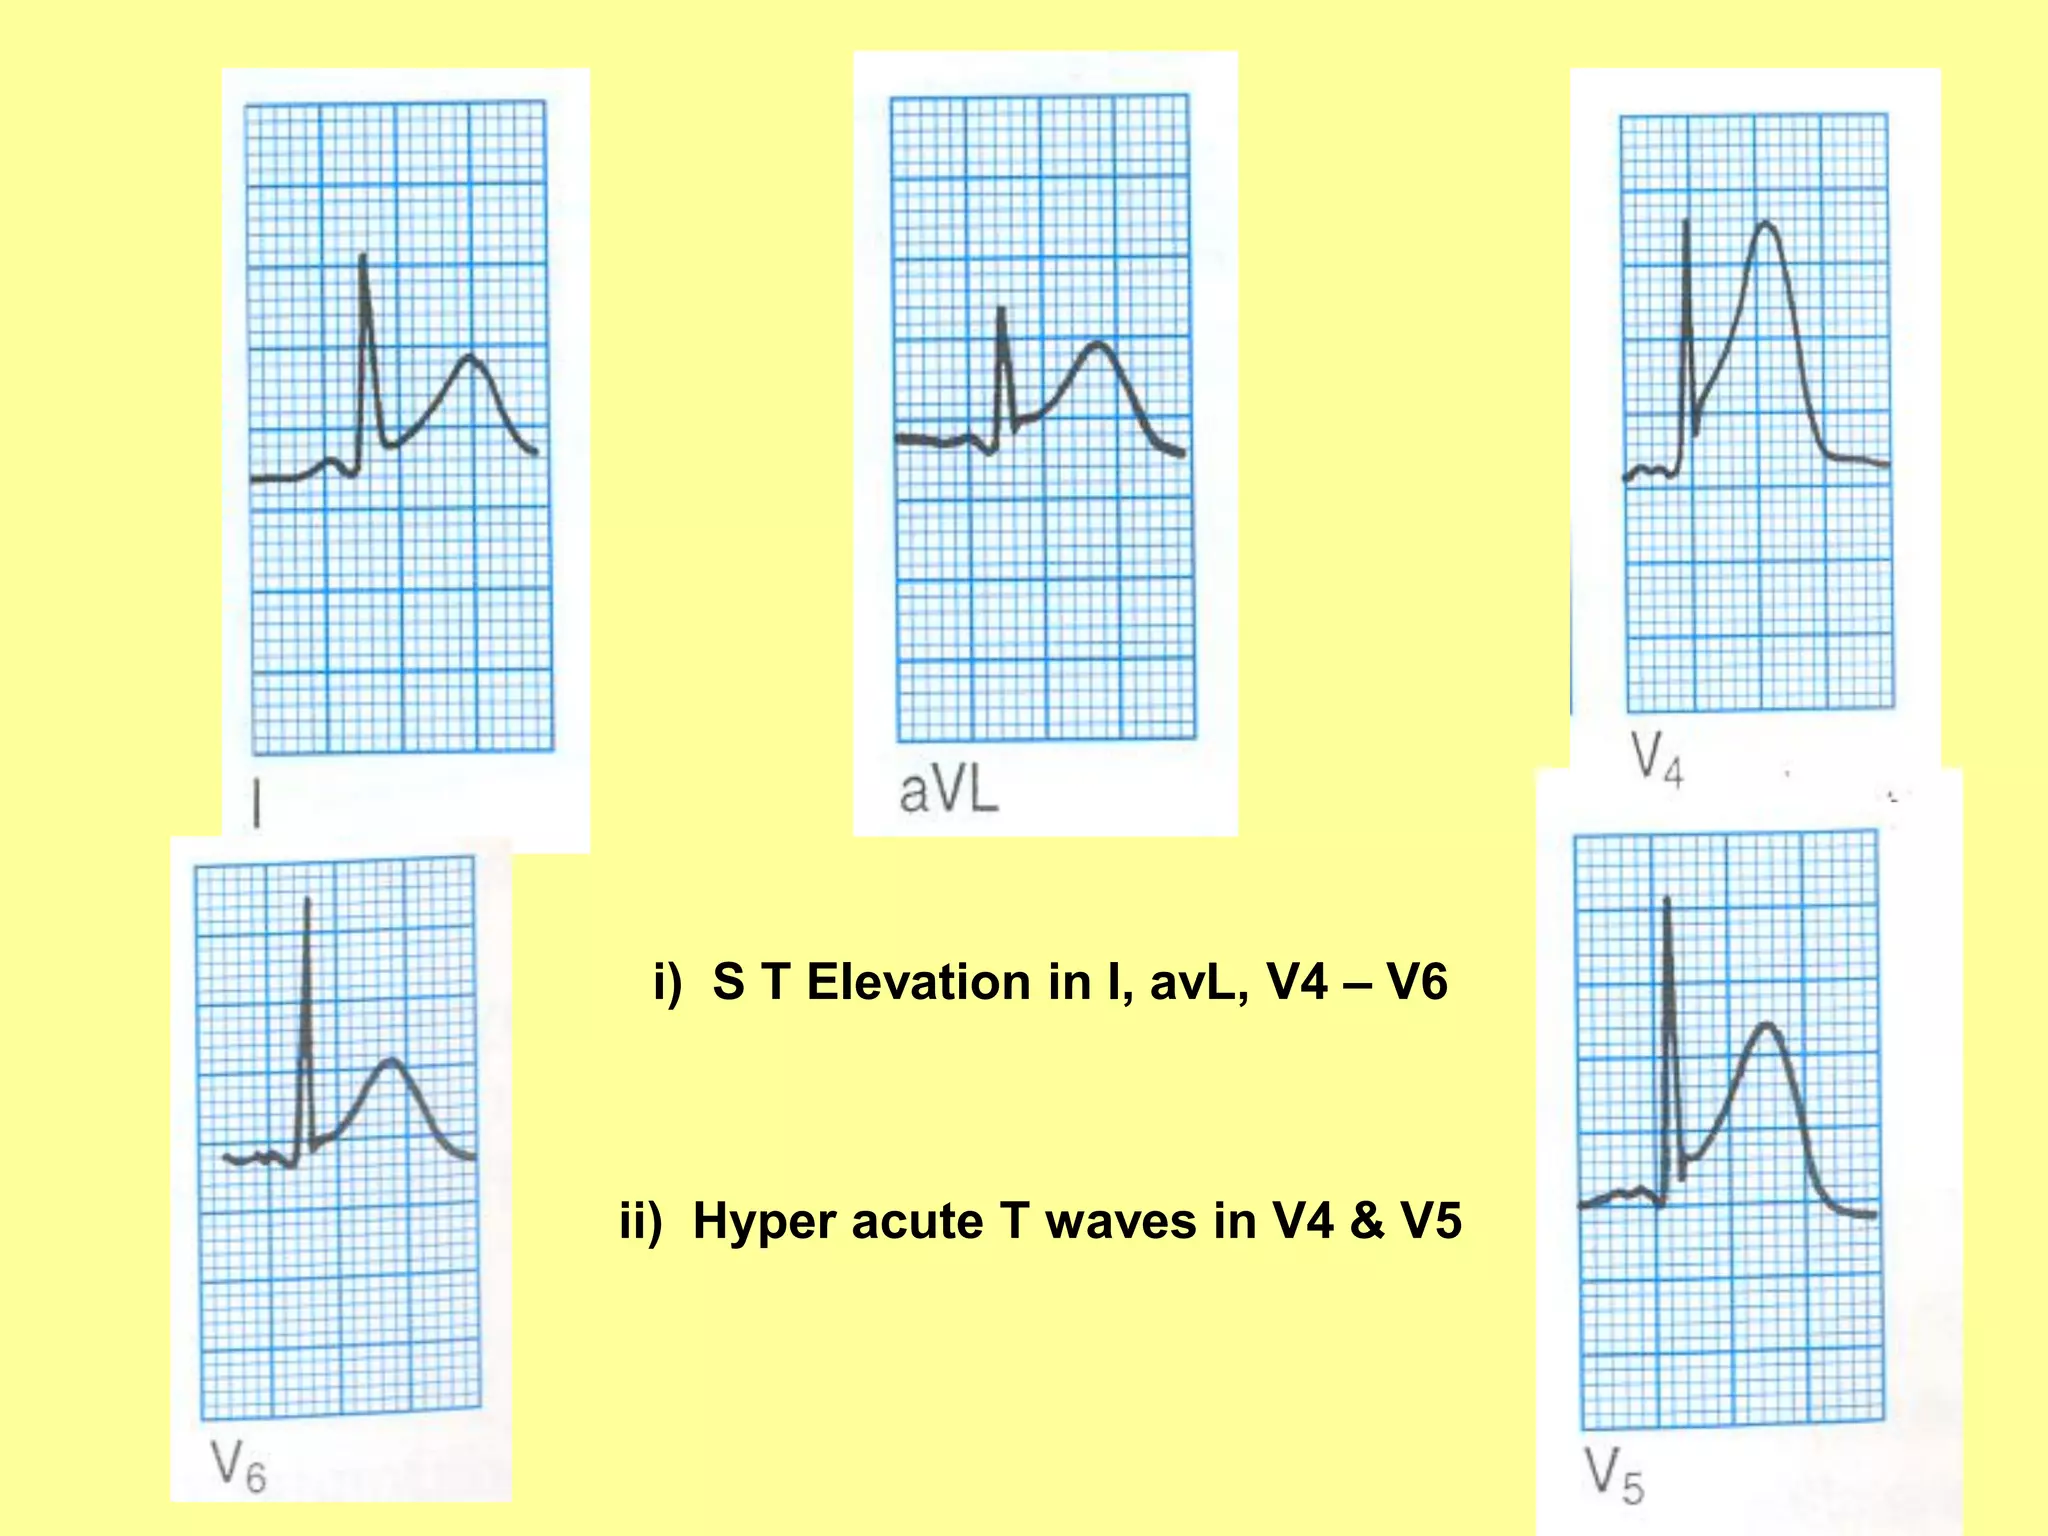
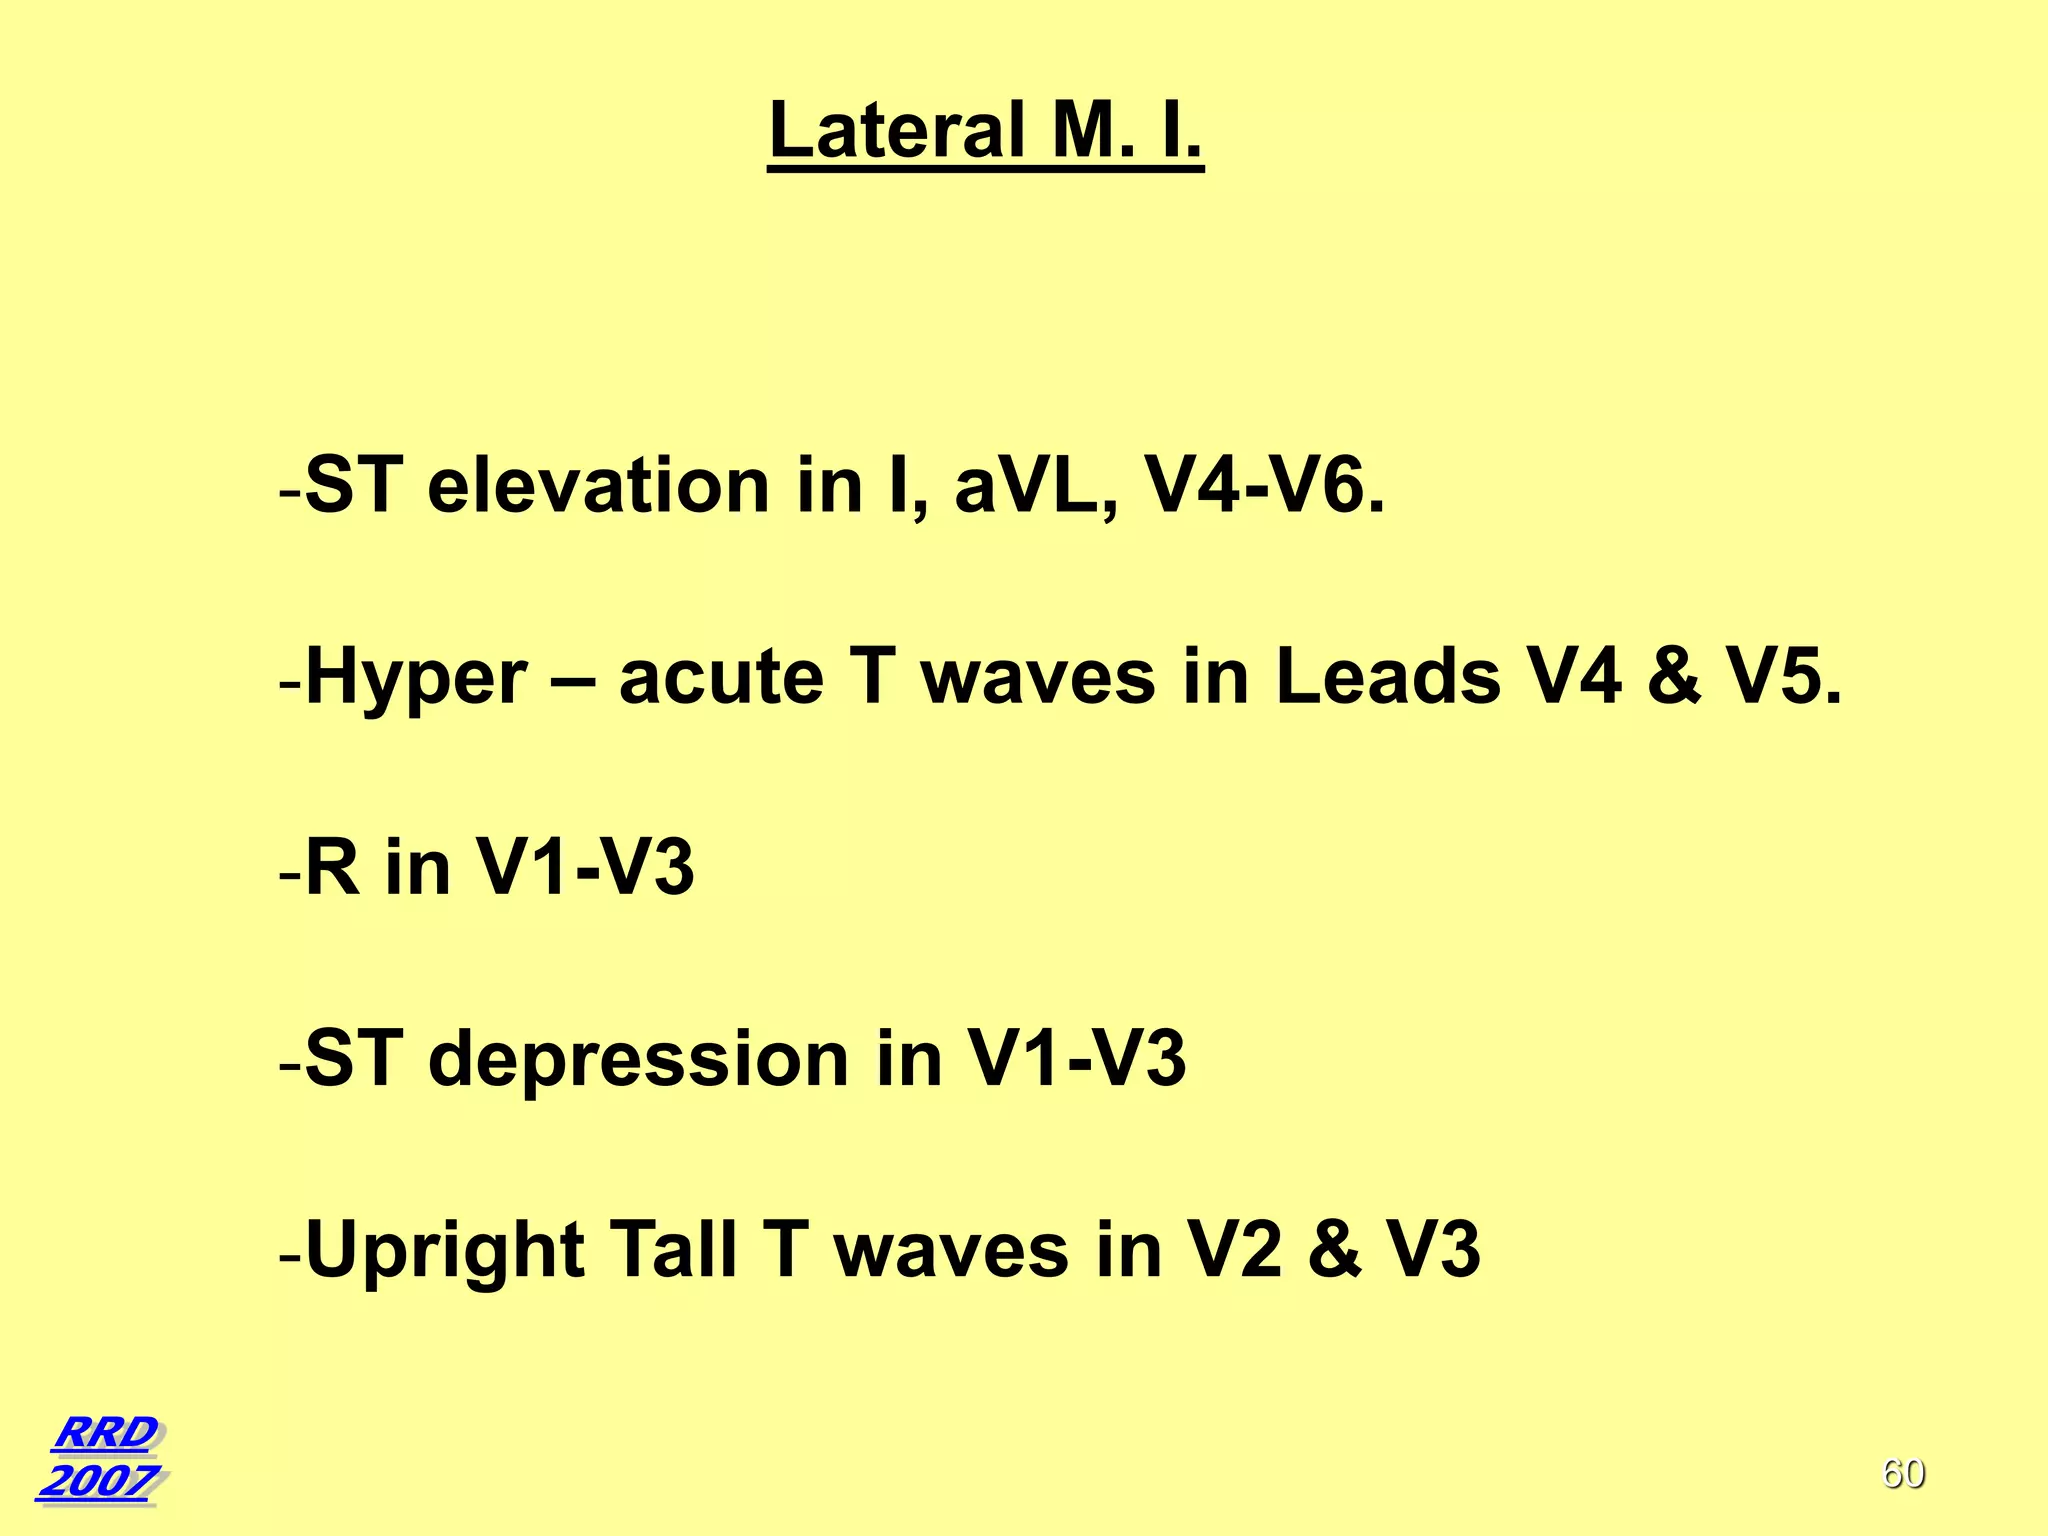
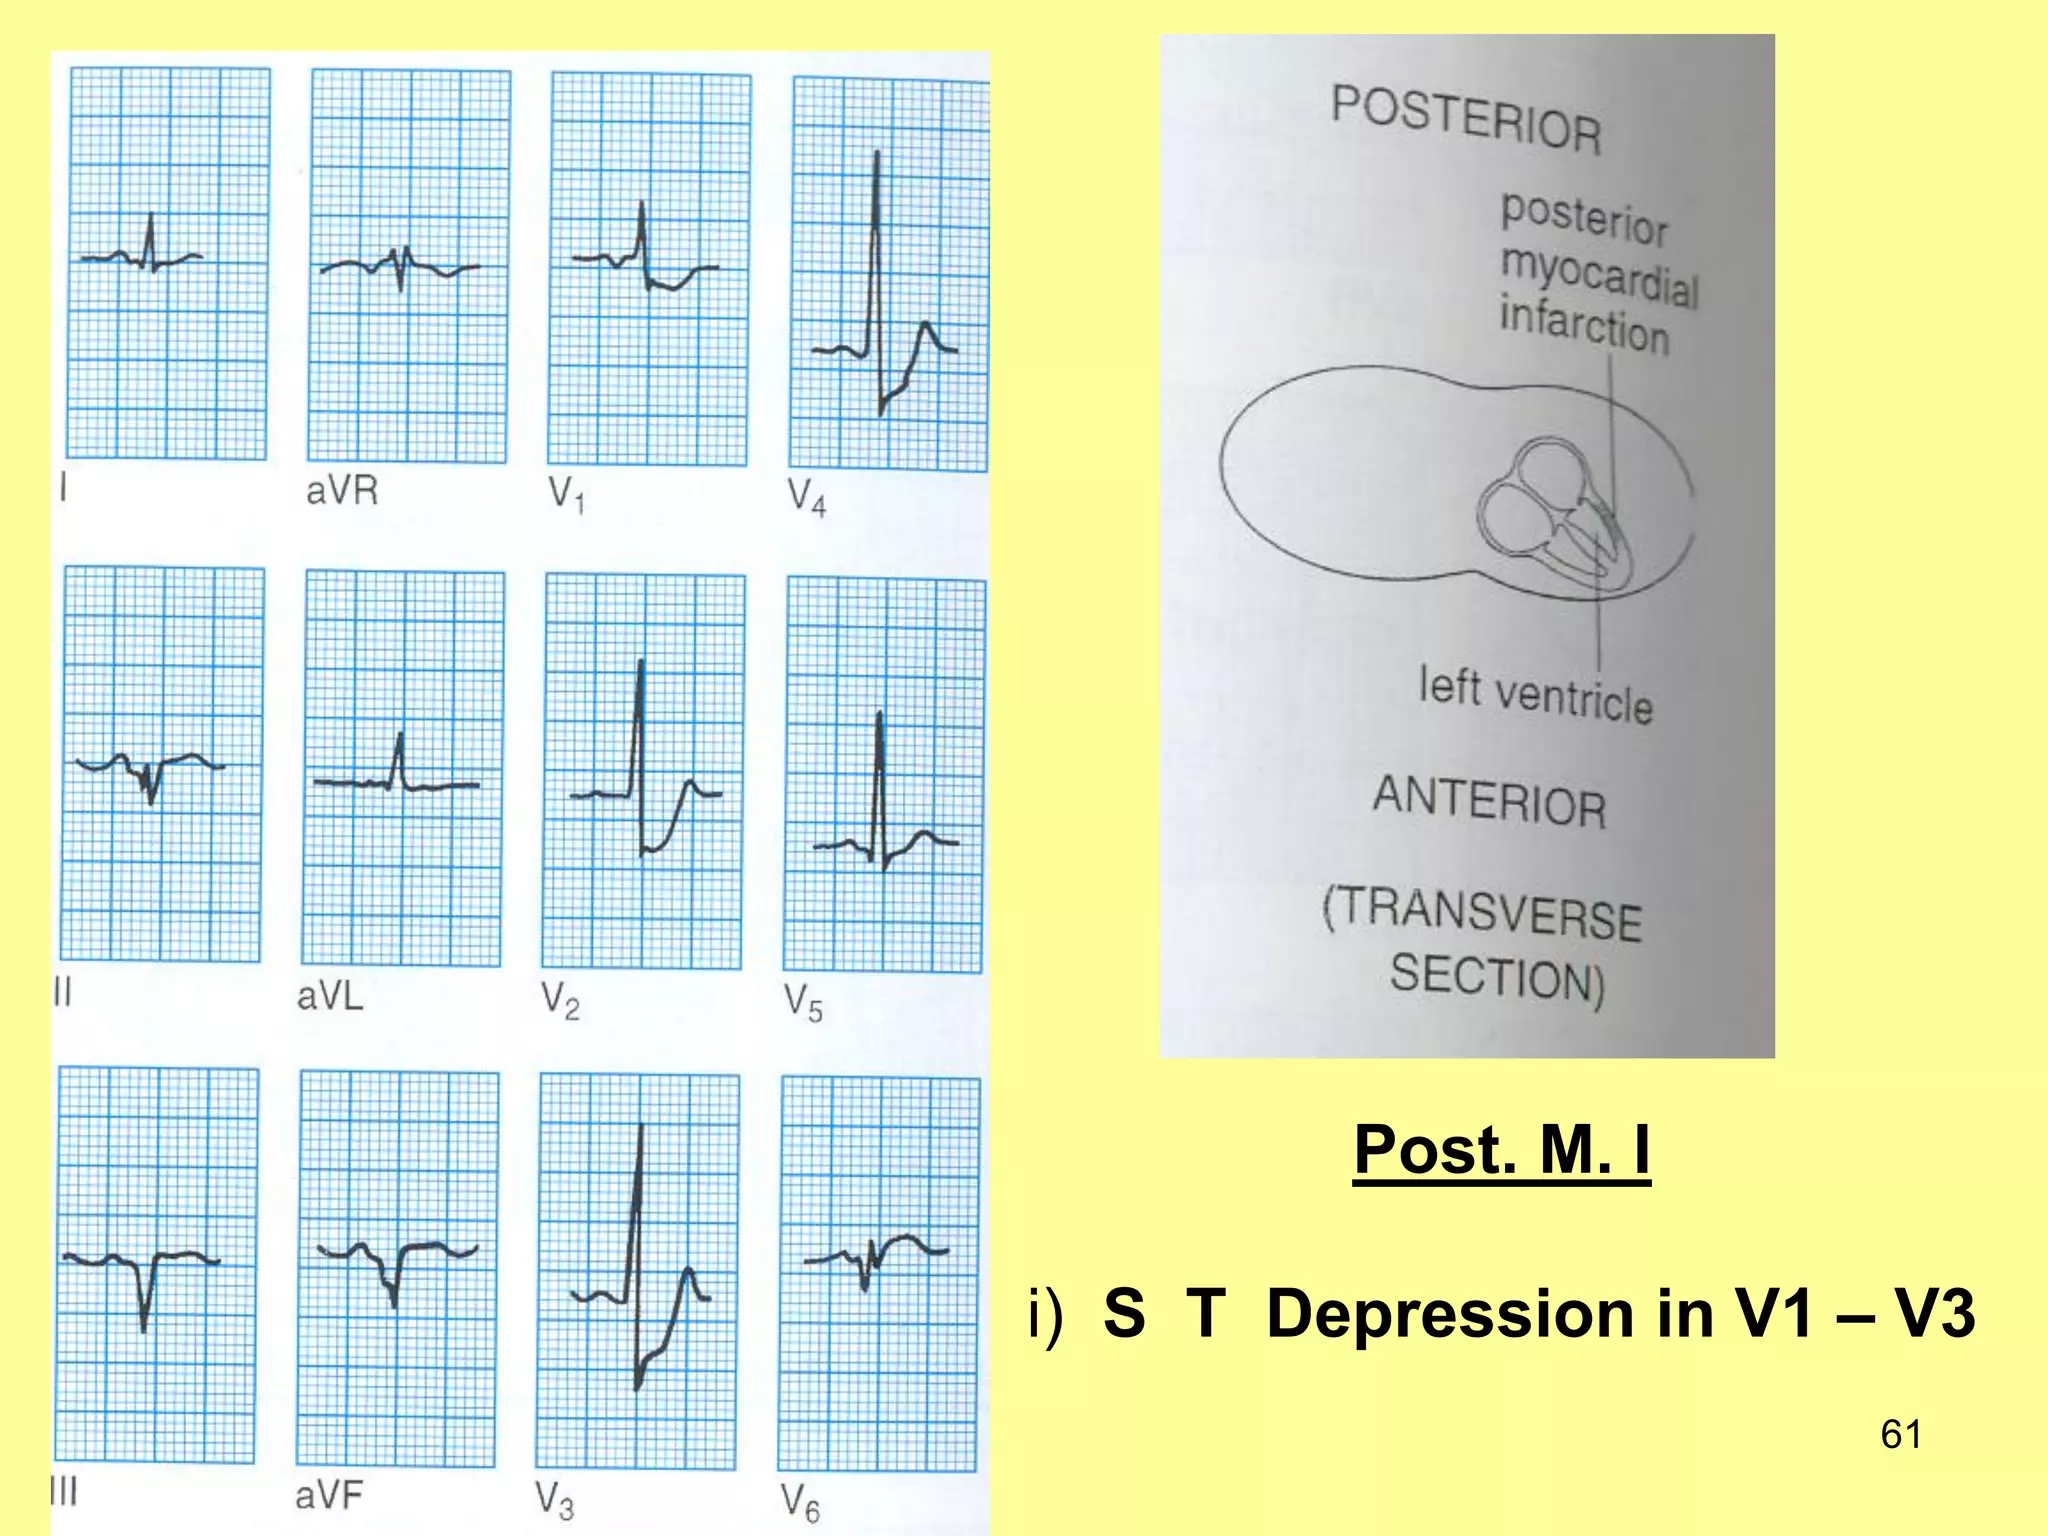
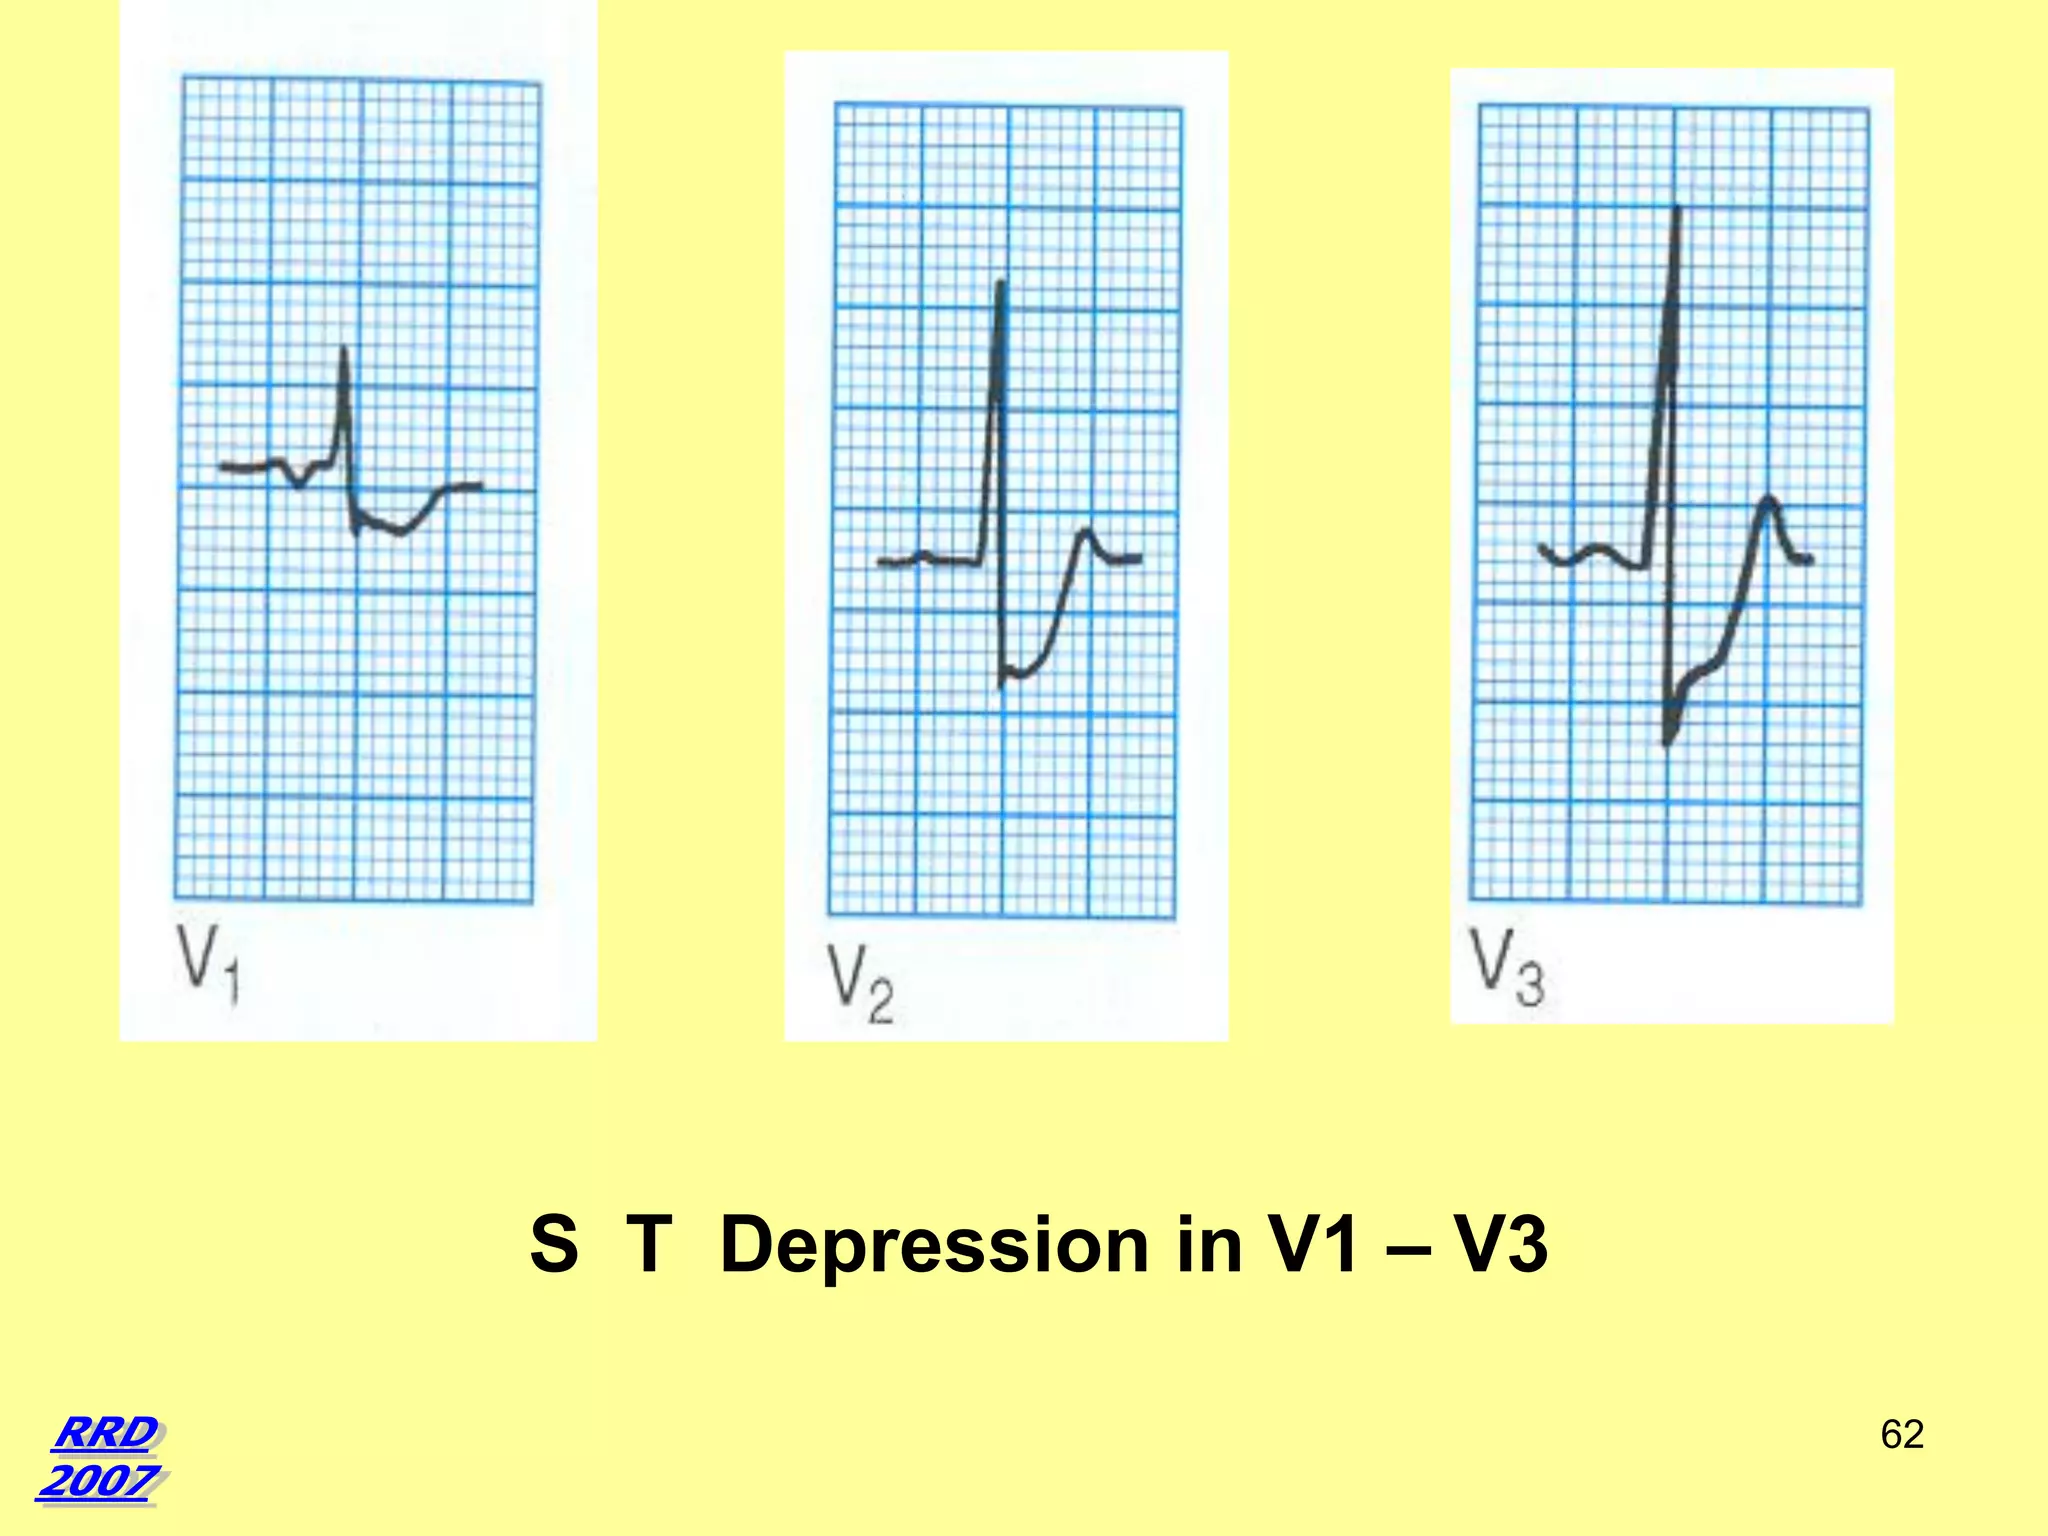
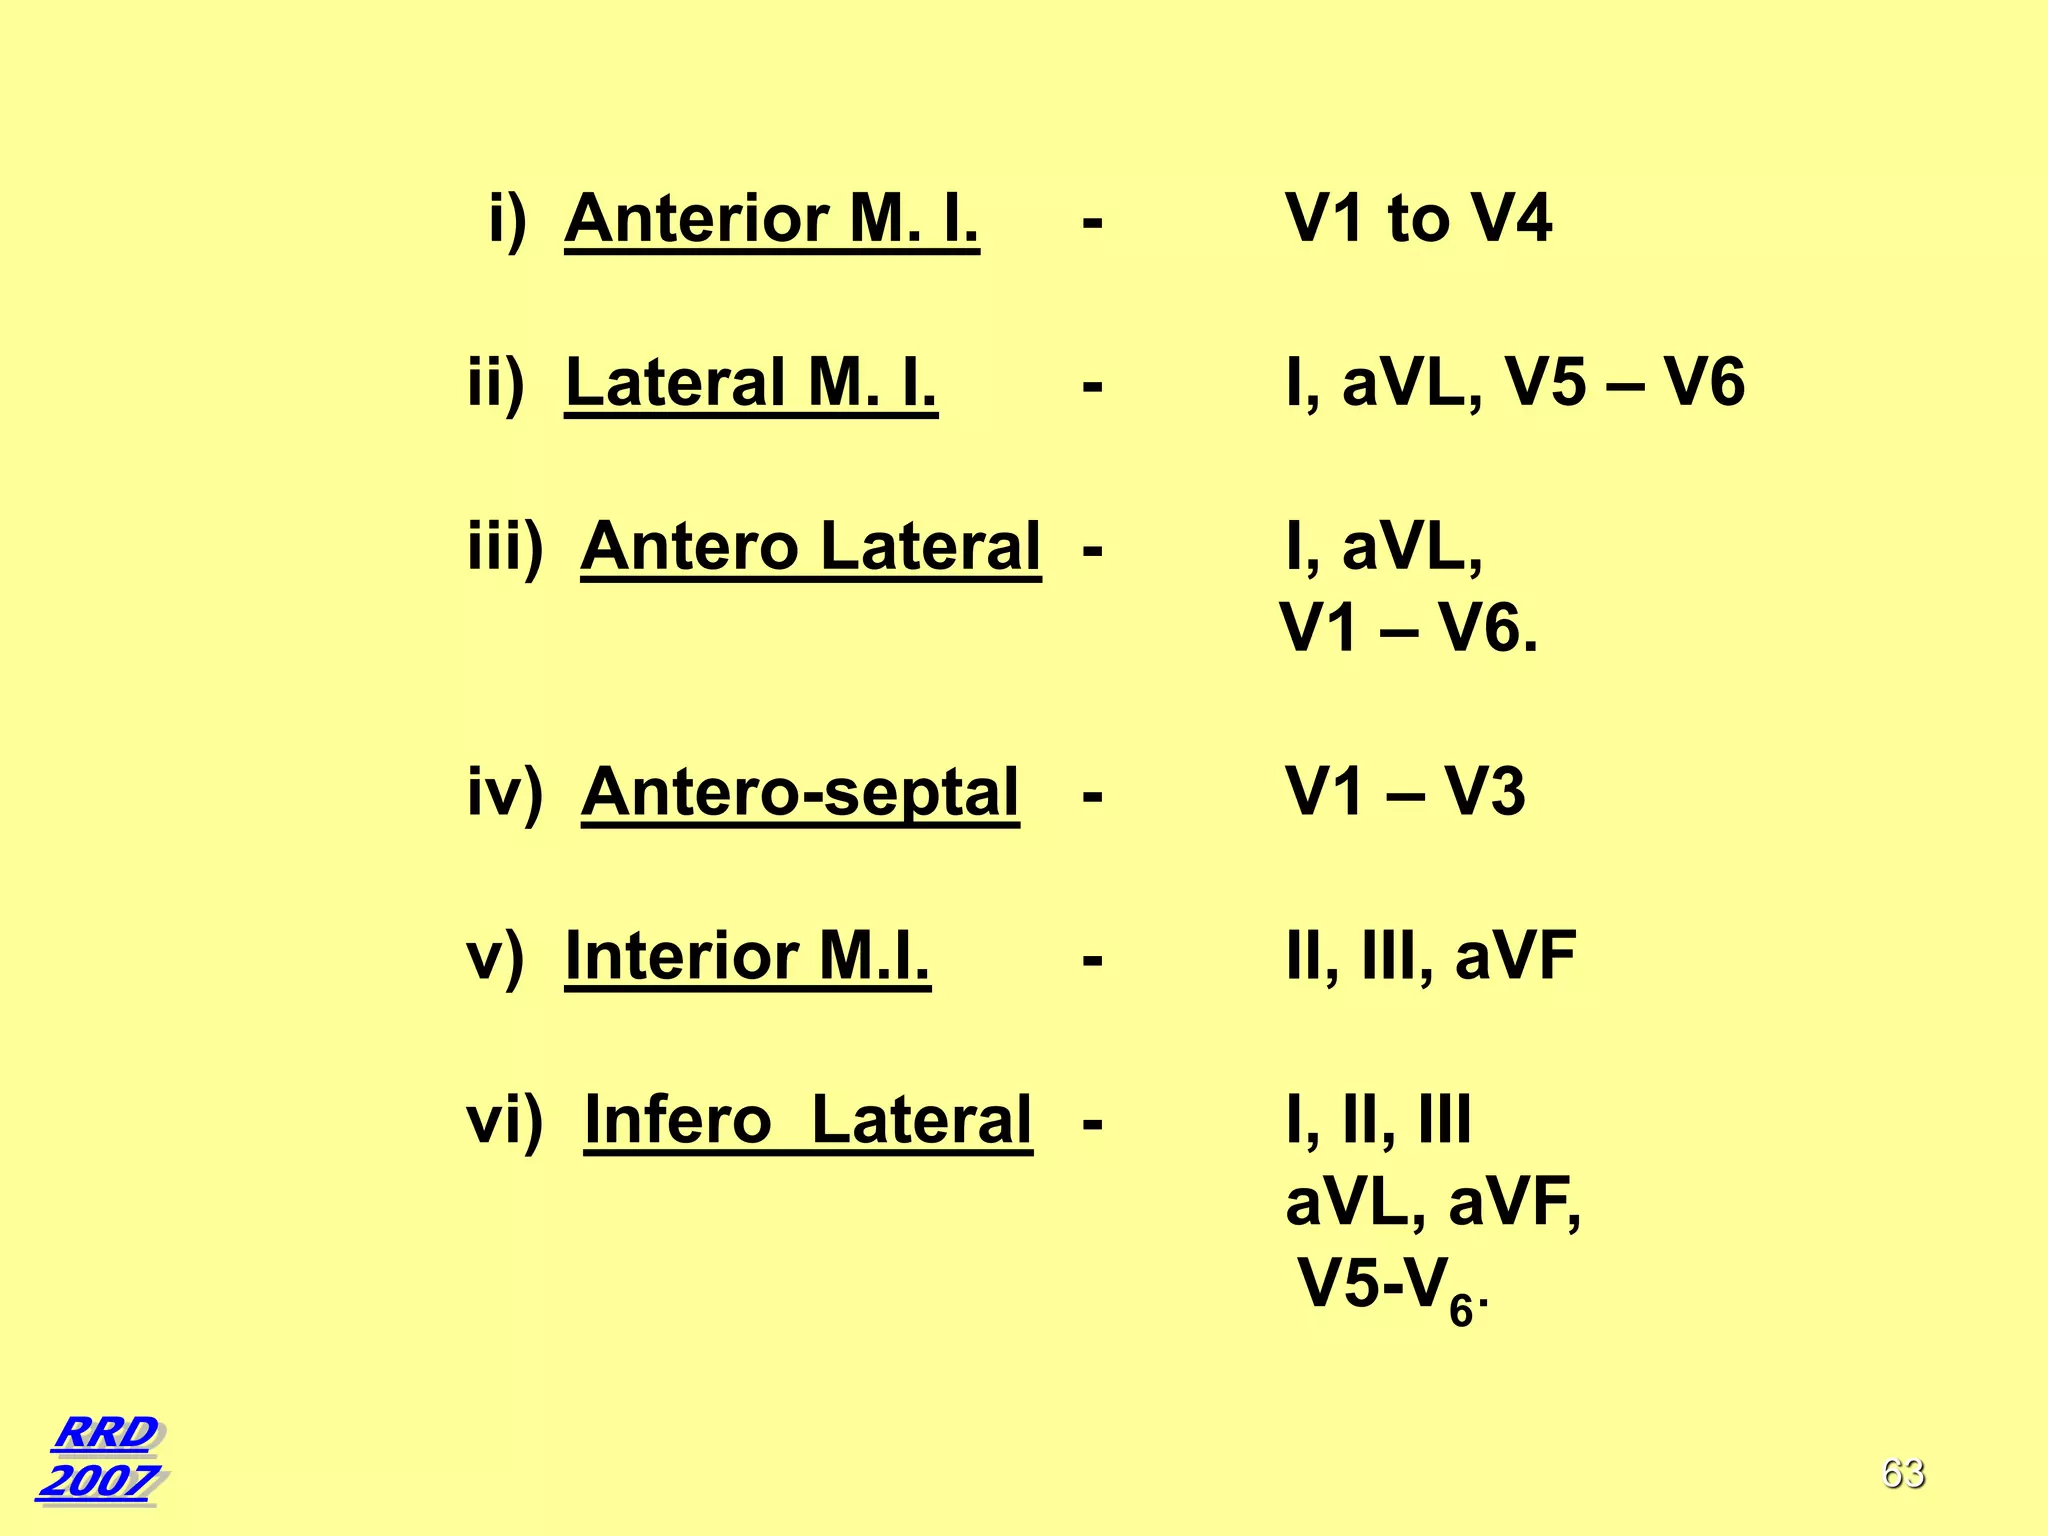
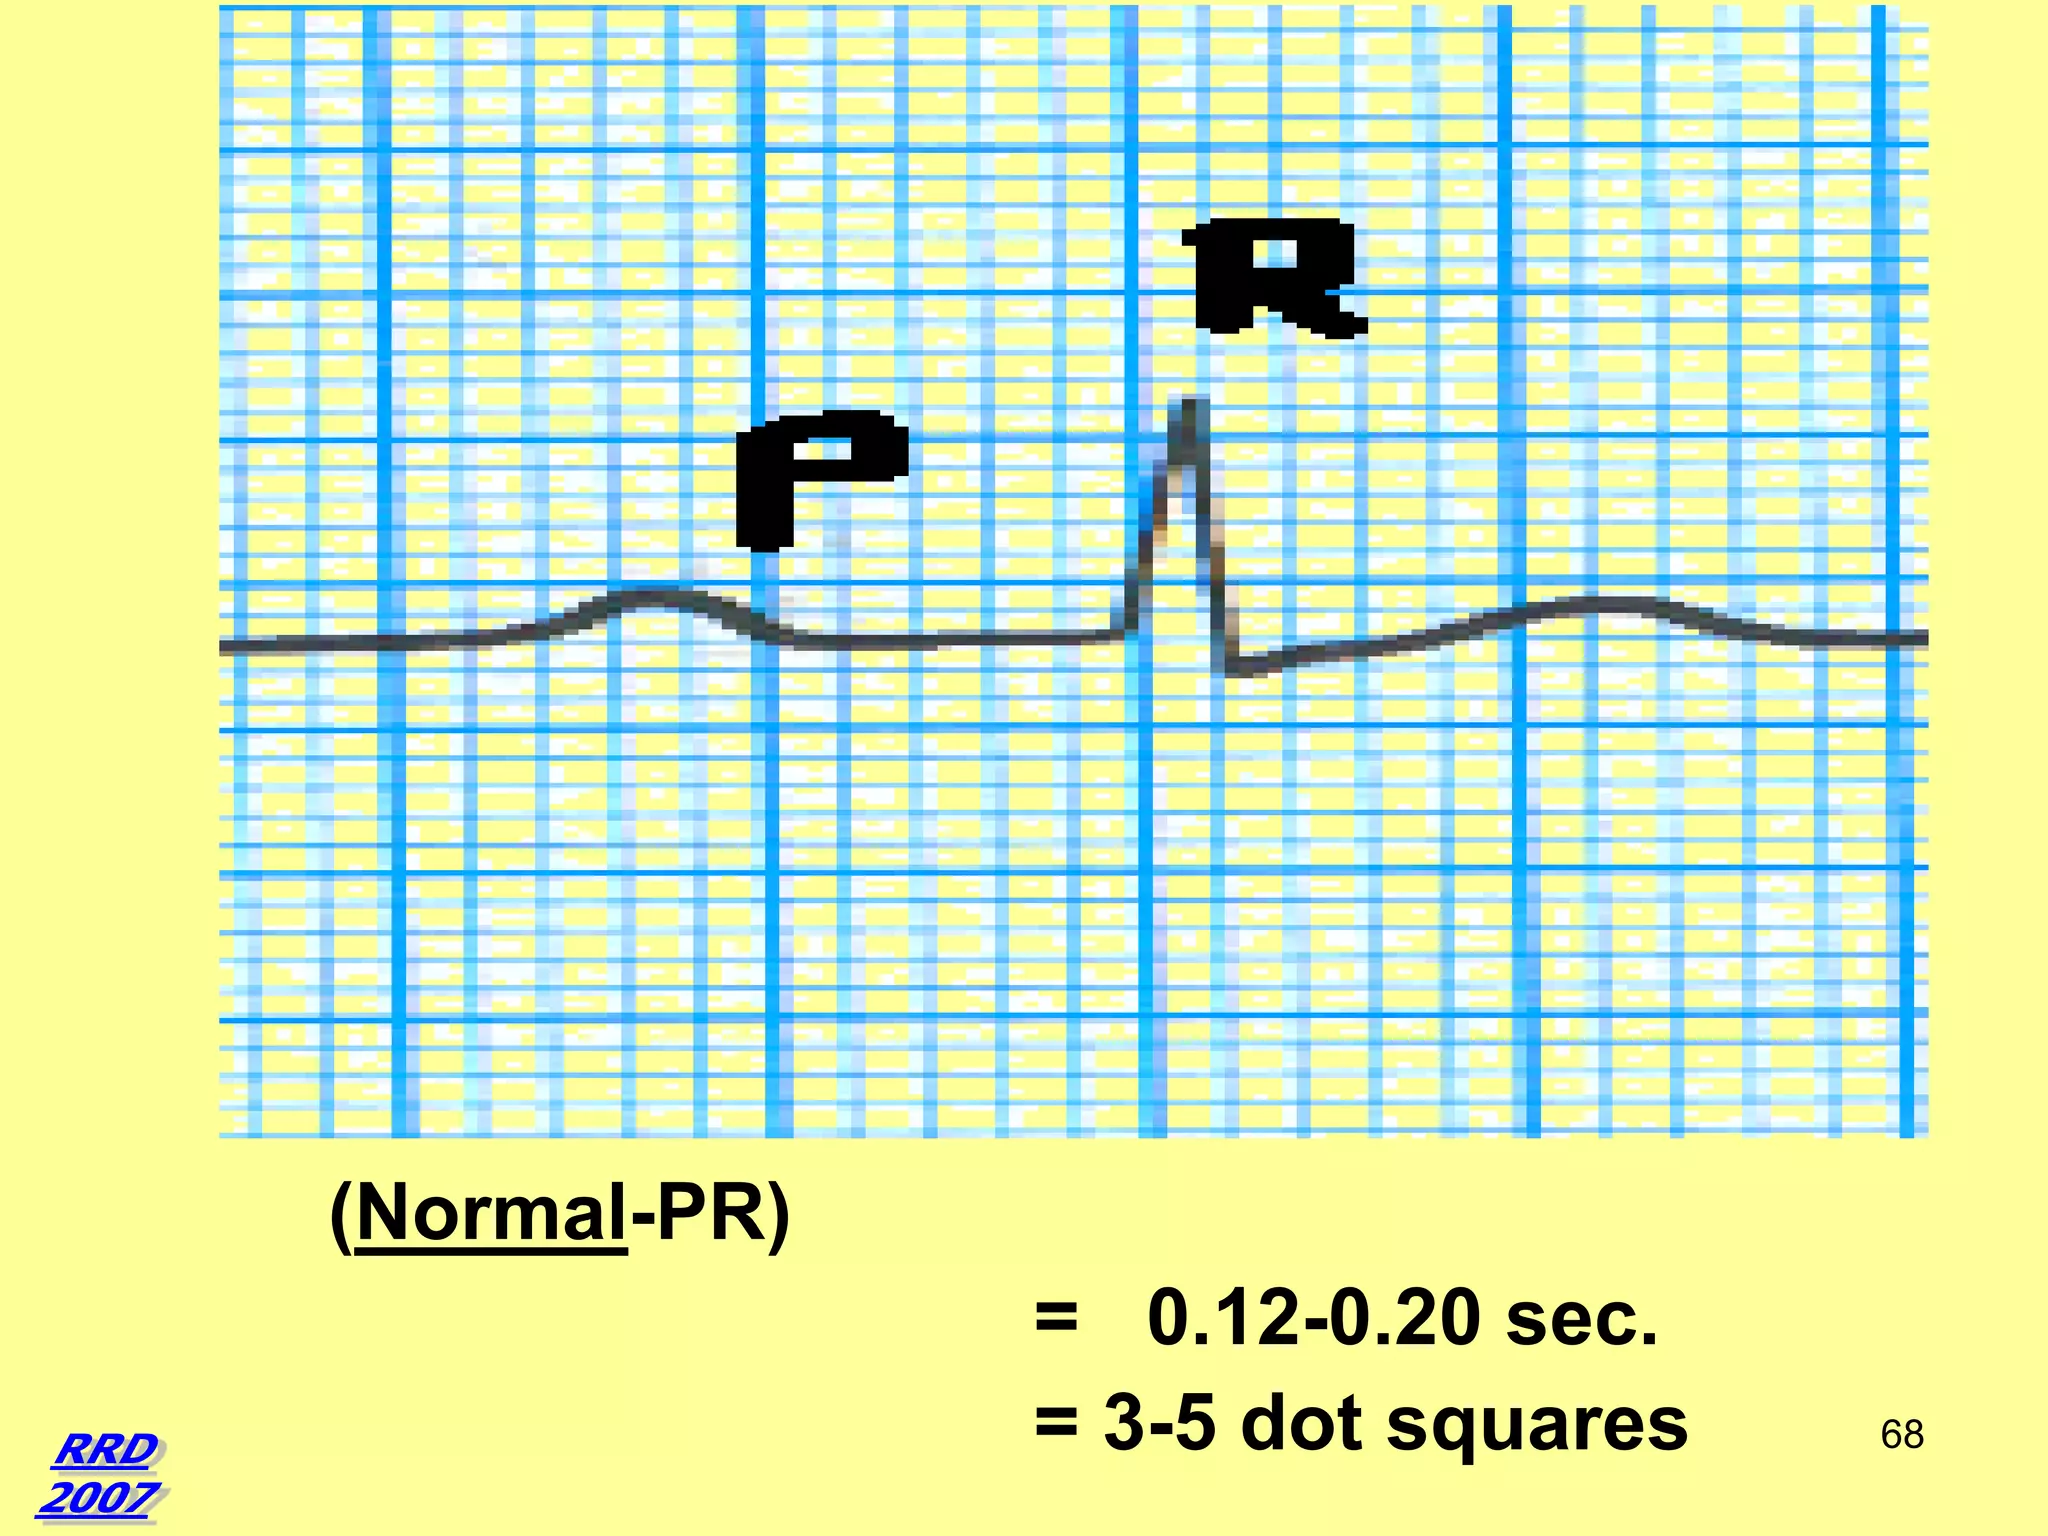
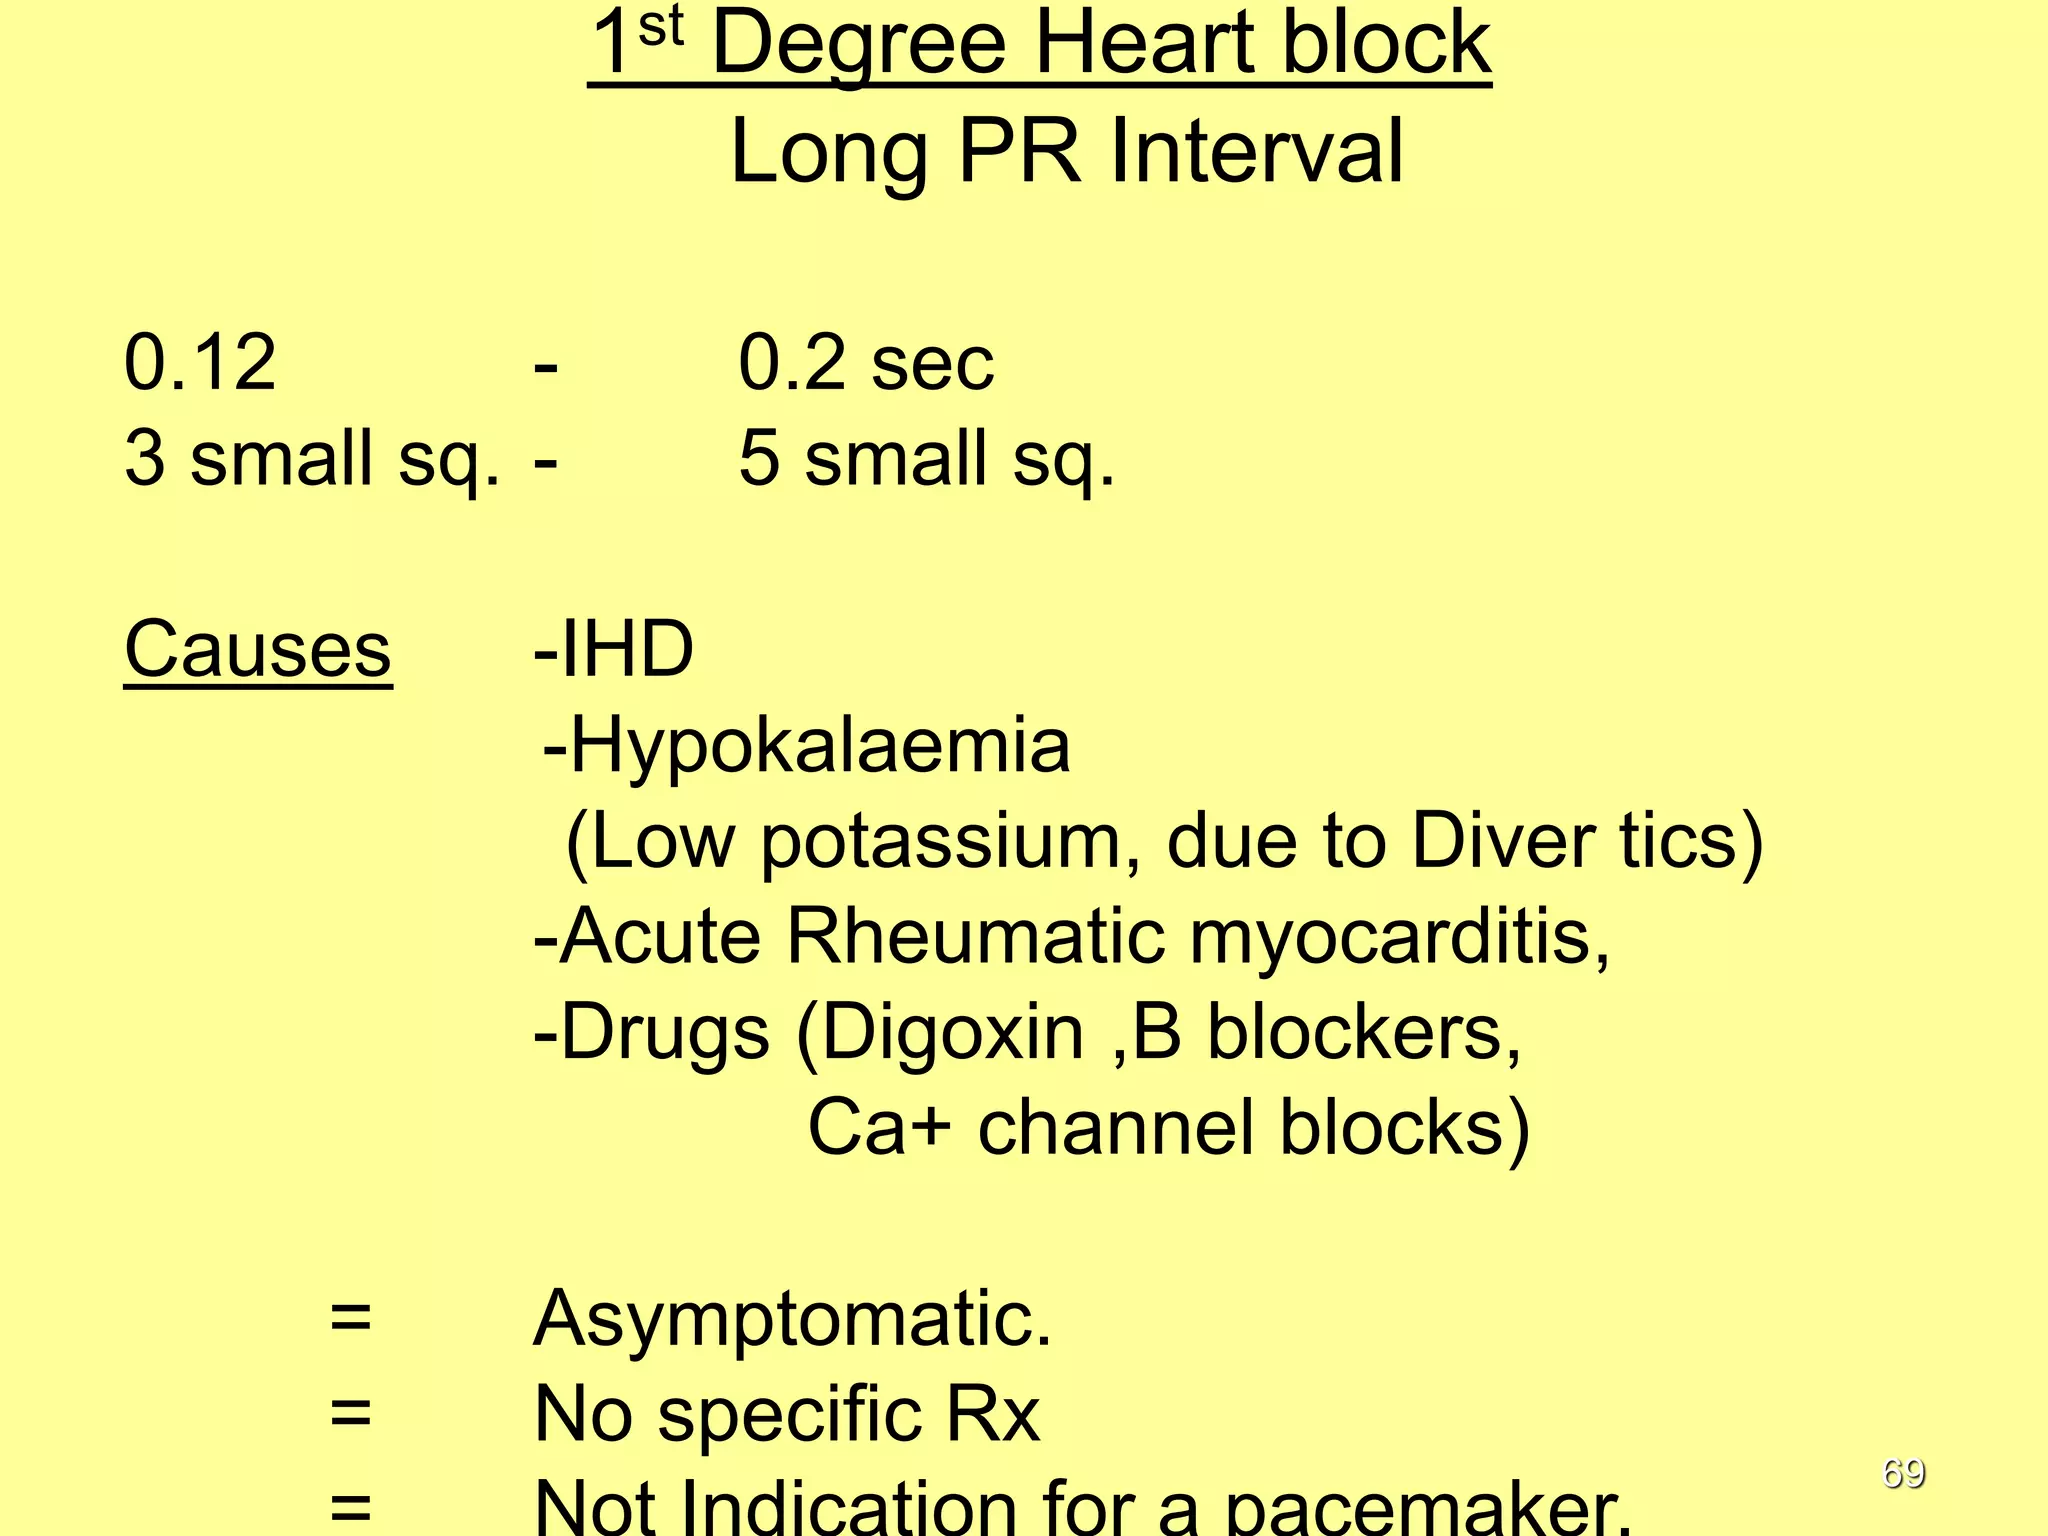
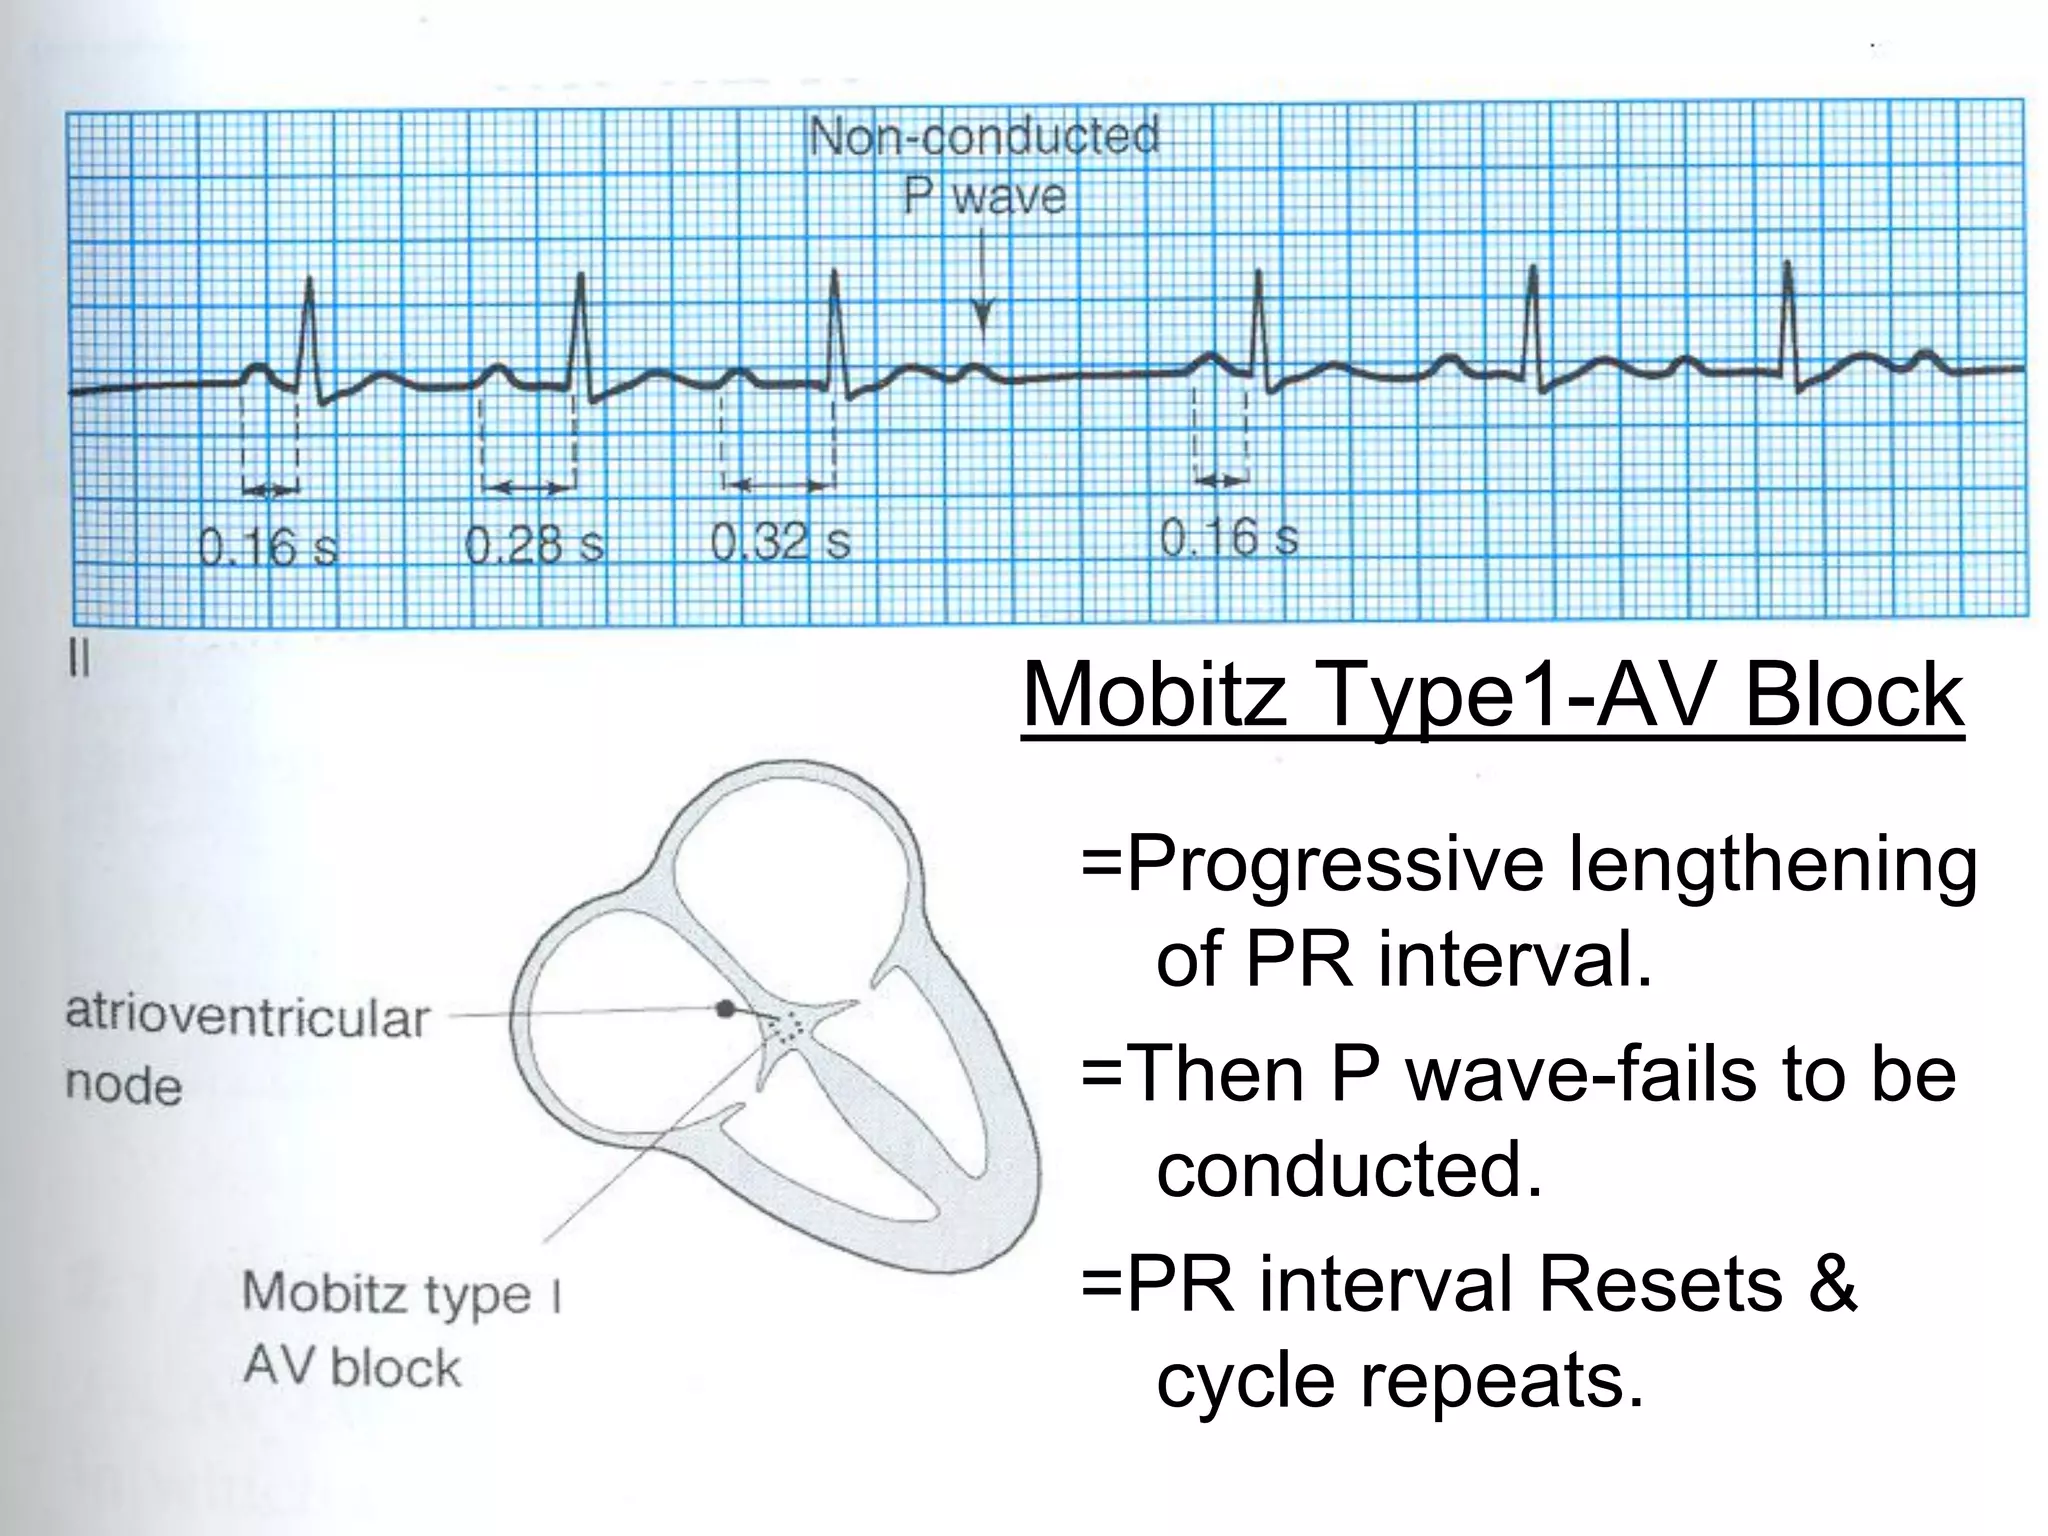
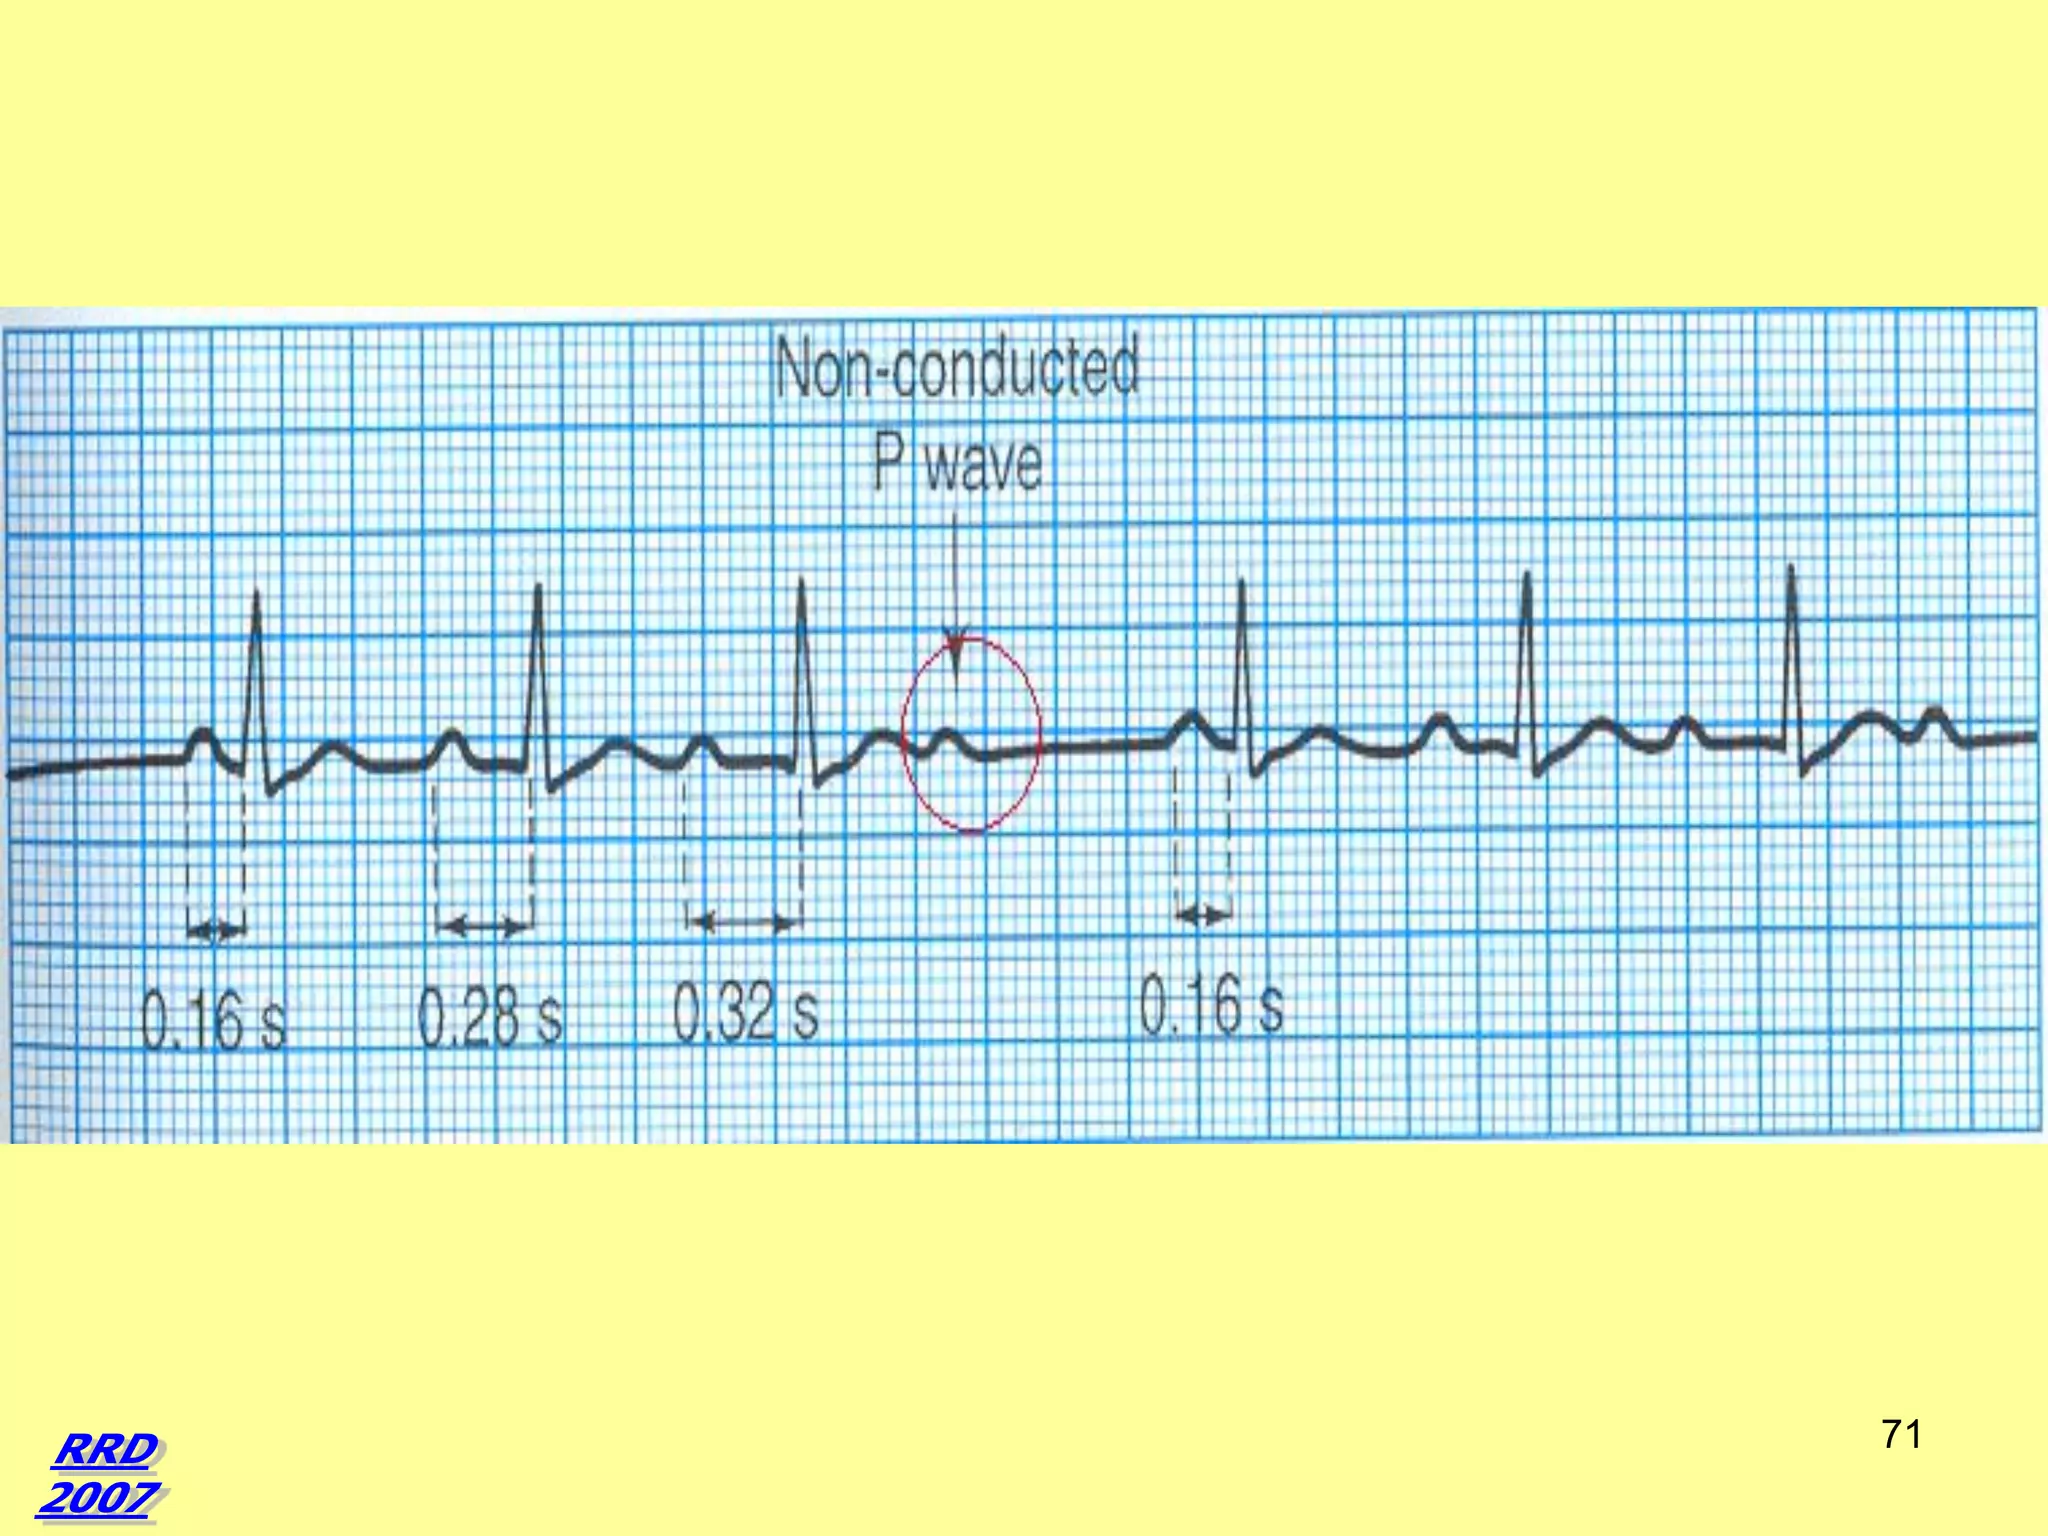

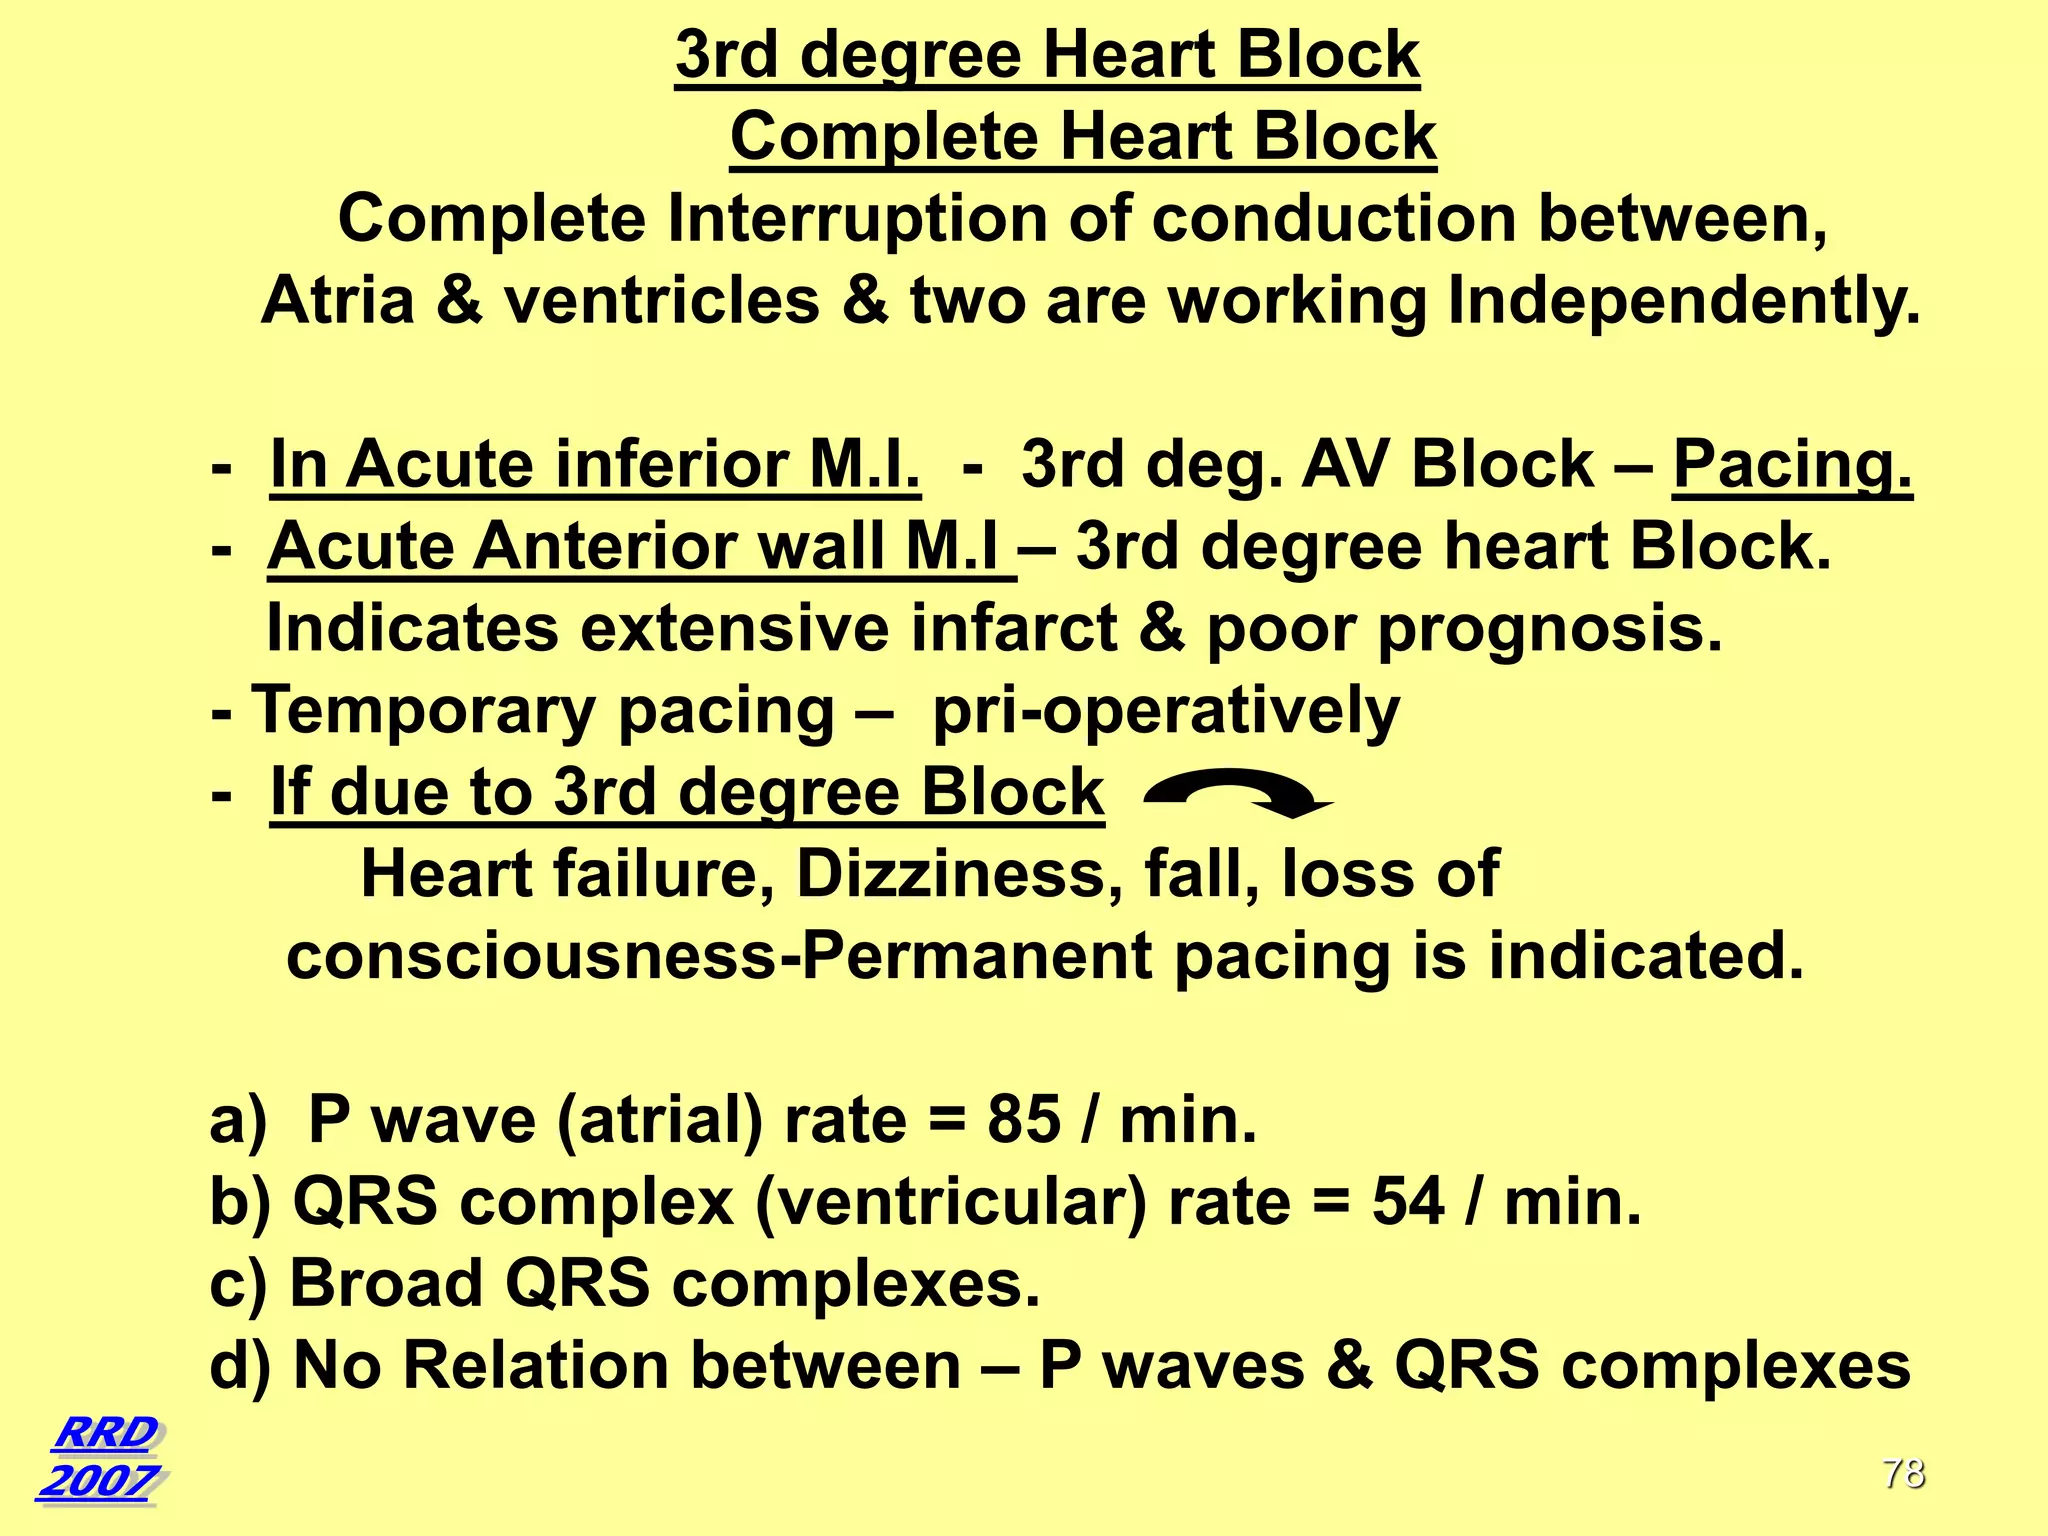
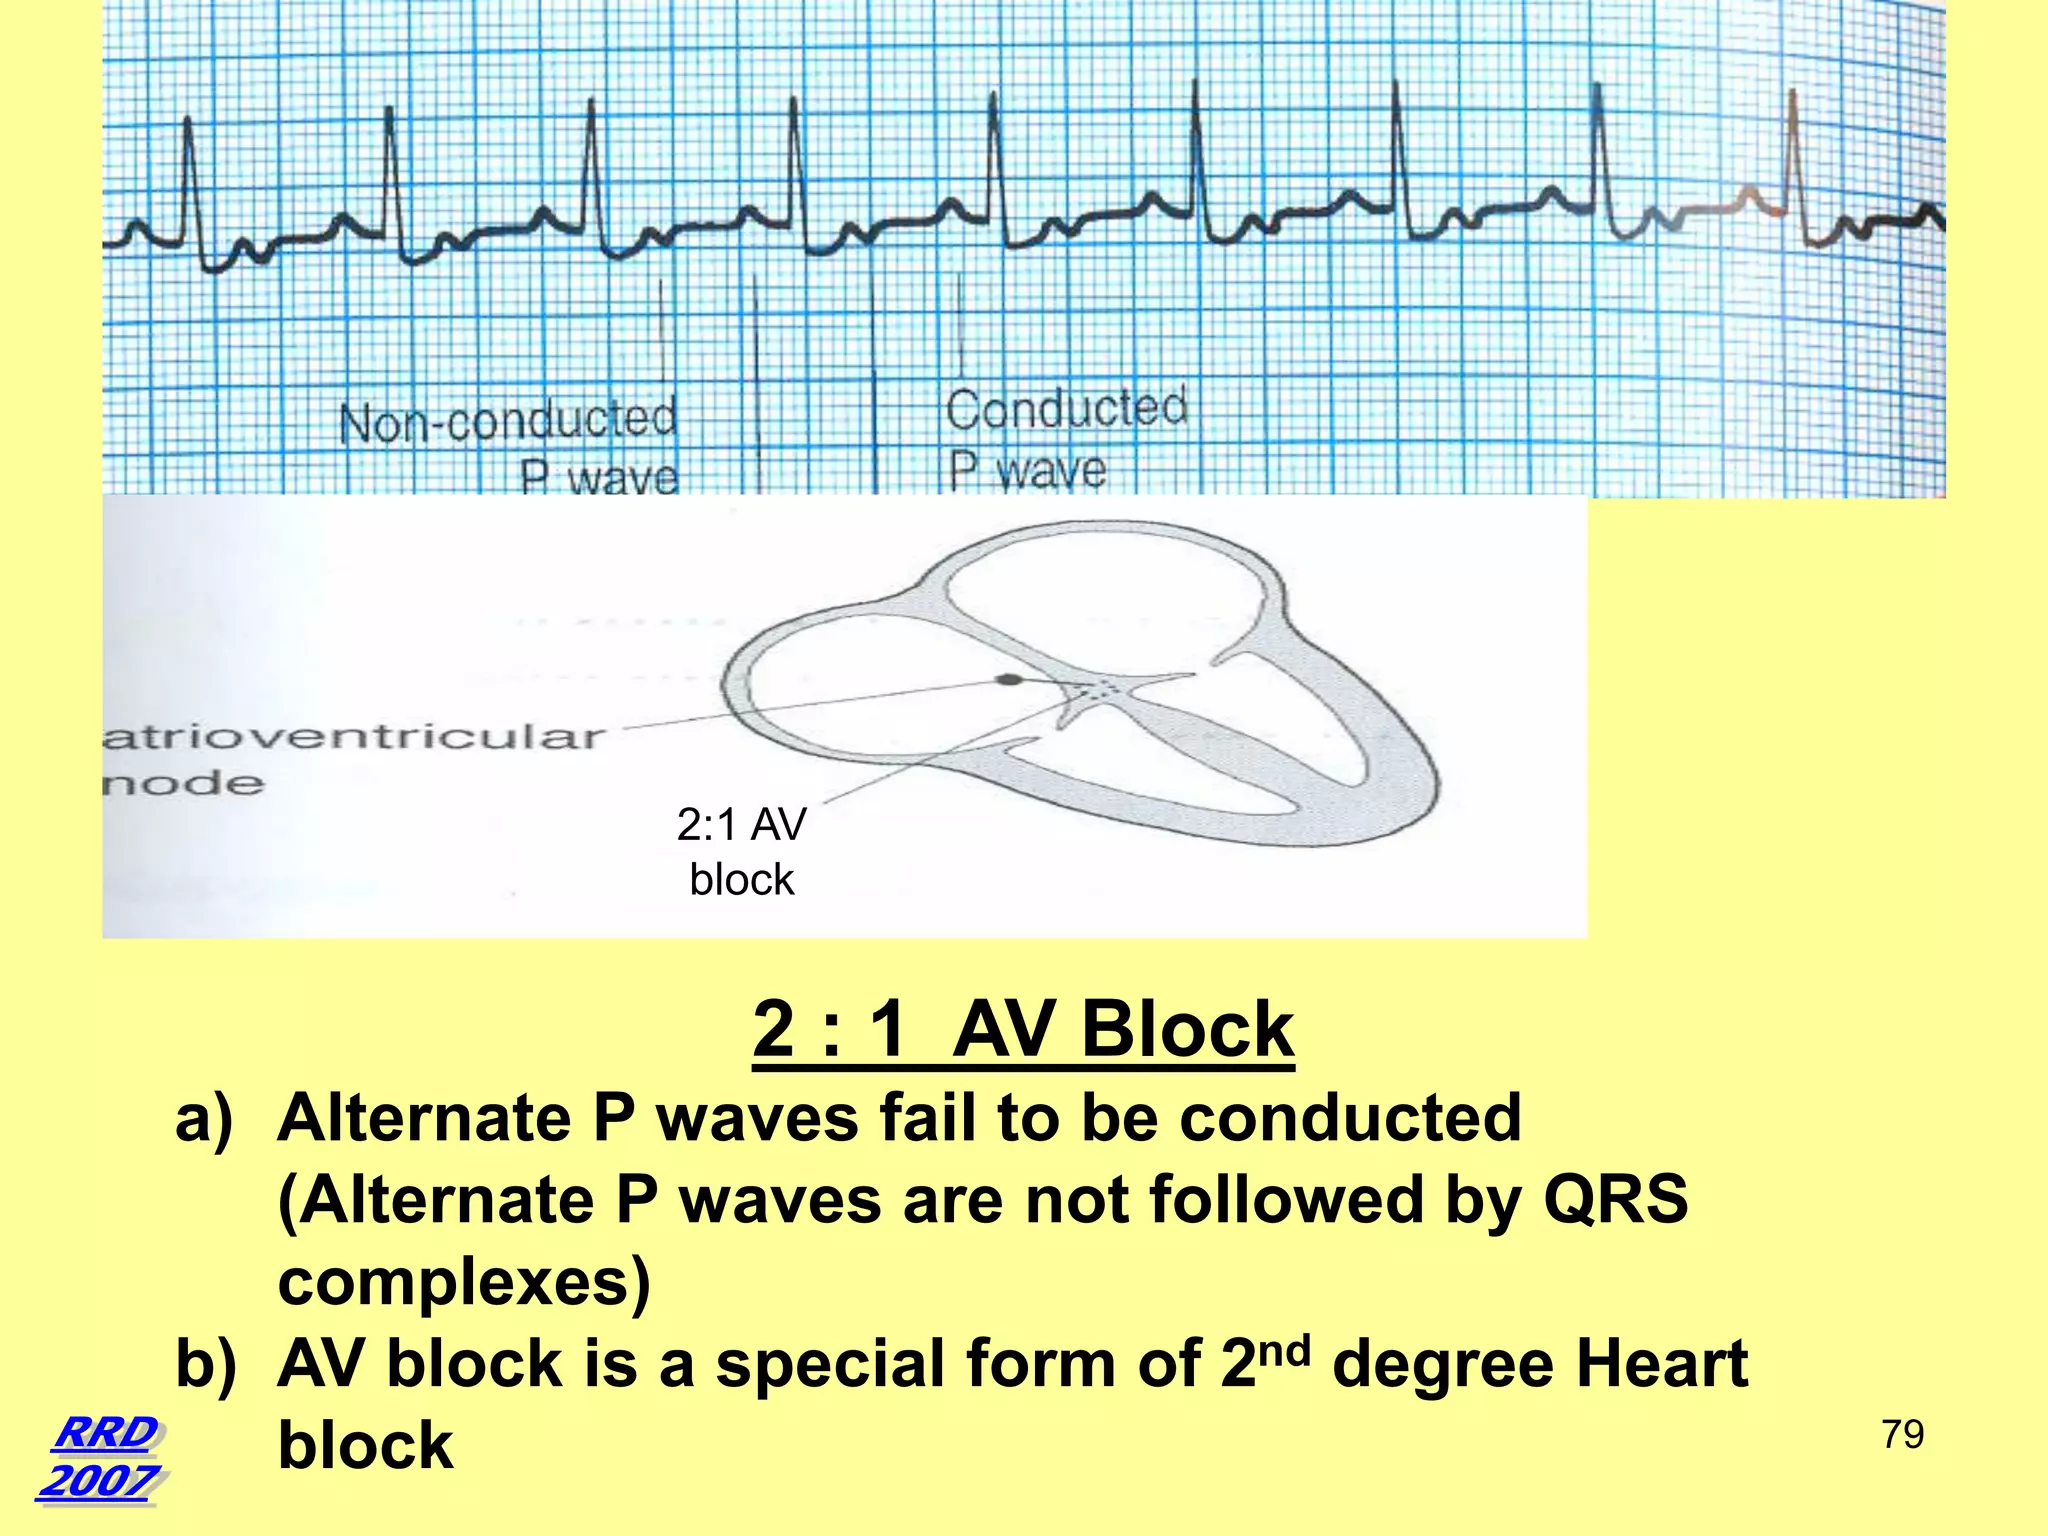
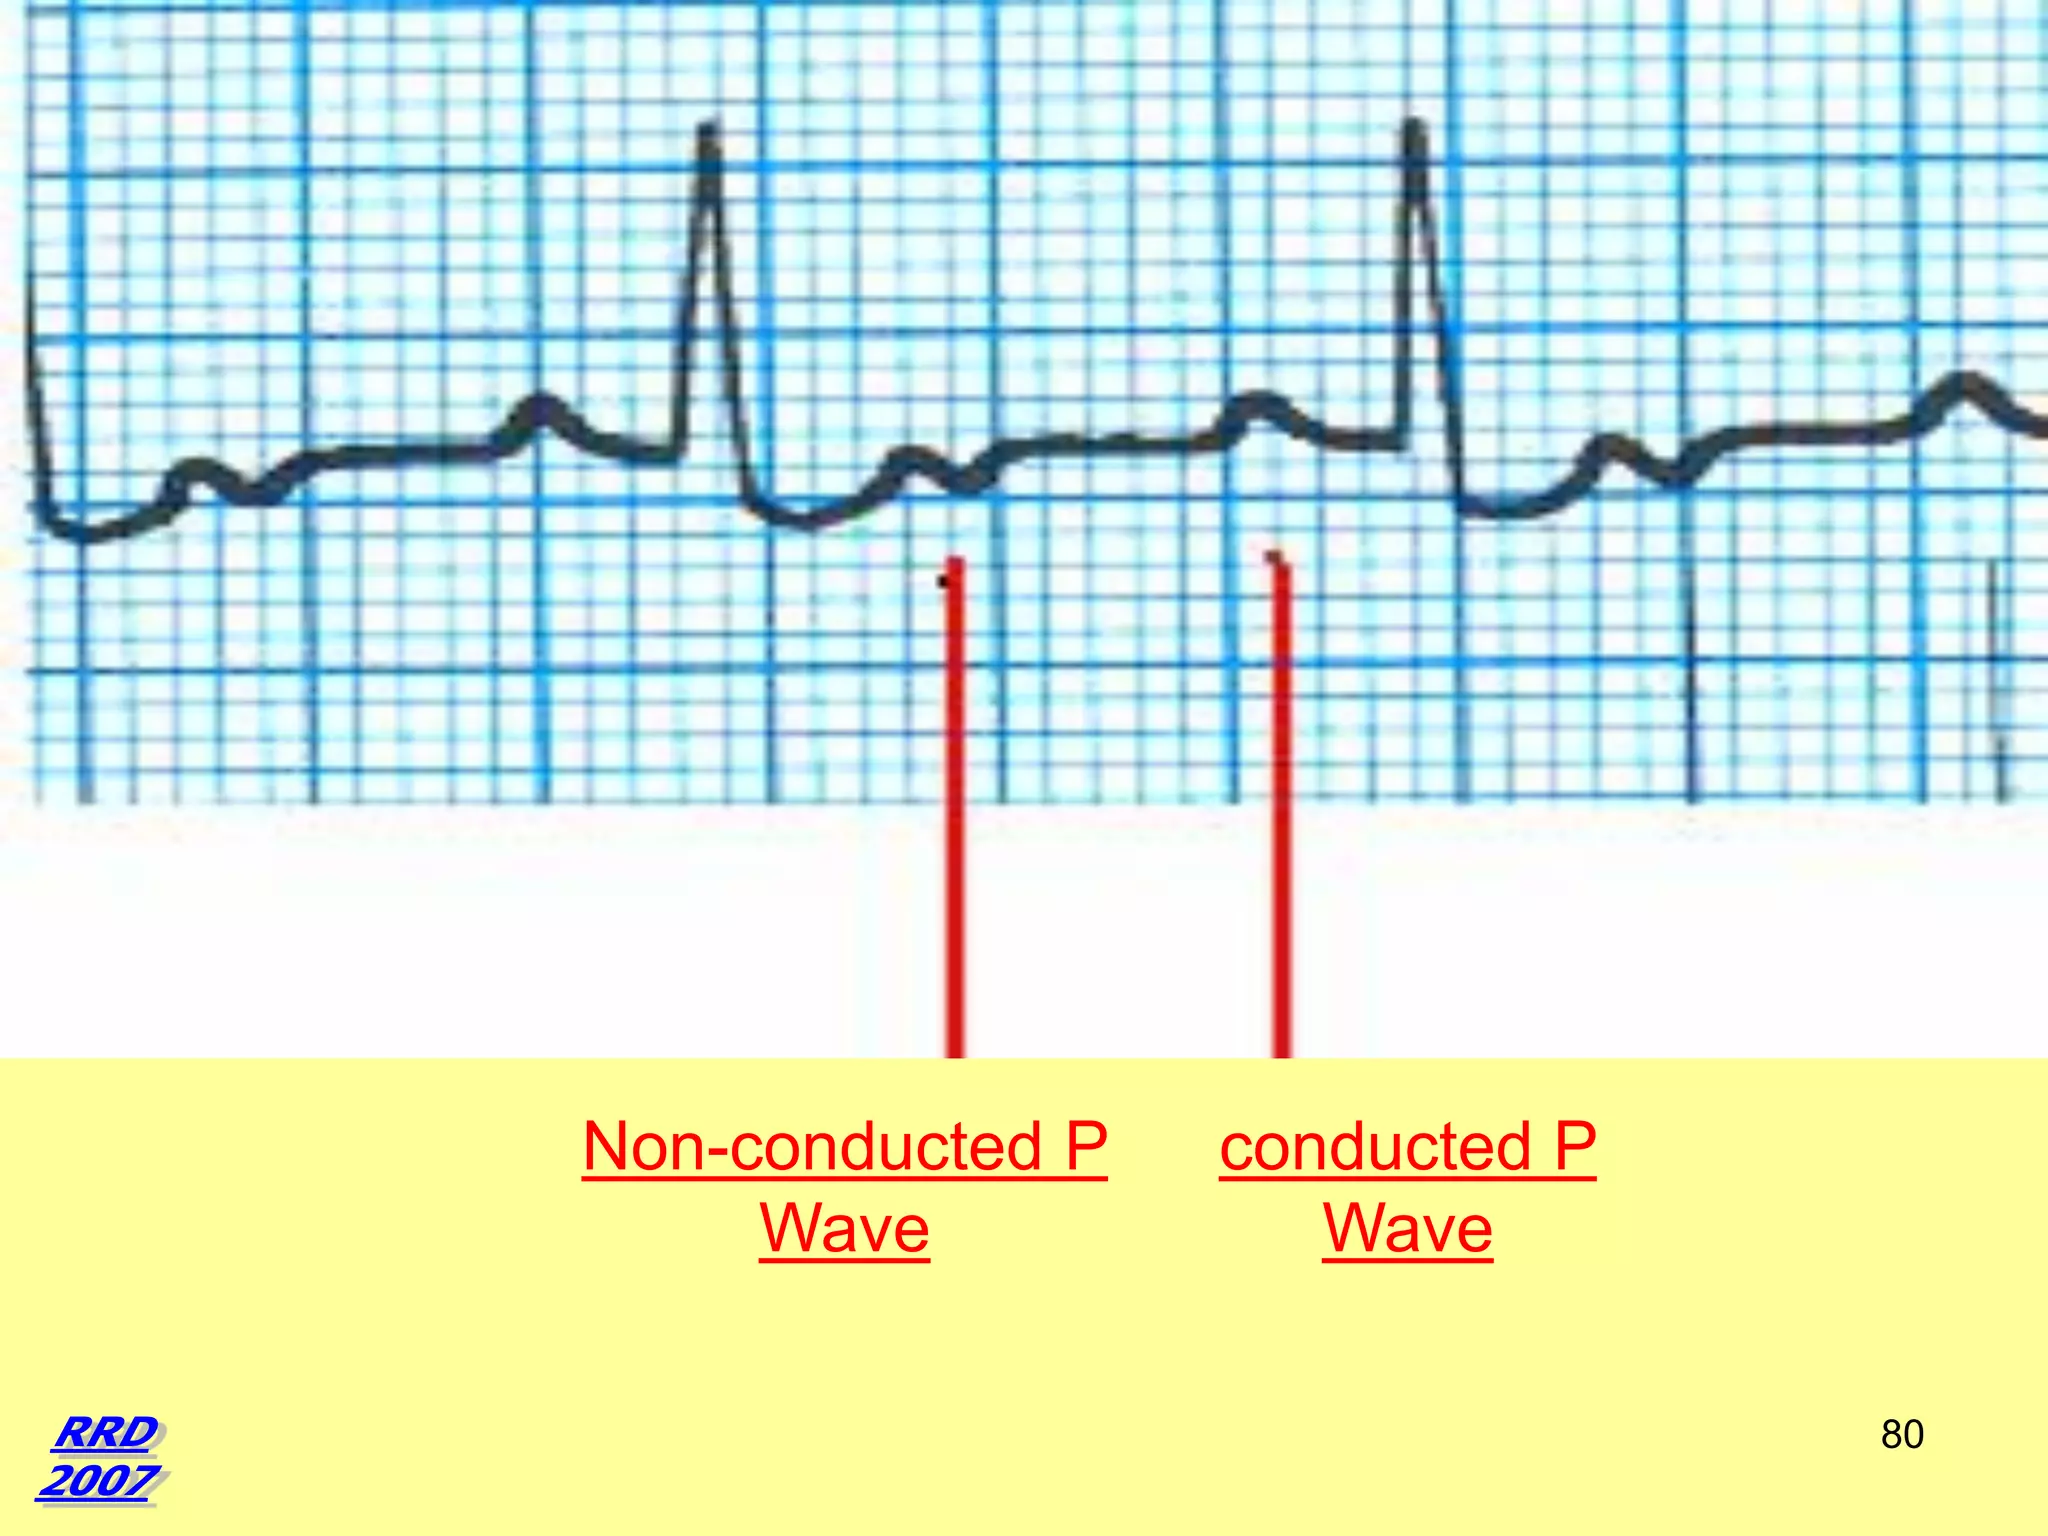
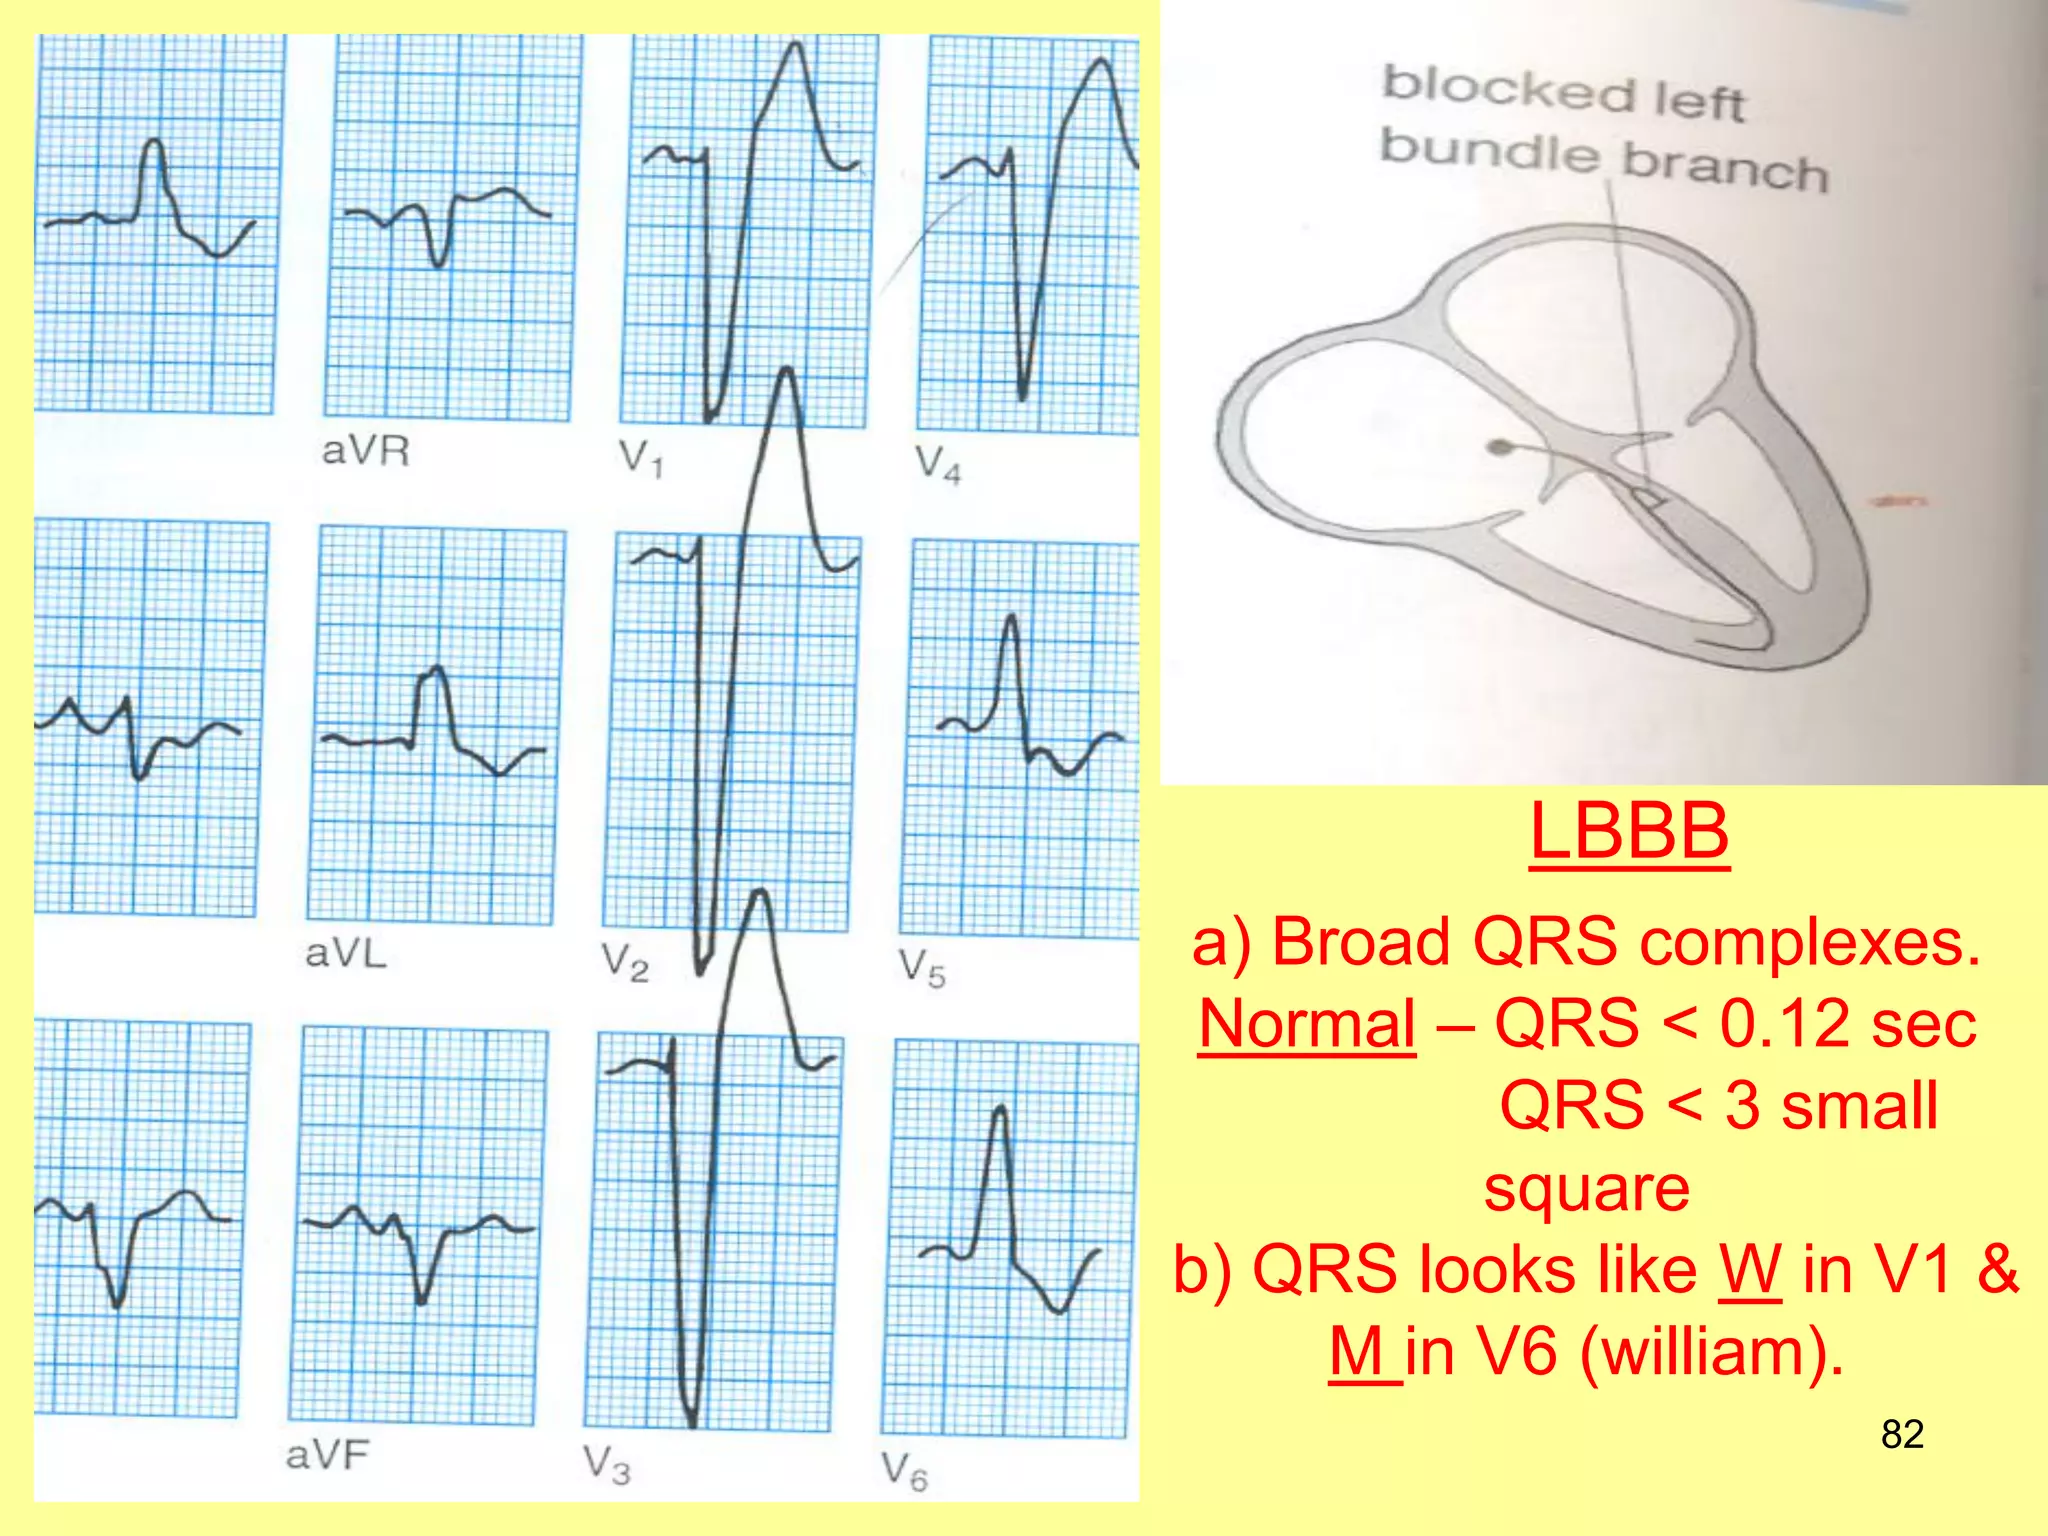
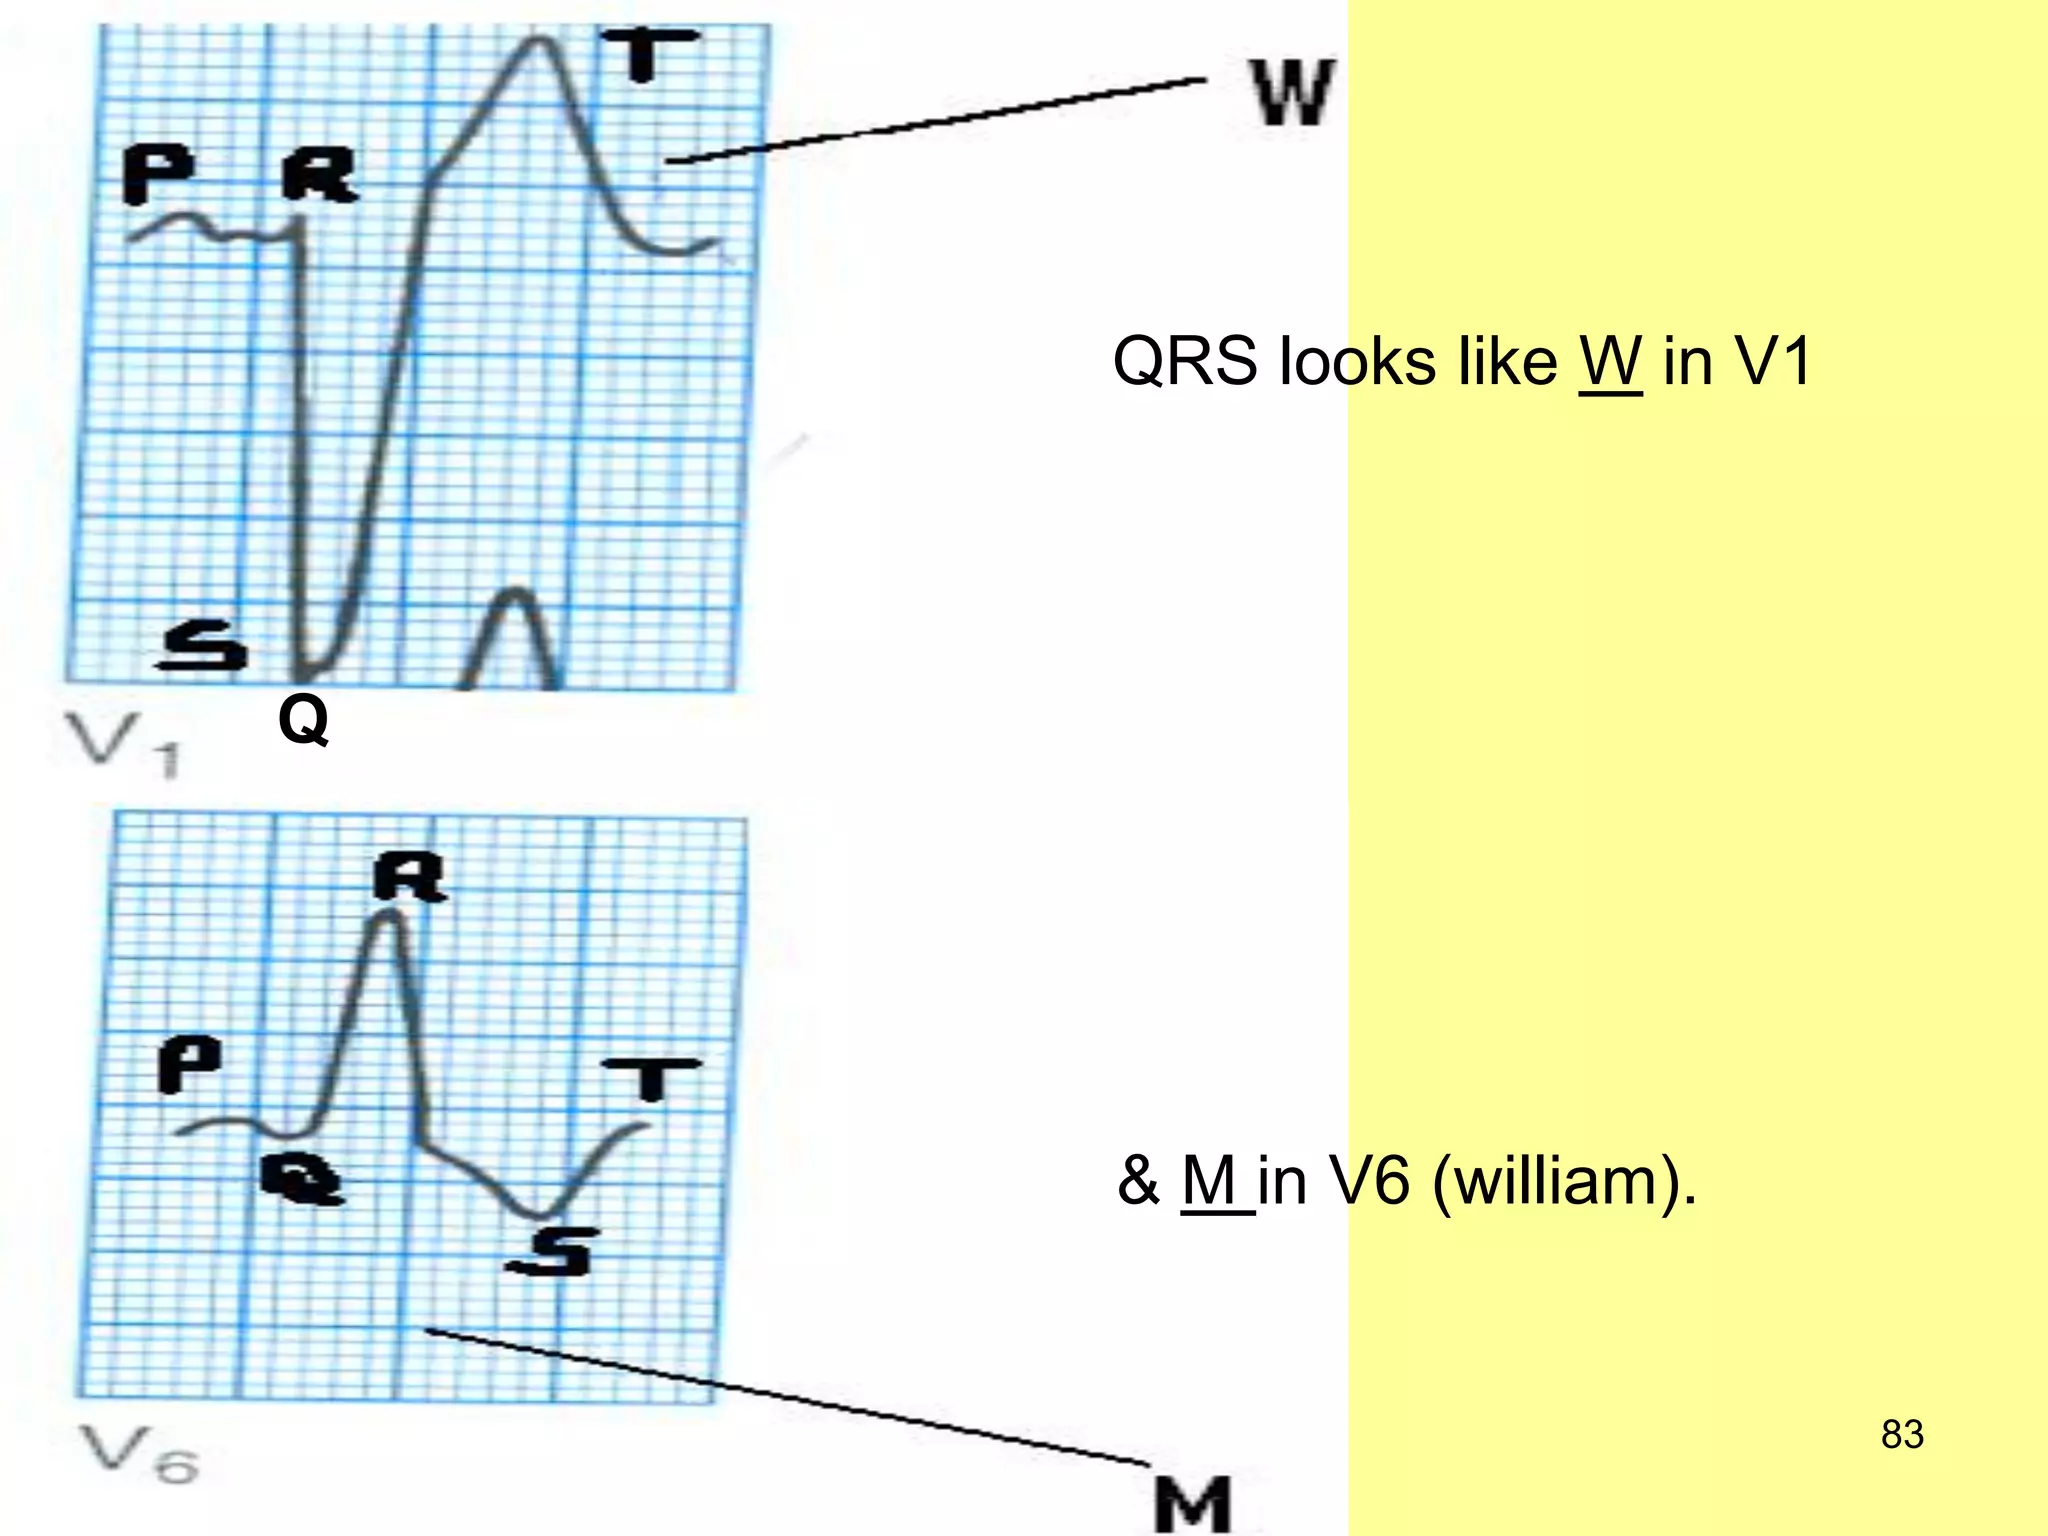
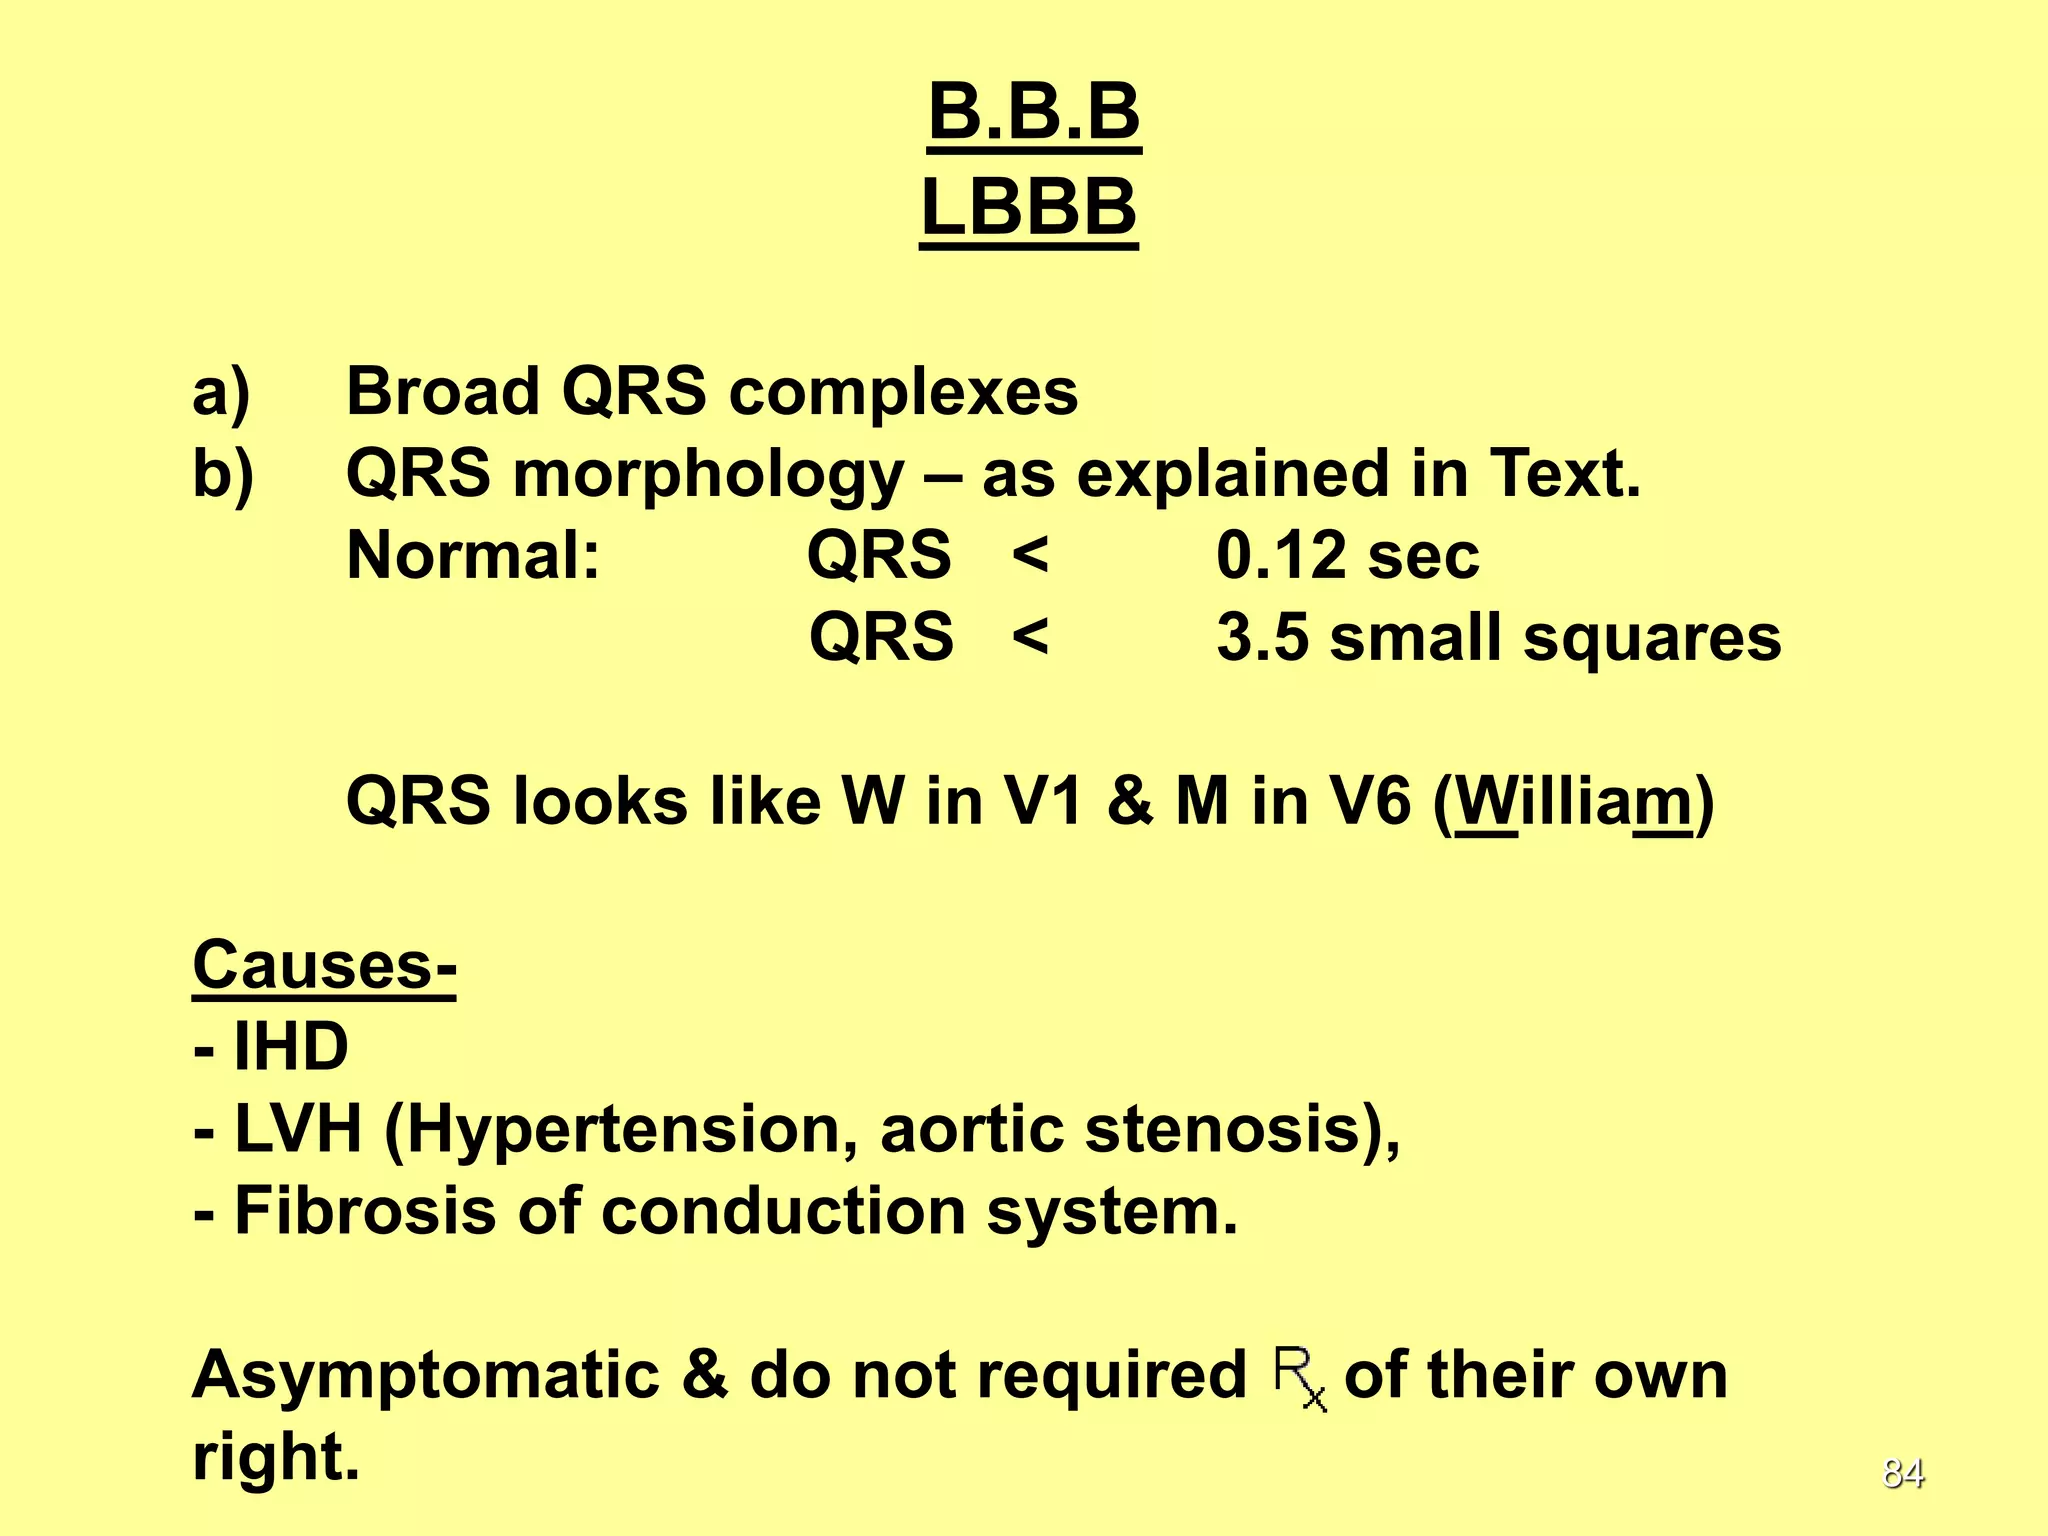
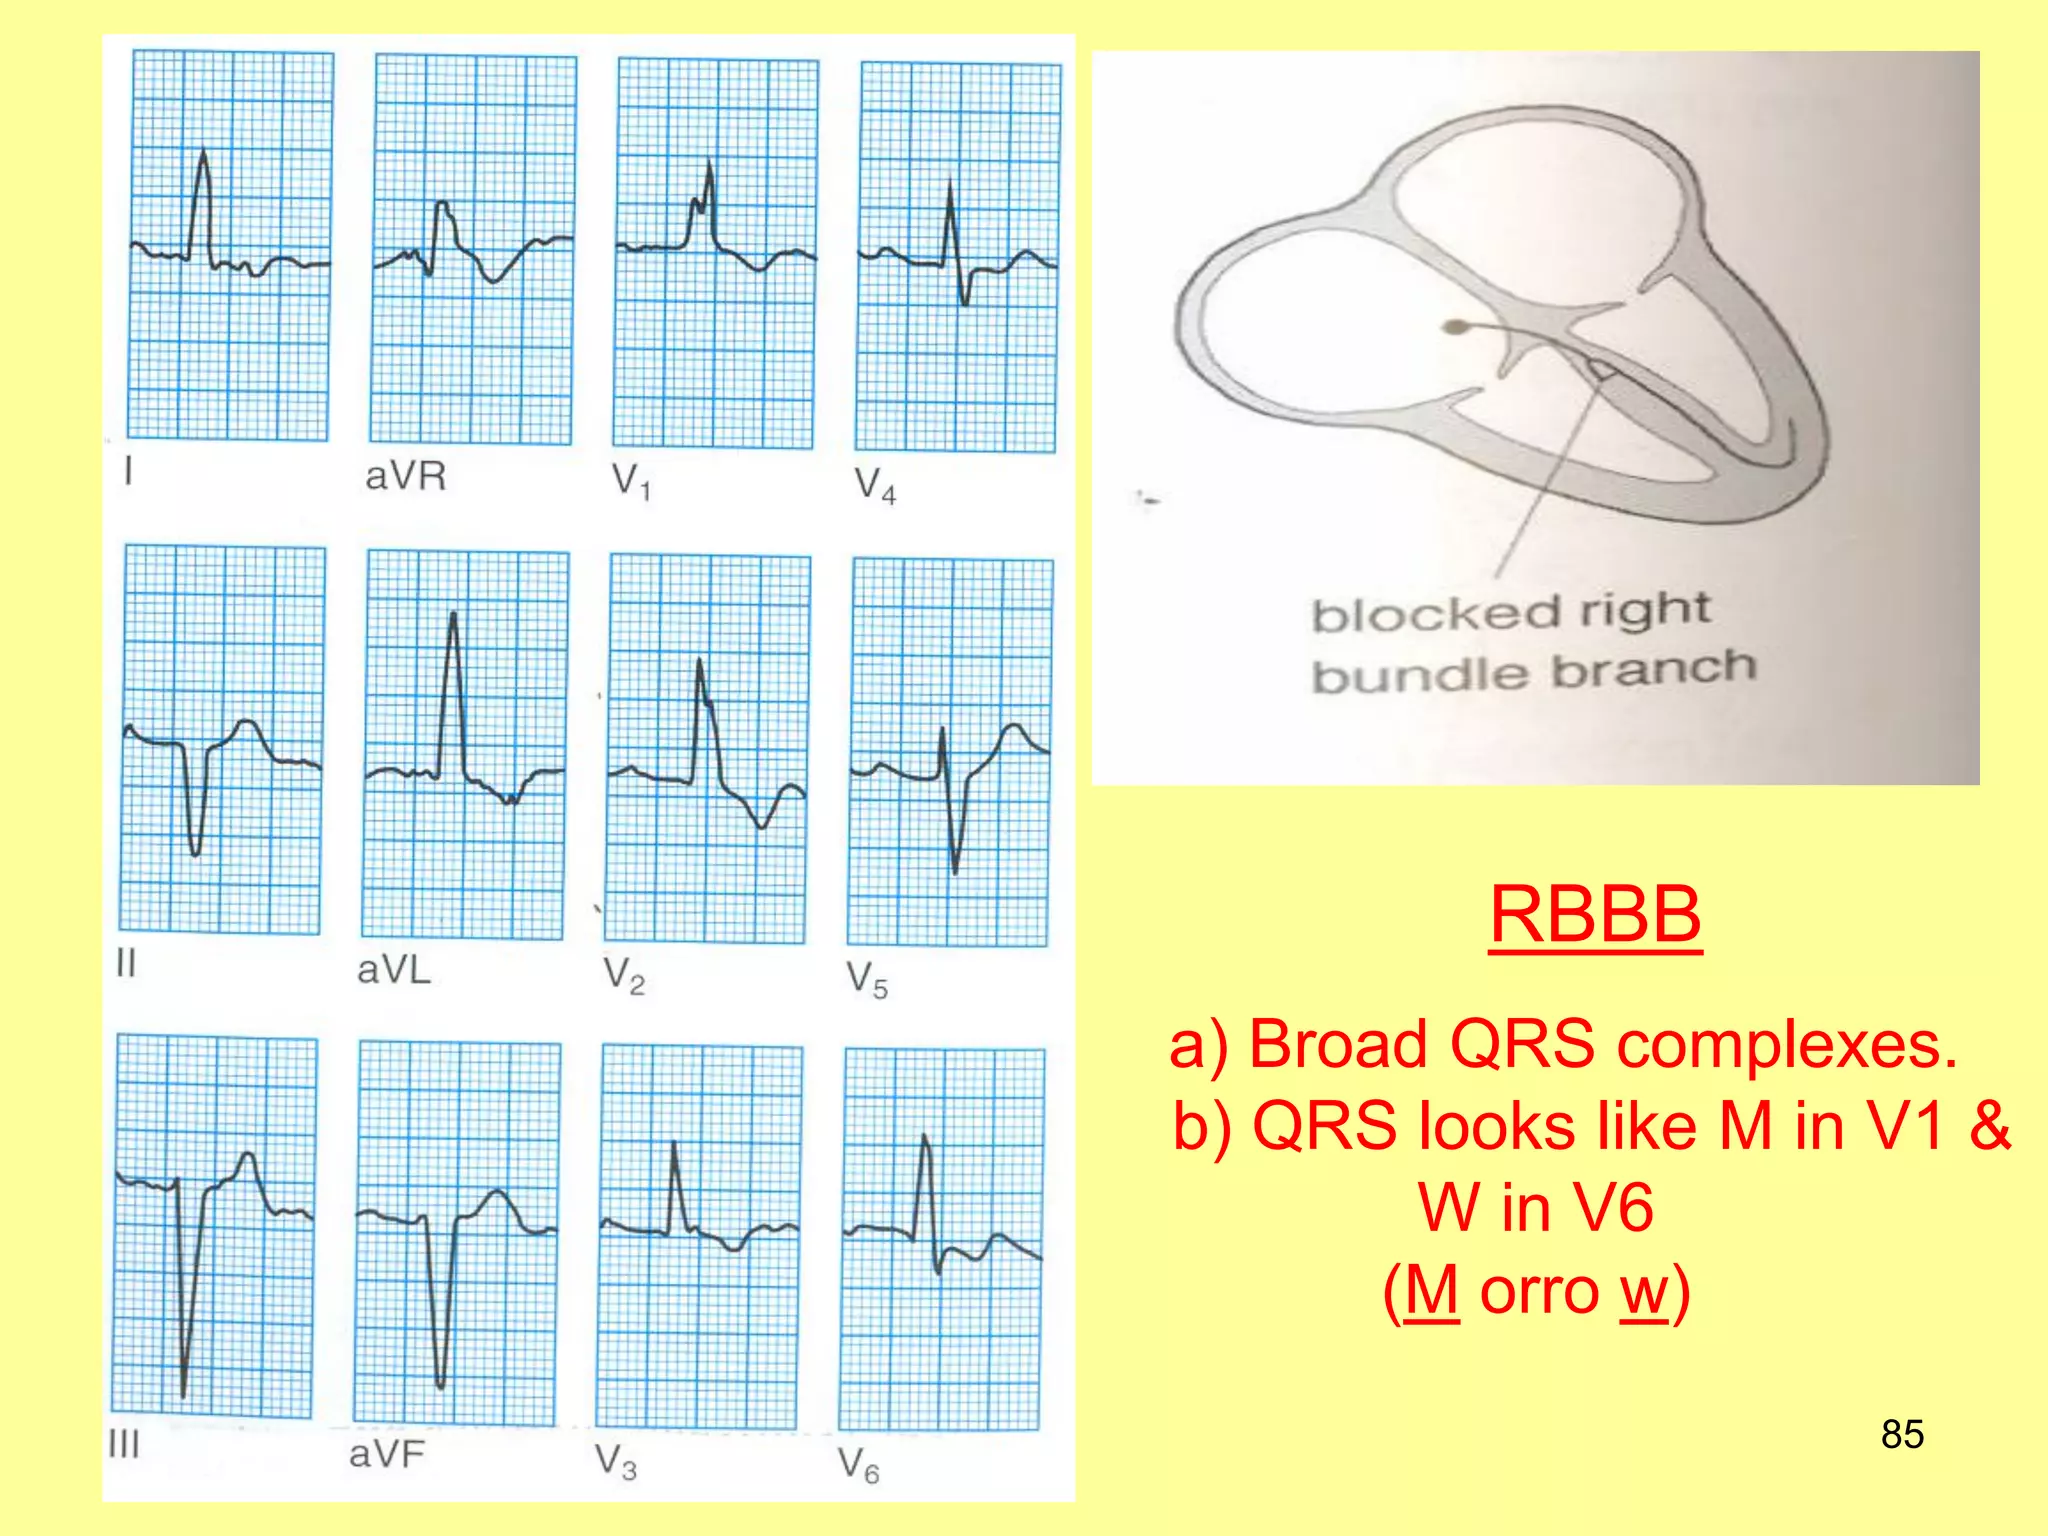
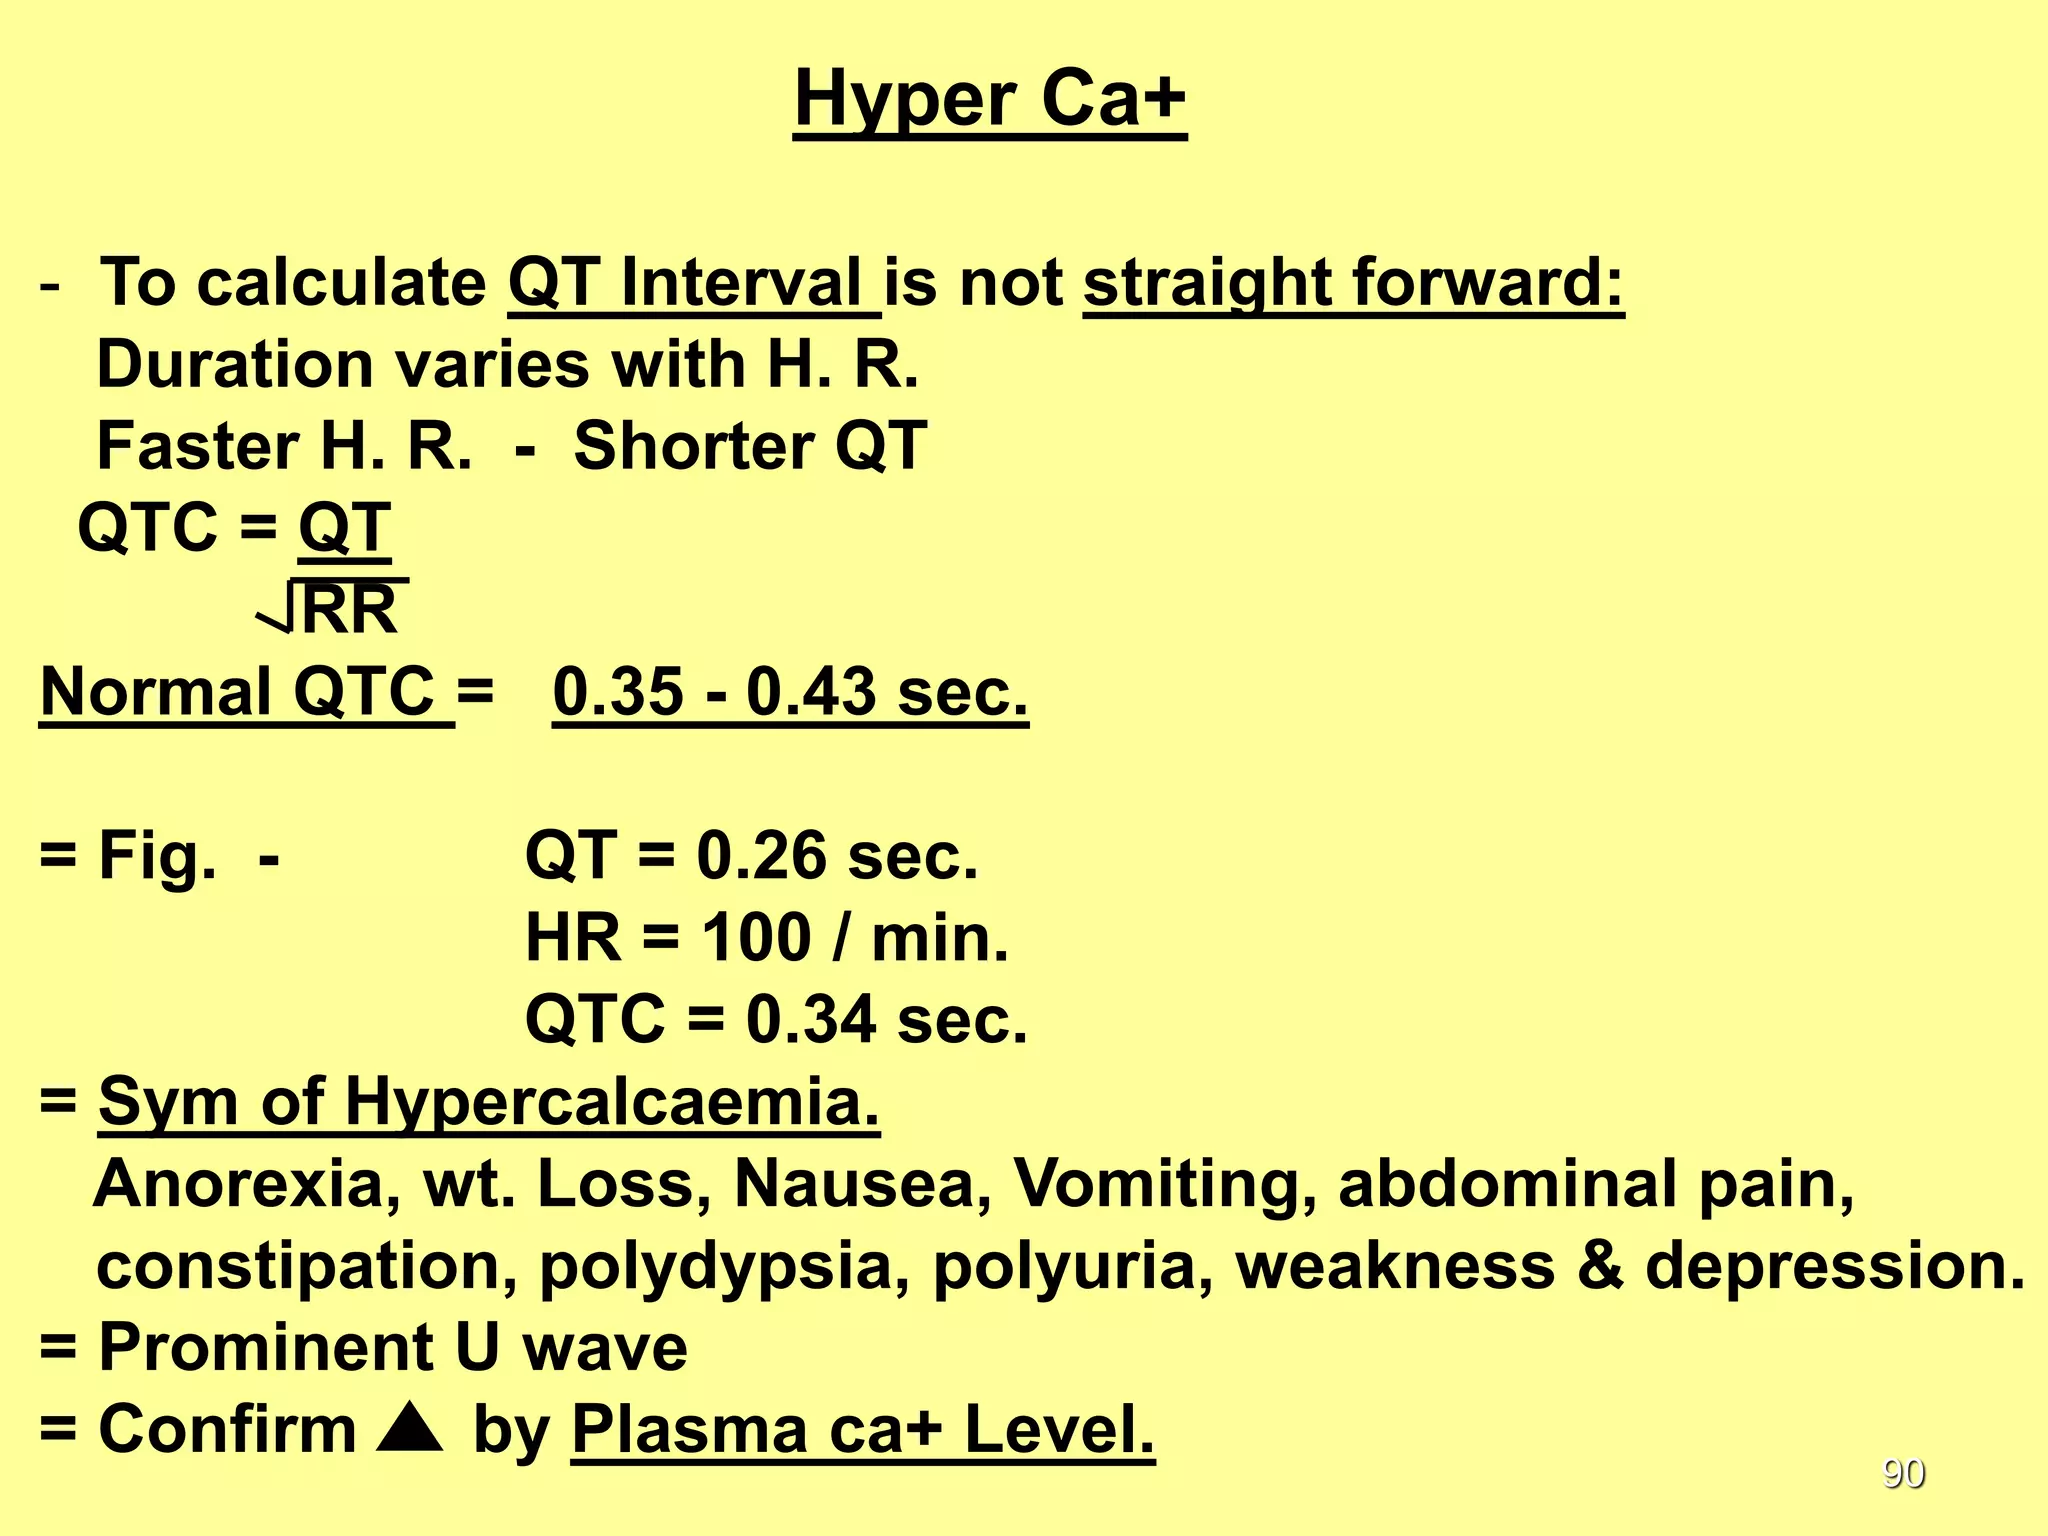
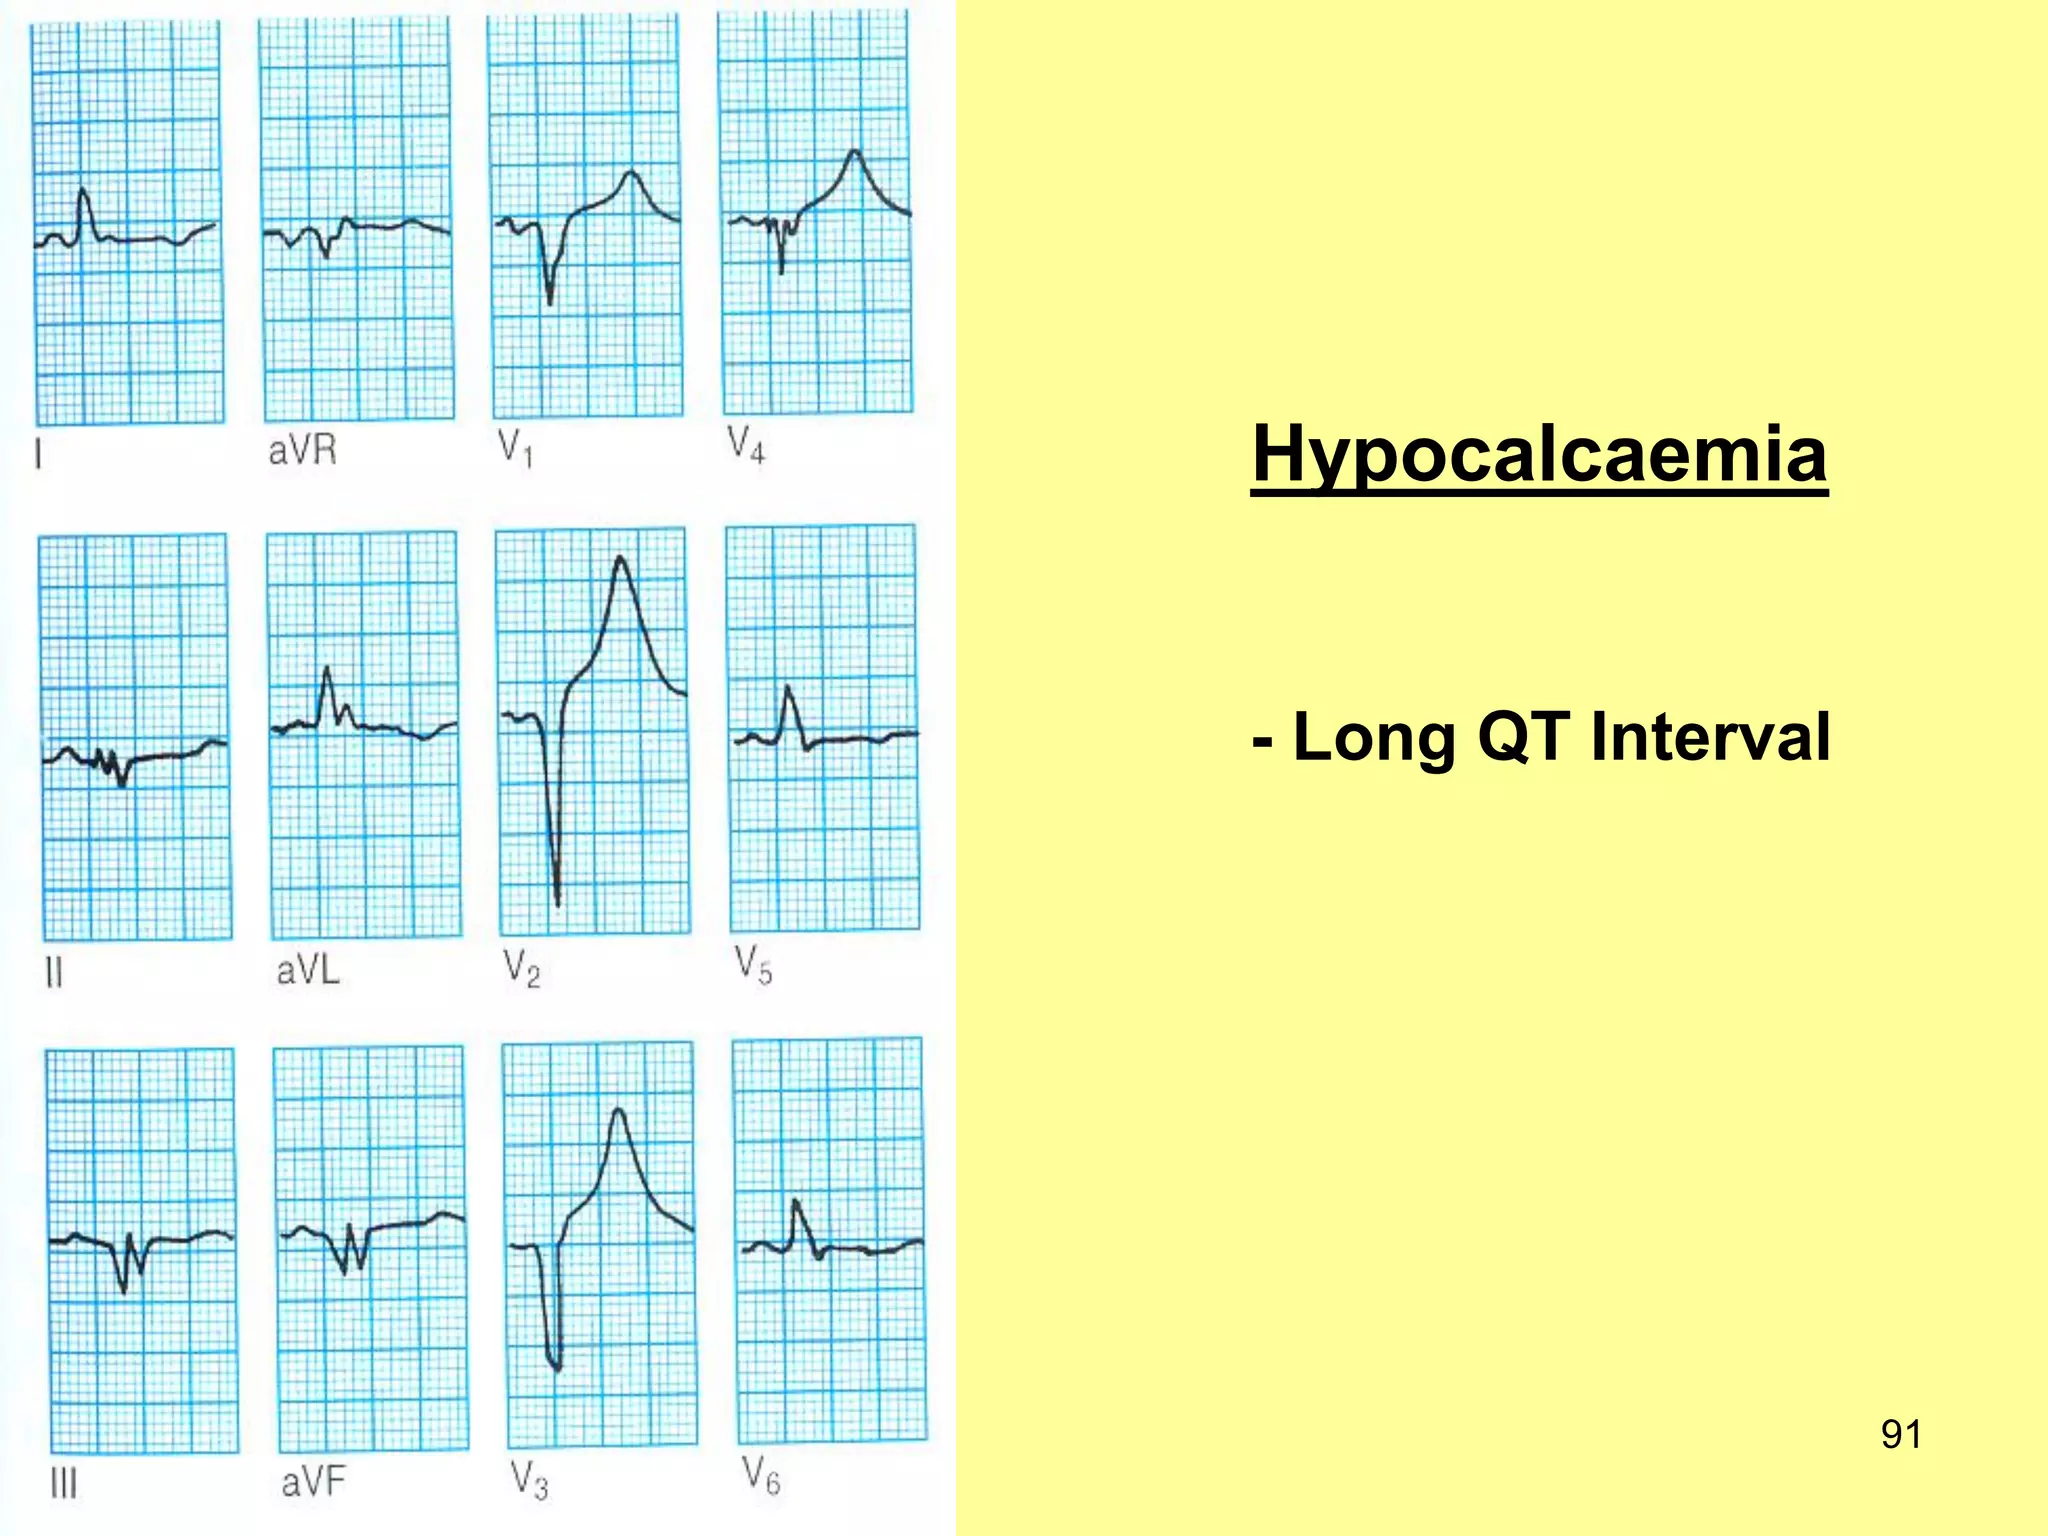
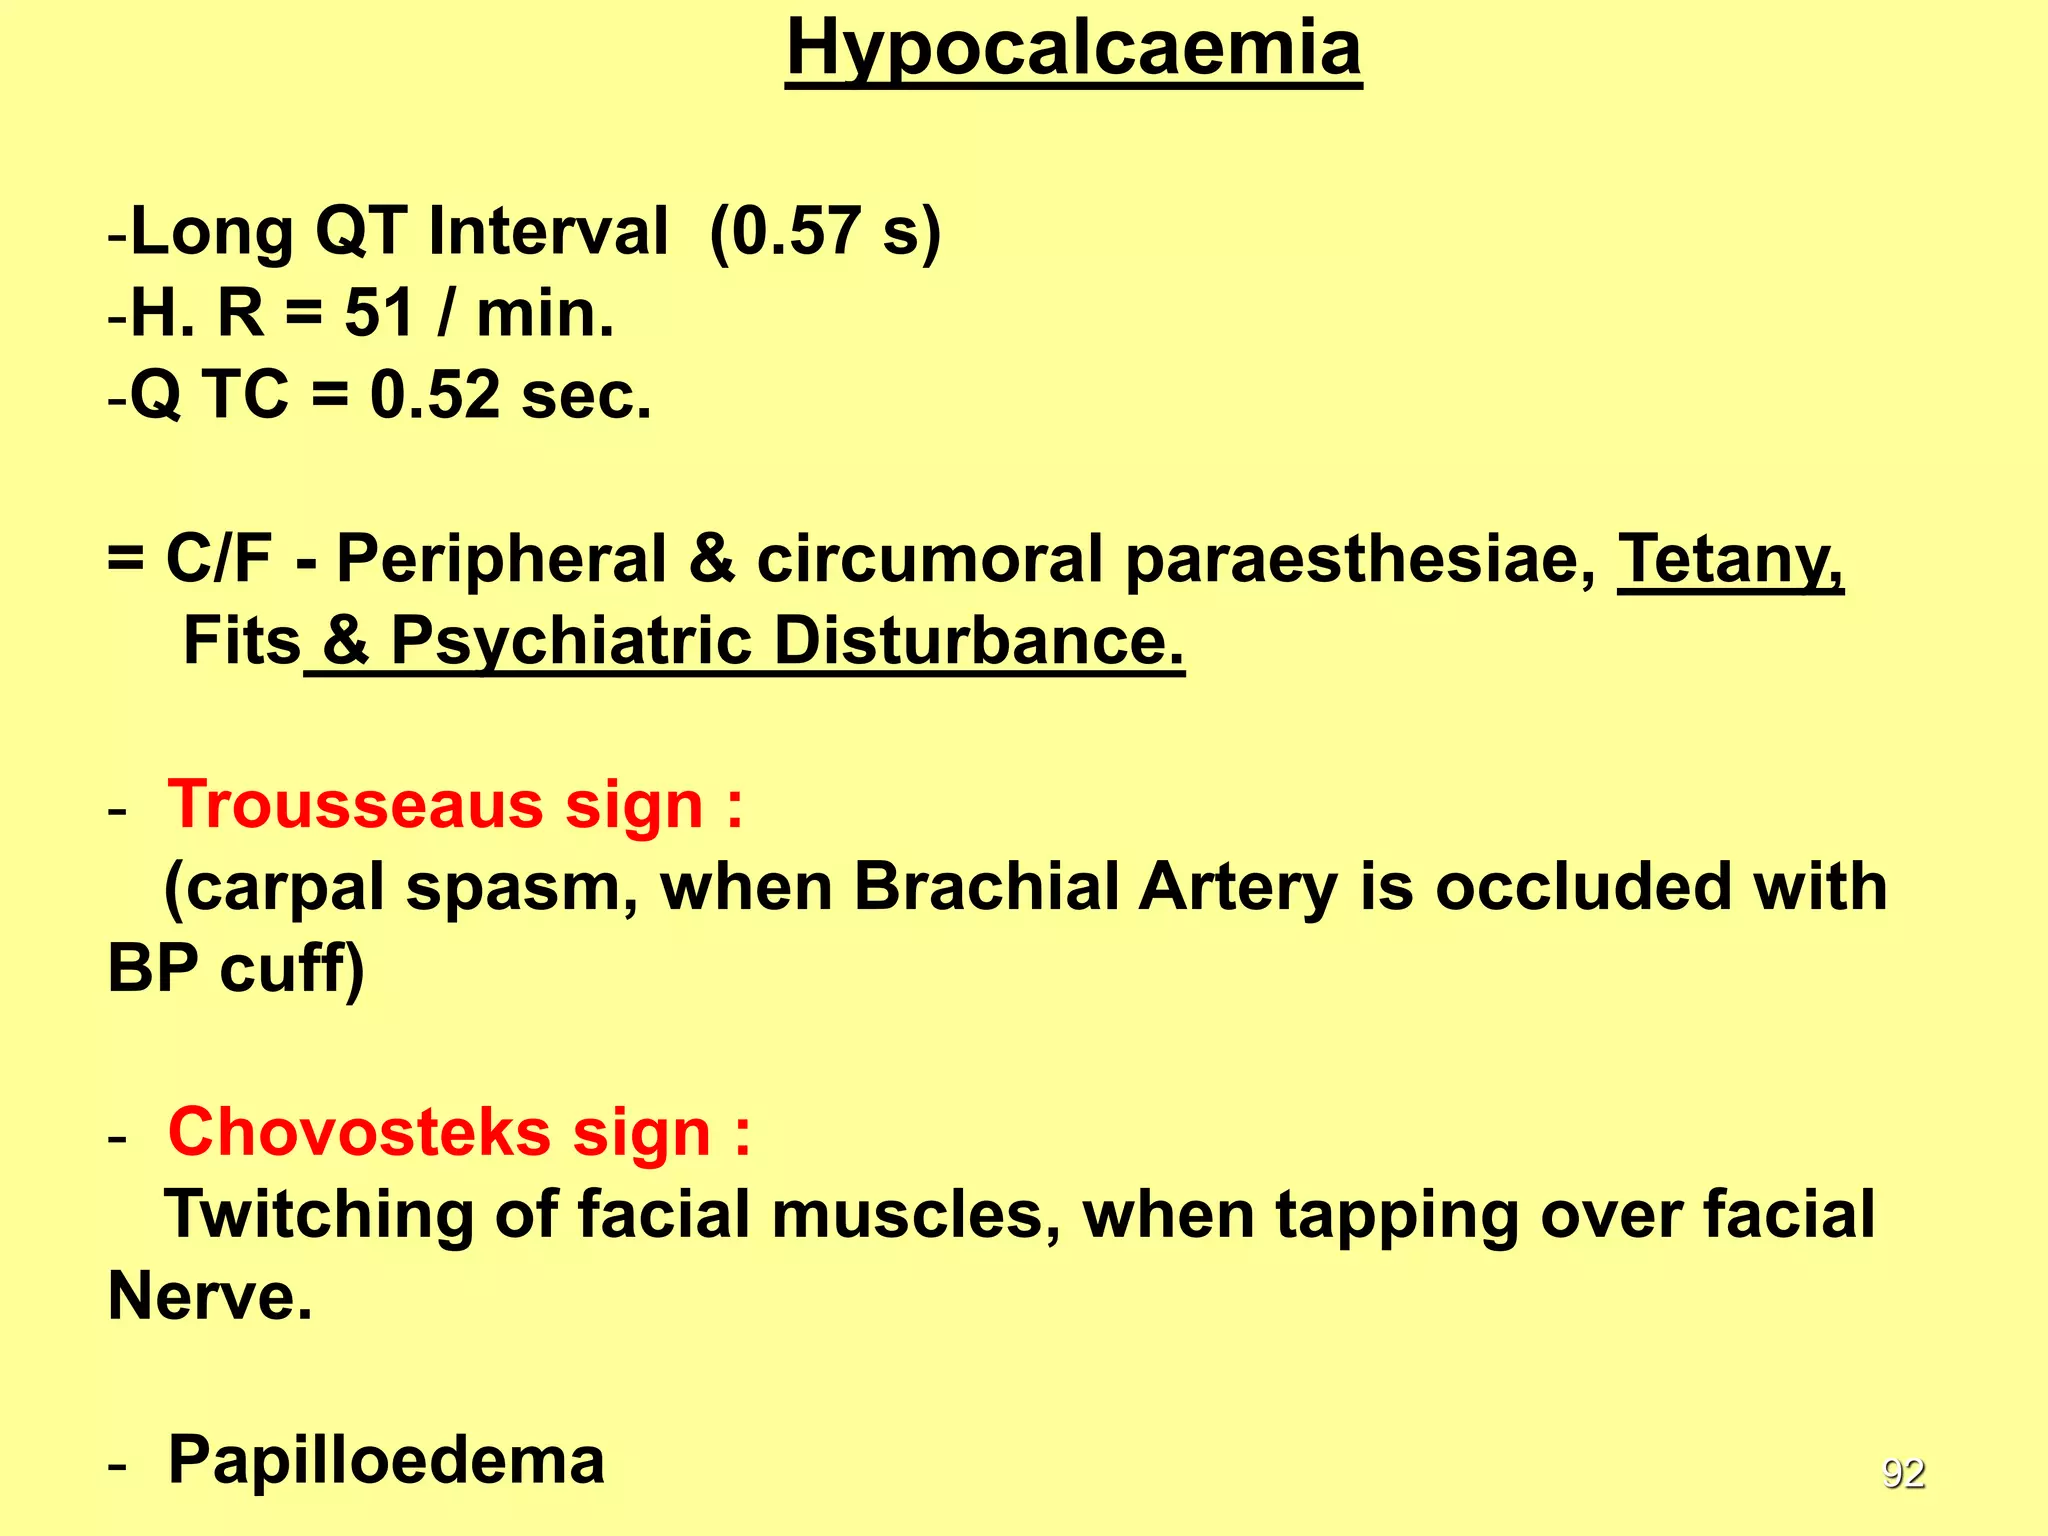
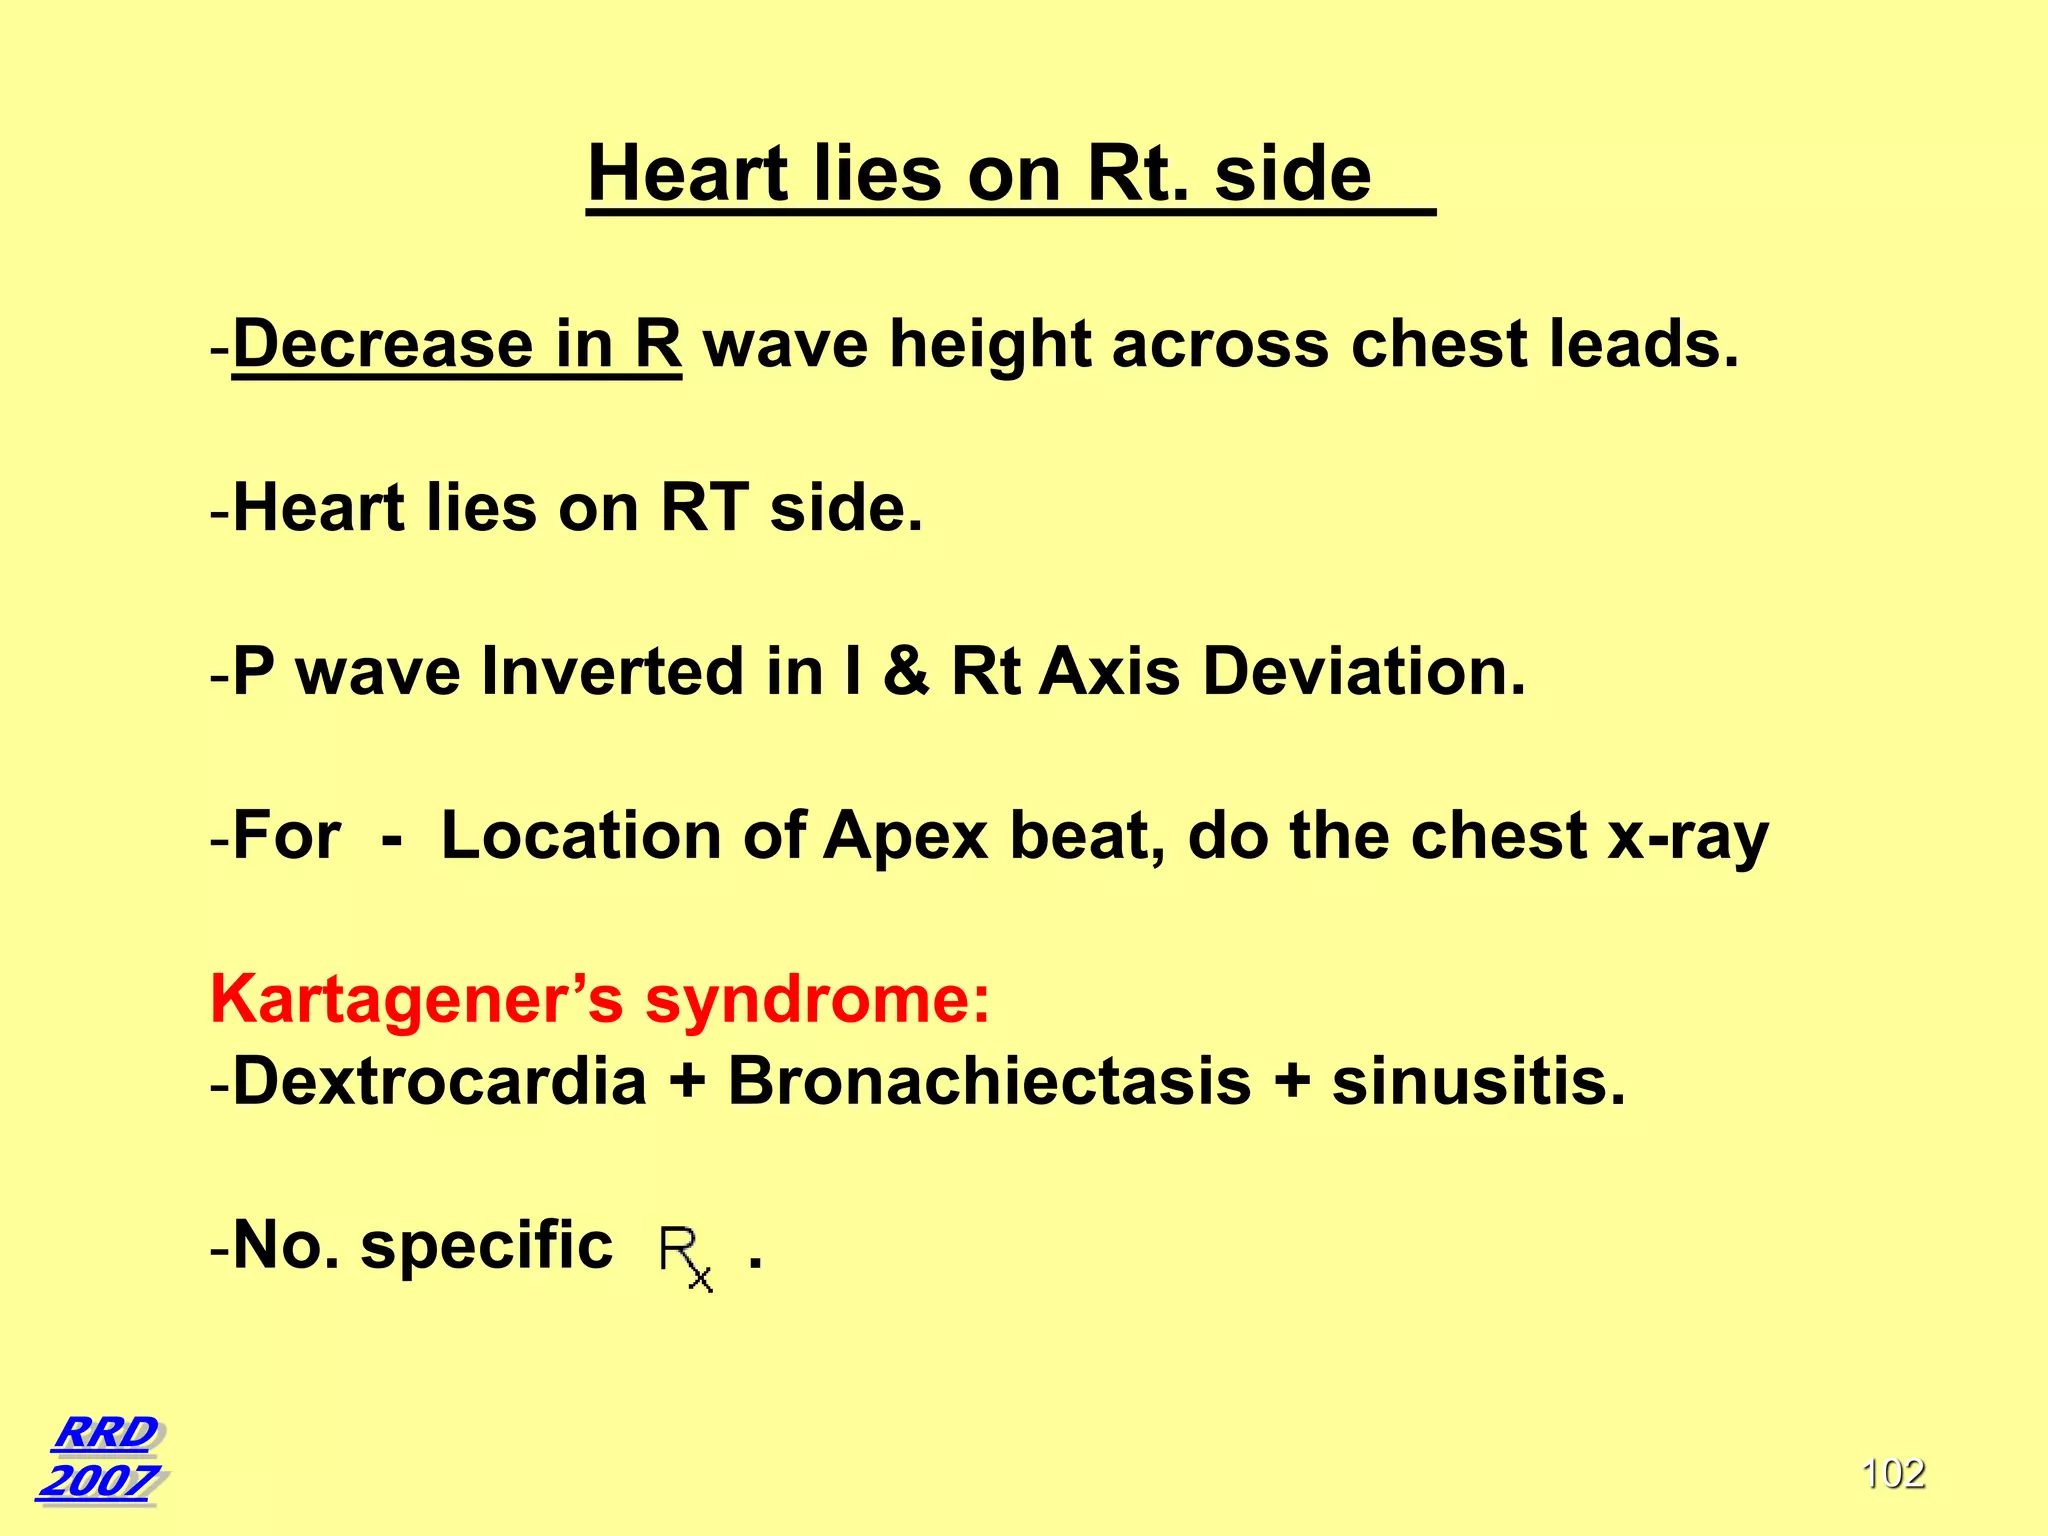
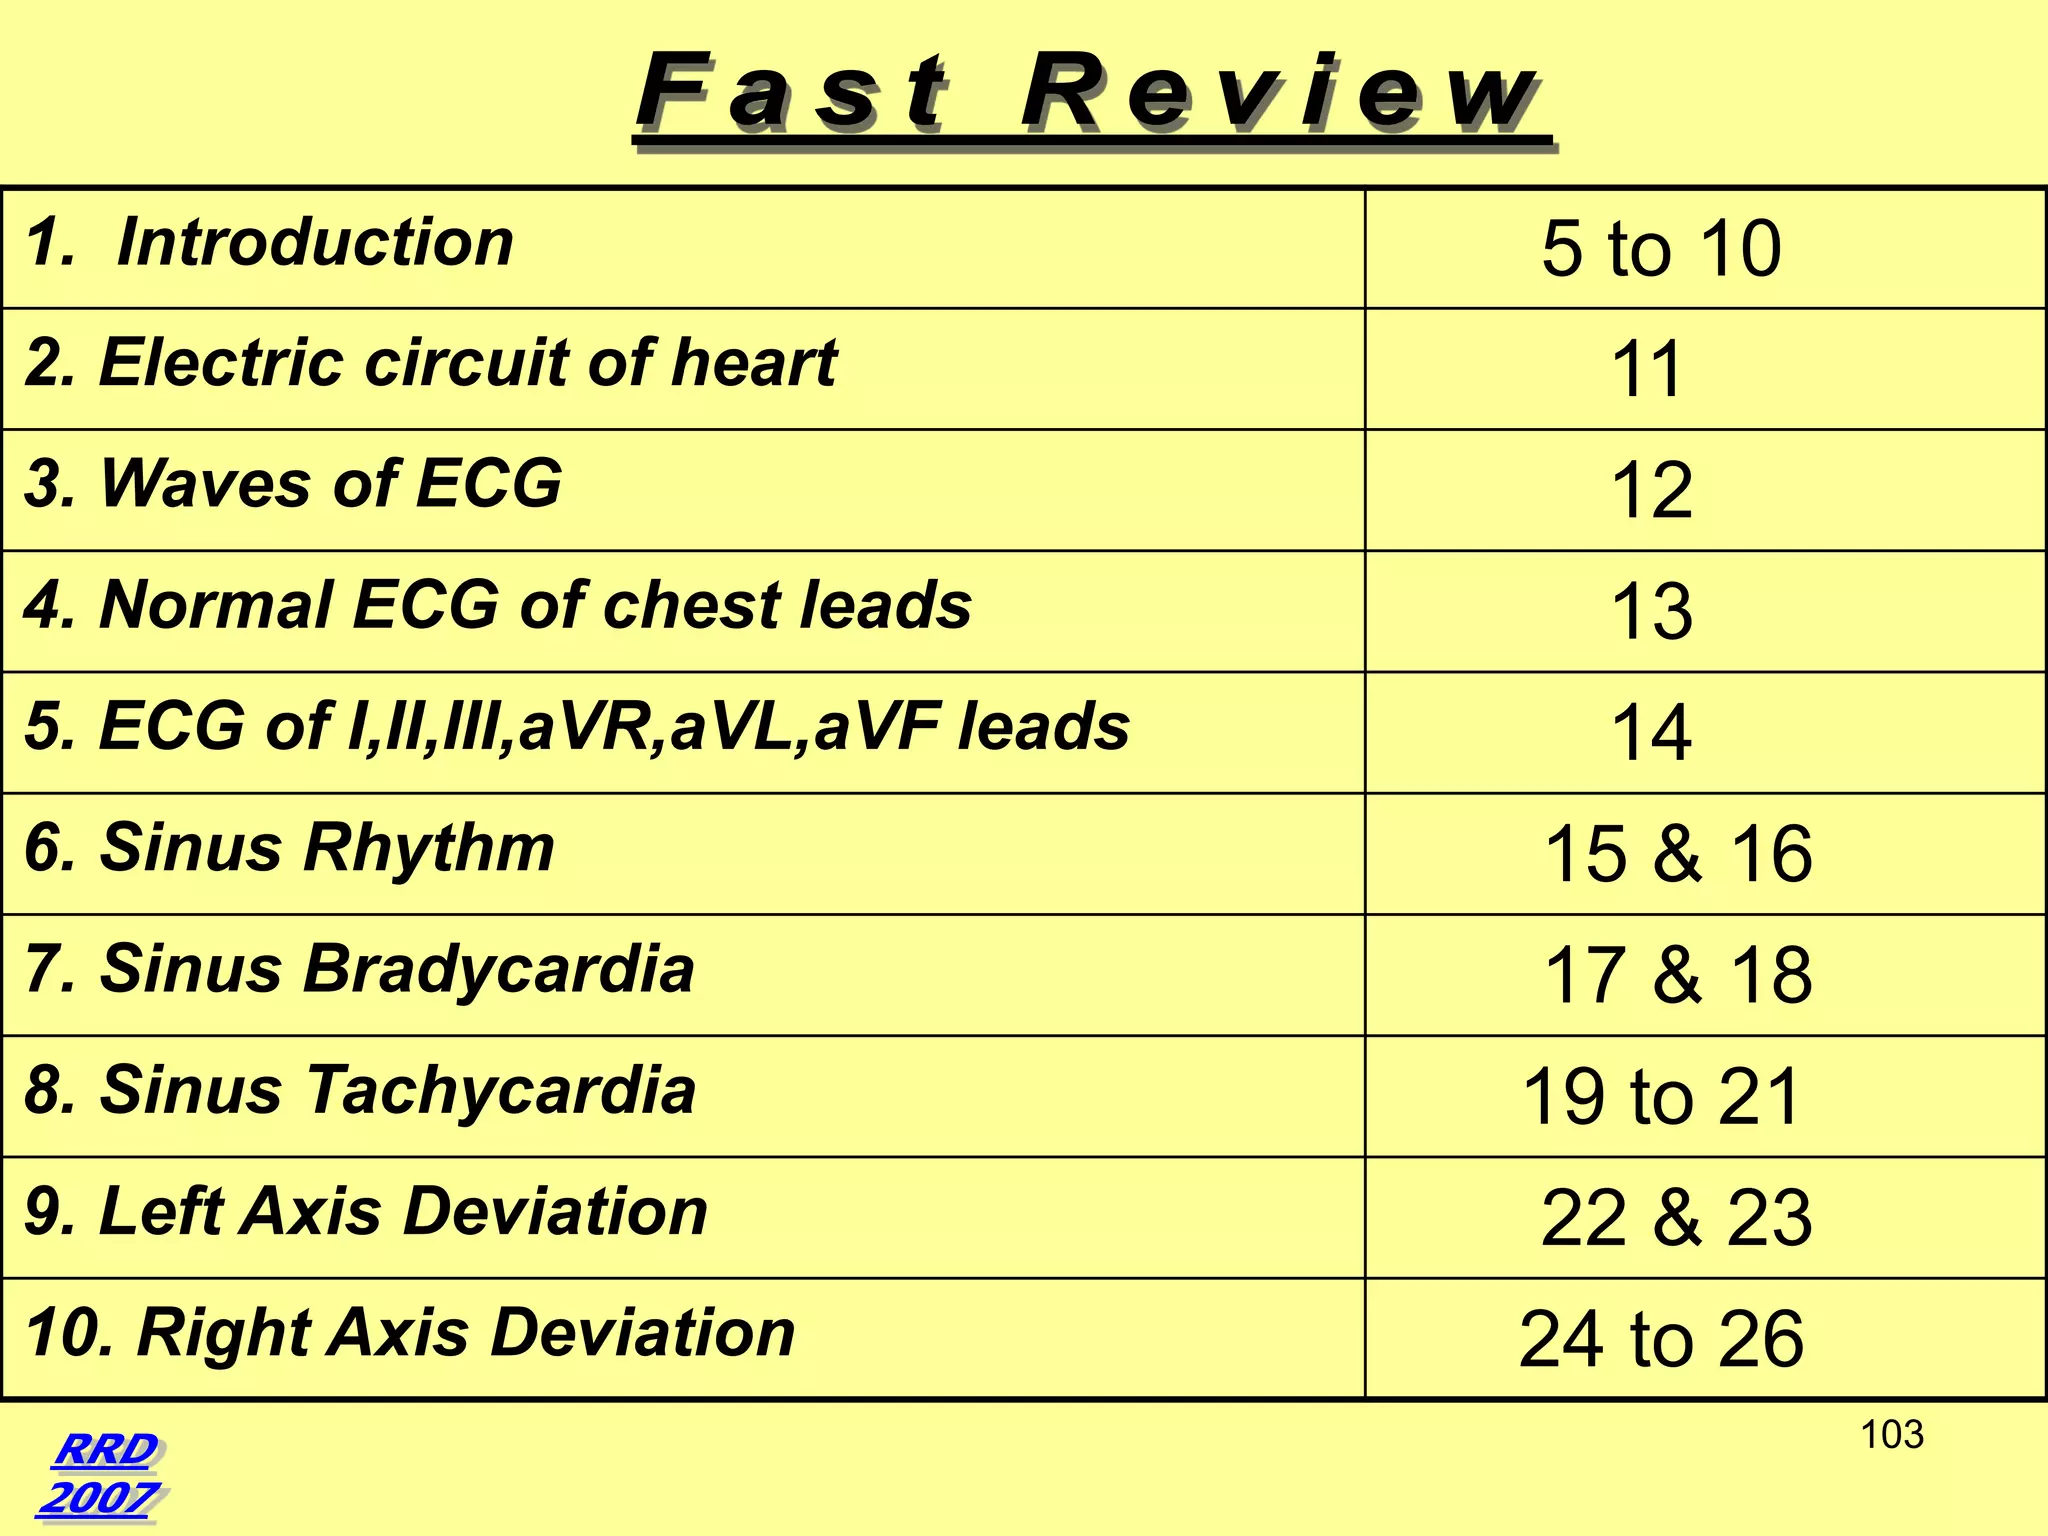

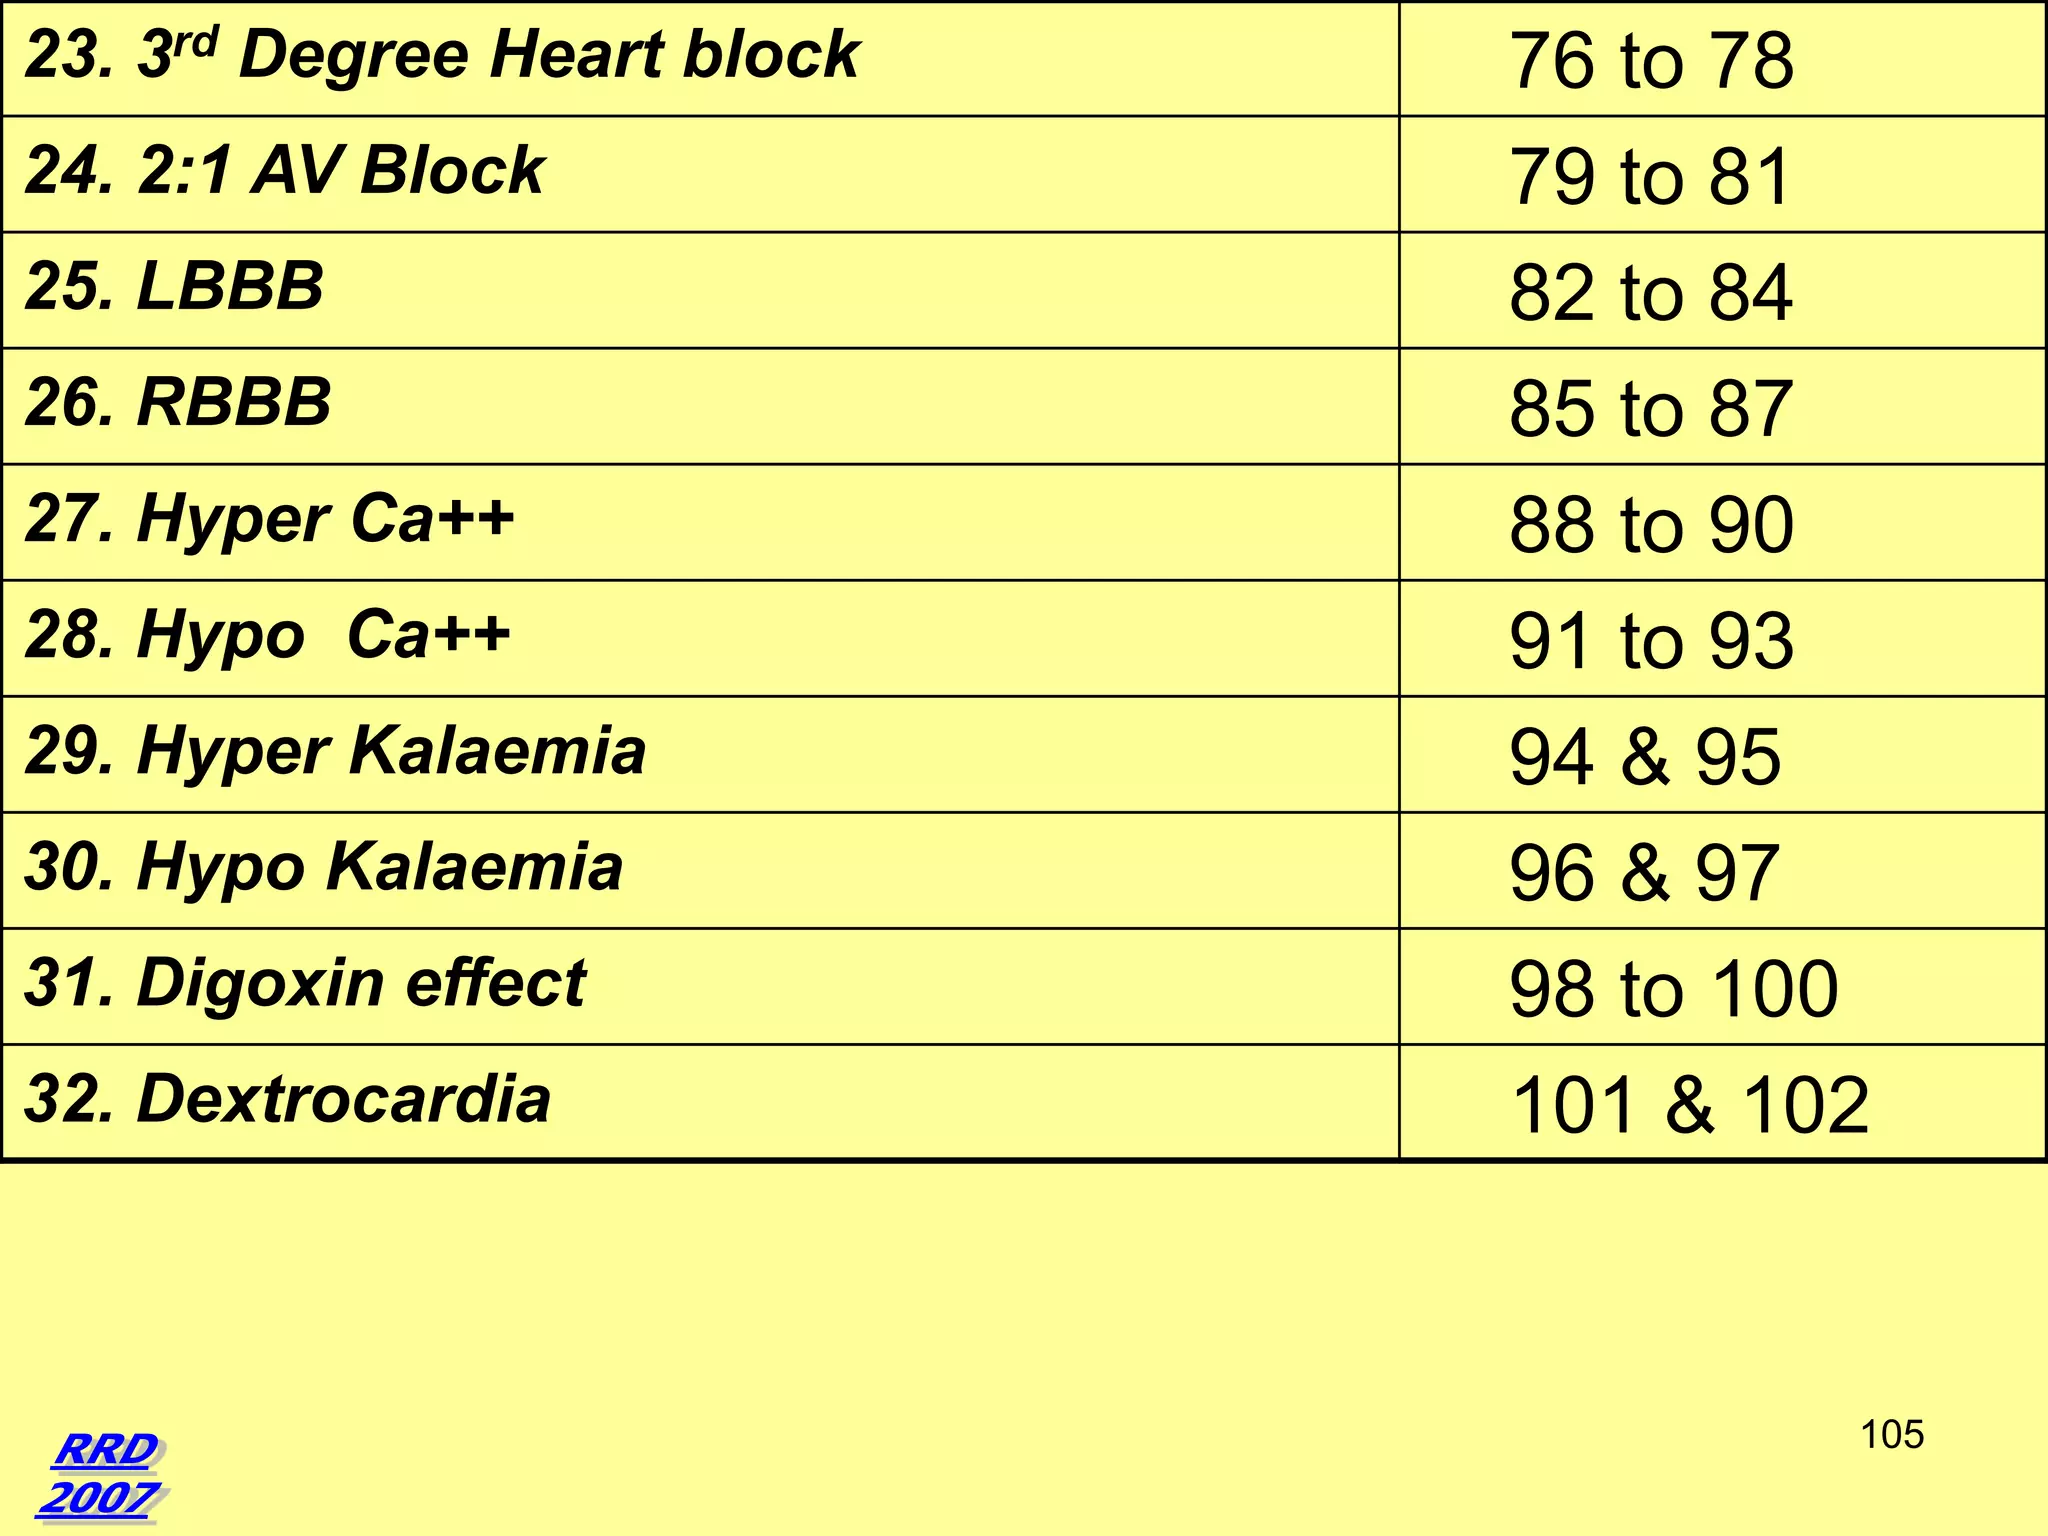


This document provides an overview of key topics in electrocardiography (ECG). It begins with definitions of an ECG and electrode leads. It then covers normal ECG wave patterns and measurements. Various abnormal ECG patterns are discussed including sinus bradycardia/tachycardia, ventricular hypertrophy, myocardial infarction in different regions, and more. Diagrams are provided to illustrate normal and abnormal ECG findings. The document serves as a guide to interpreting ECGs and recognizing common cardiac conditions.


