Download to read offline
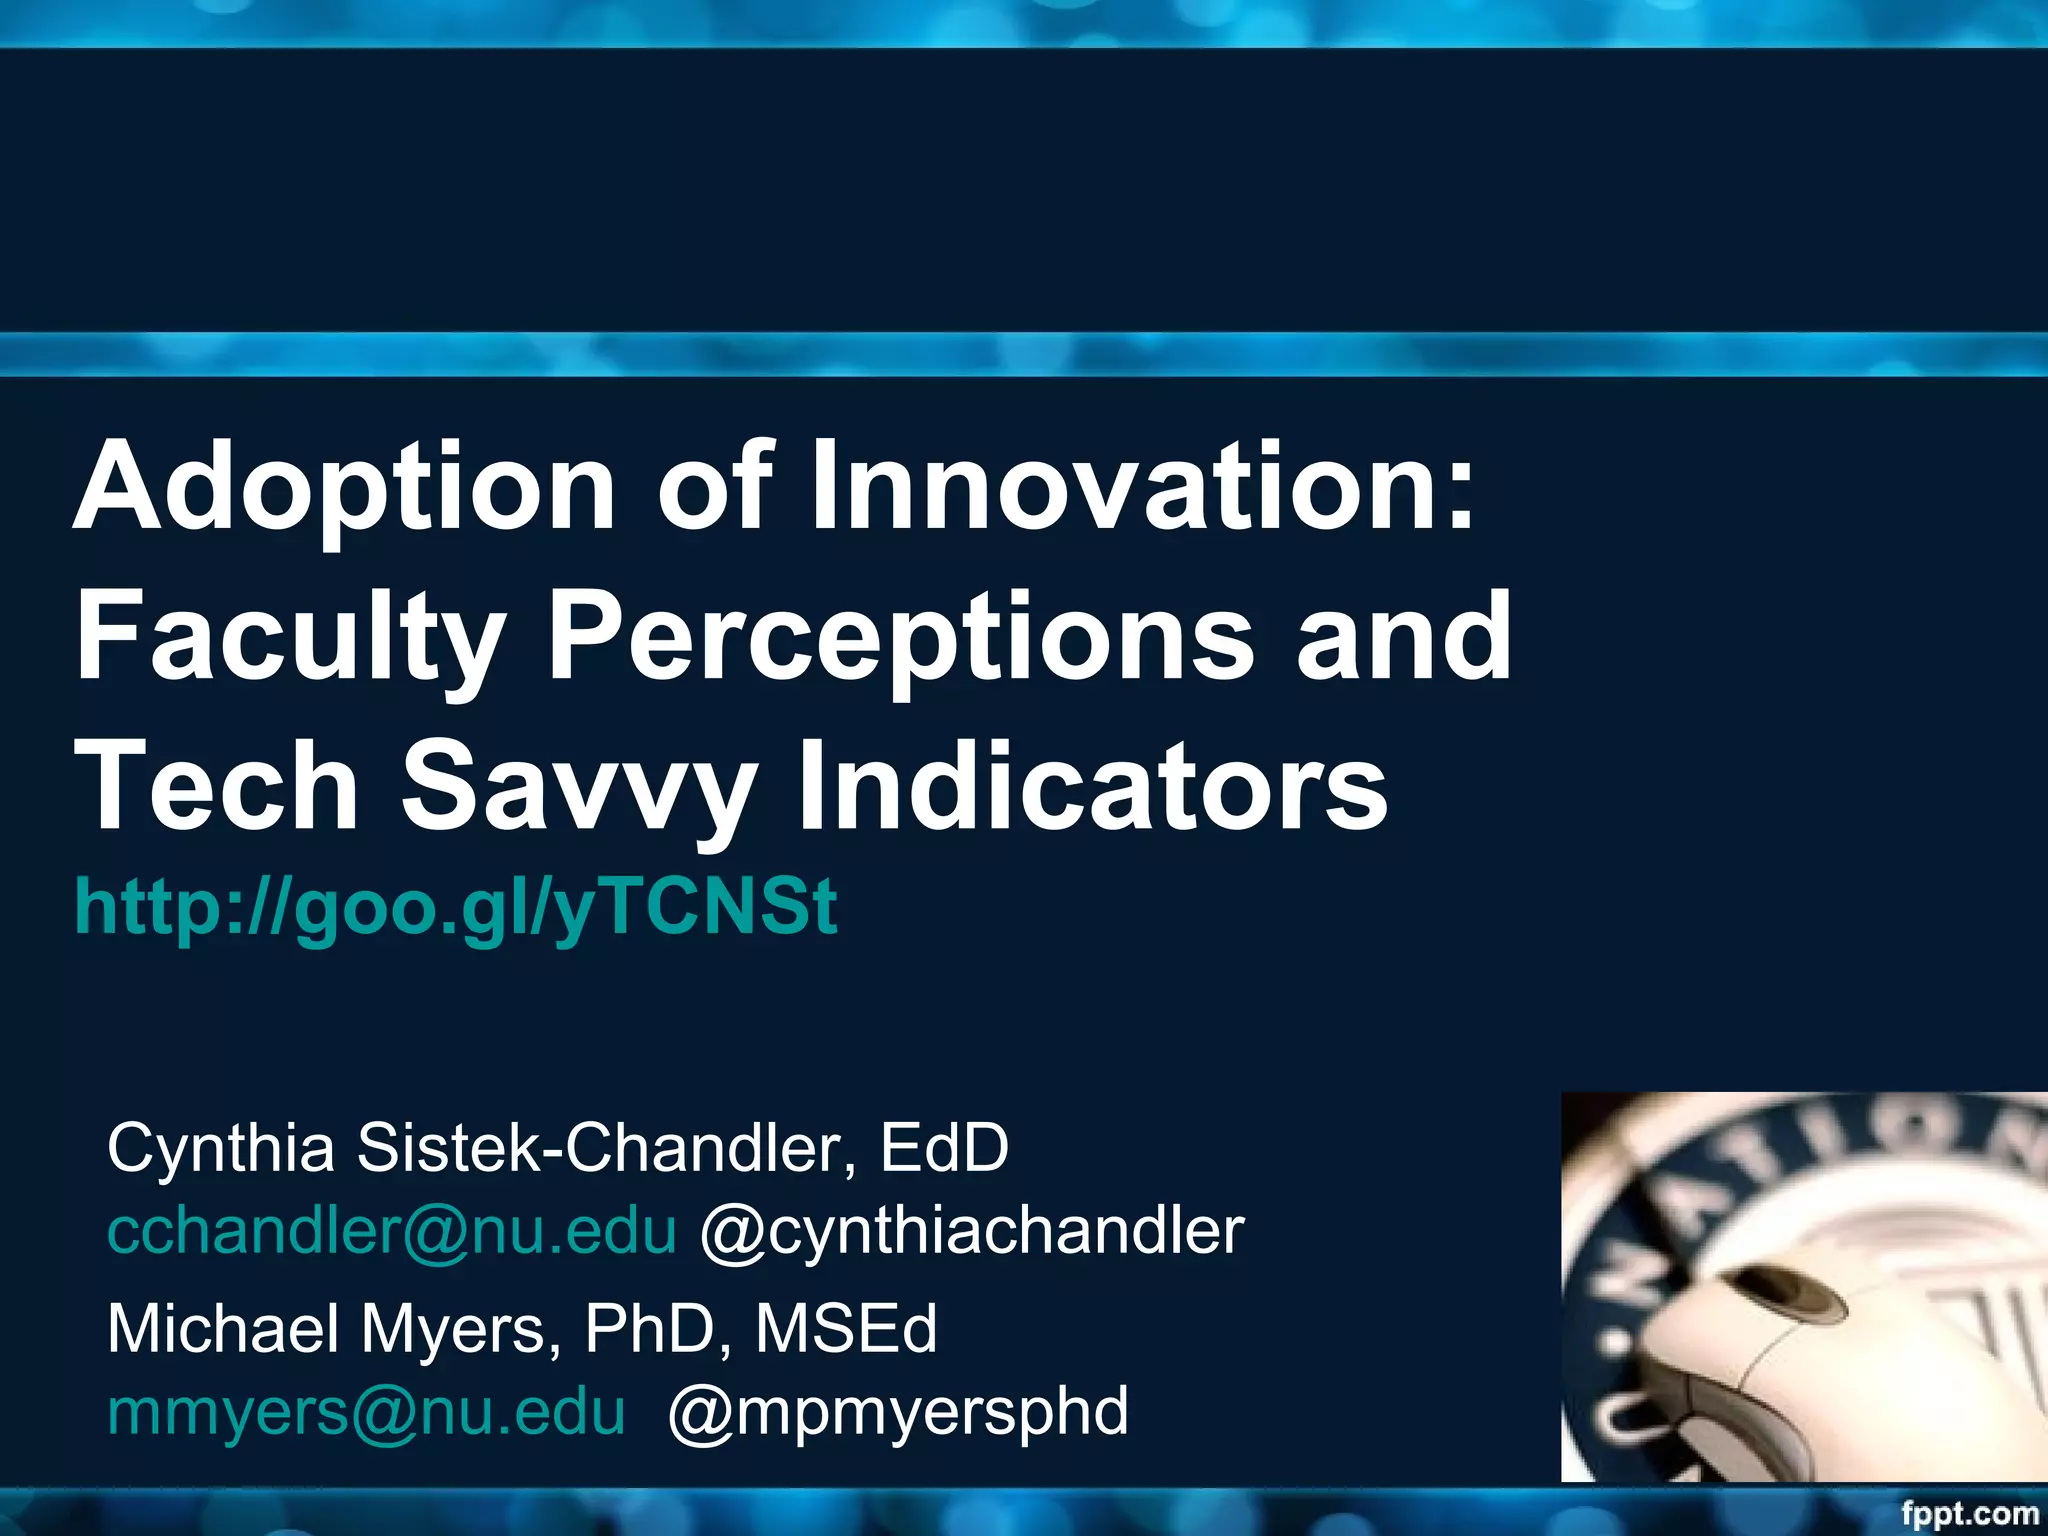

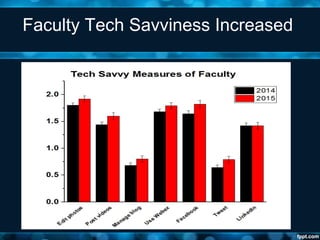
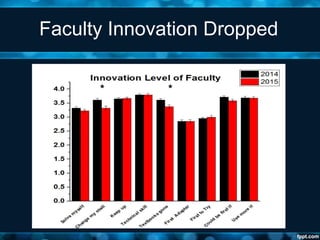
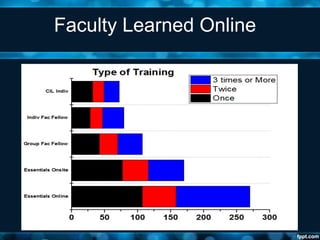
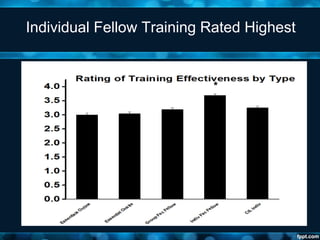
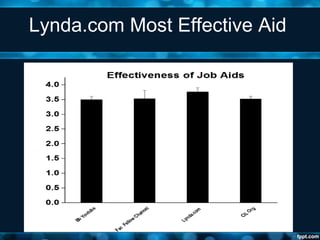
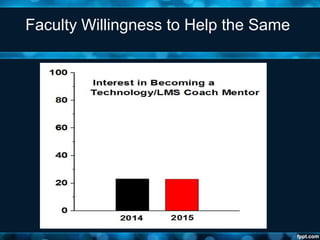
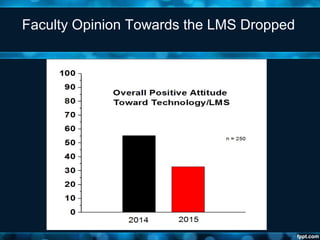
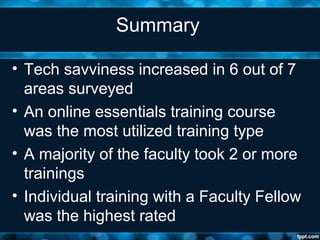
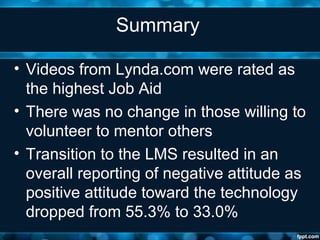


The study examines faculty perceptions and tech savviness regarding the adoption of a new learning management system (LMS) over a two-year period, involving data from over 300 faculty members. Key findings indicate that while tech savviness increased in most areas, faculty attitudes toward the LMS became more negative, with a significant drop in positive perception about the technology. The most effective training methods included individual training and resources from Lynda.com, though overall satisfaction with faculty development initiatives remained low.


![Evaluation study[1]](https://cdn.slidesharecdn.com/ss_thumbnails/evaluationstudy1-100520114232-phpapp02-thumbnail.jpg?width=640&height=640&fit=bounds)


