Download to read offline
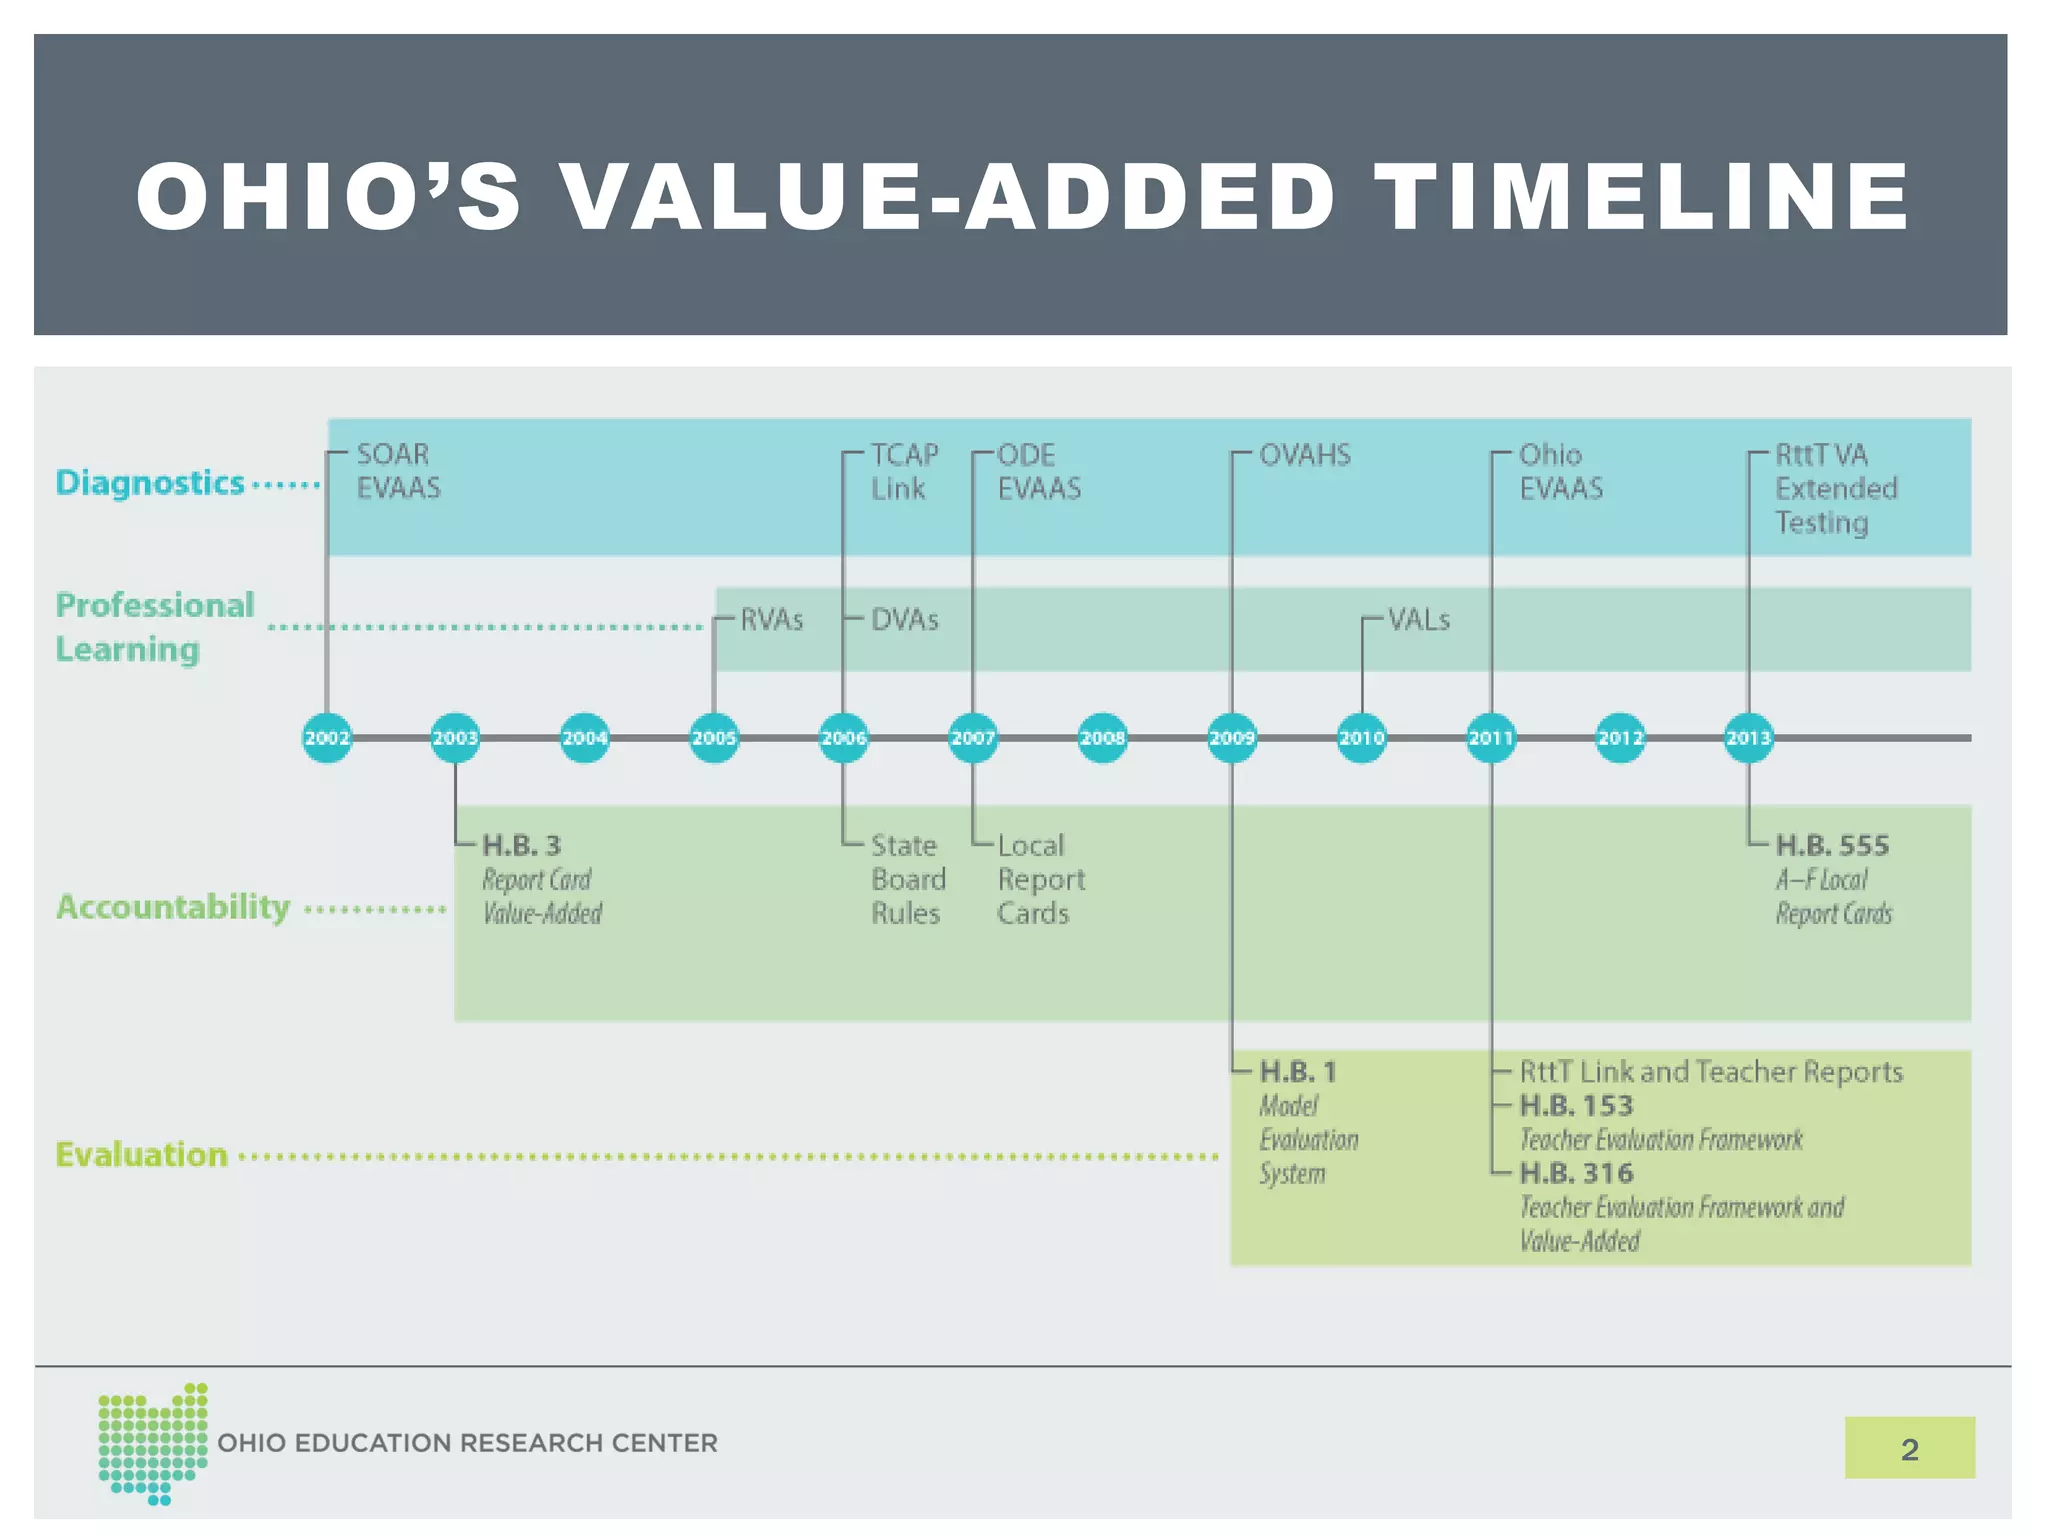
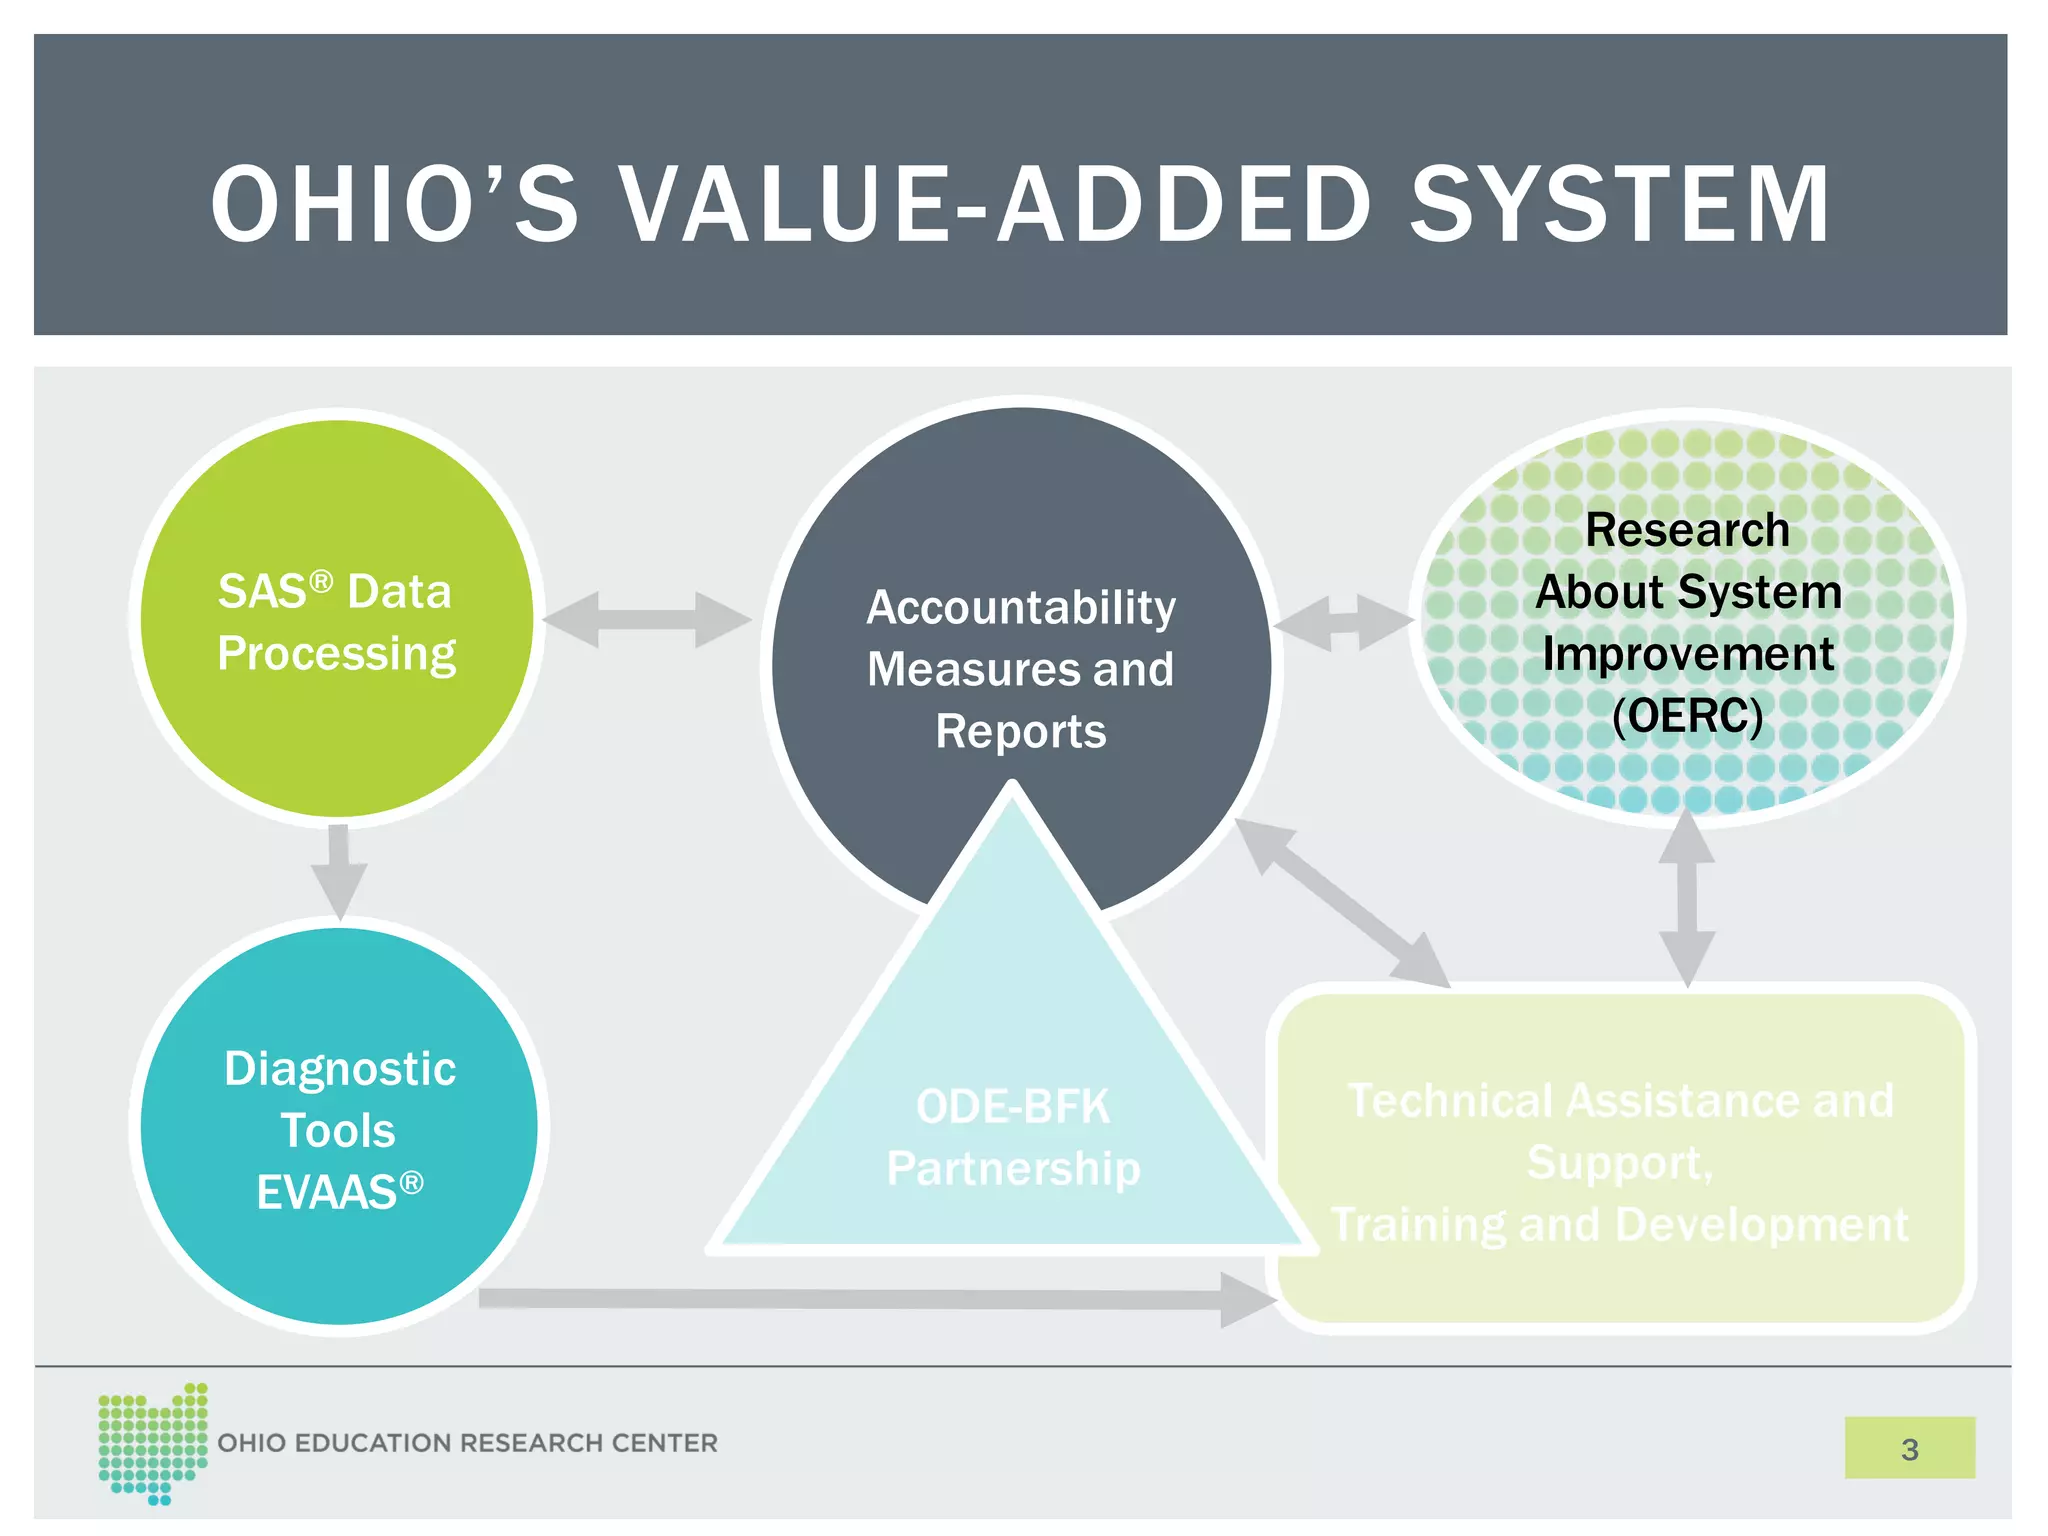
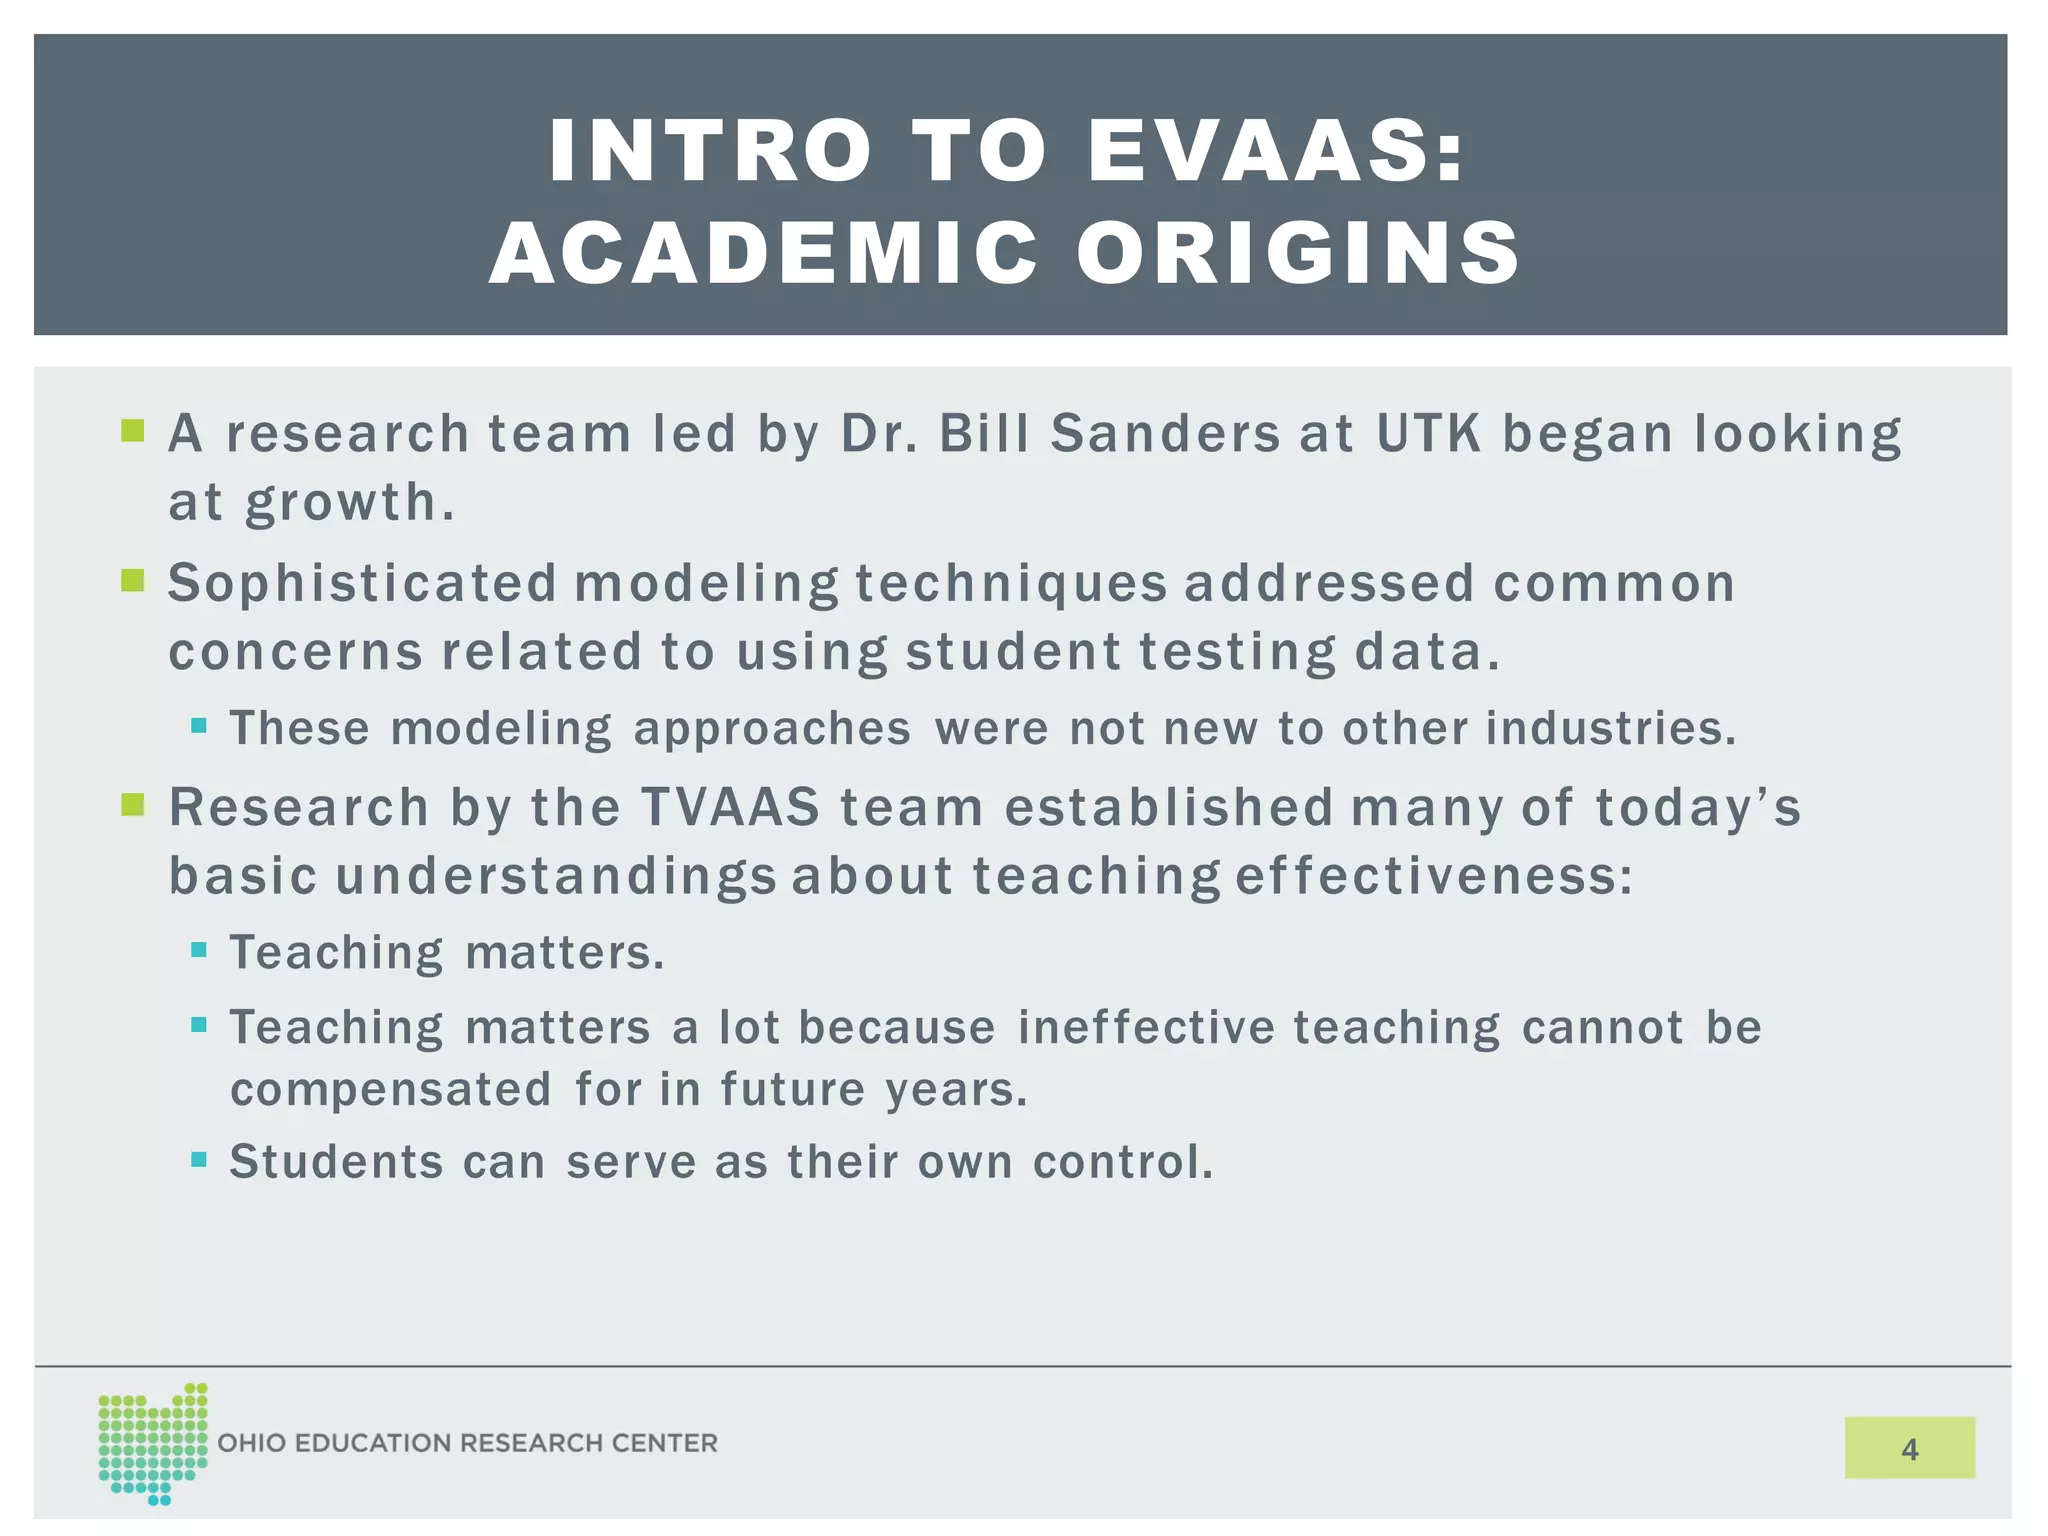
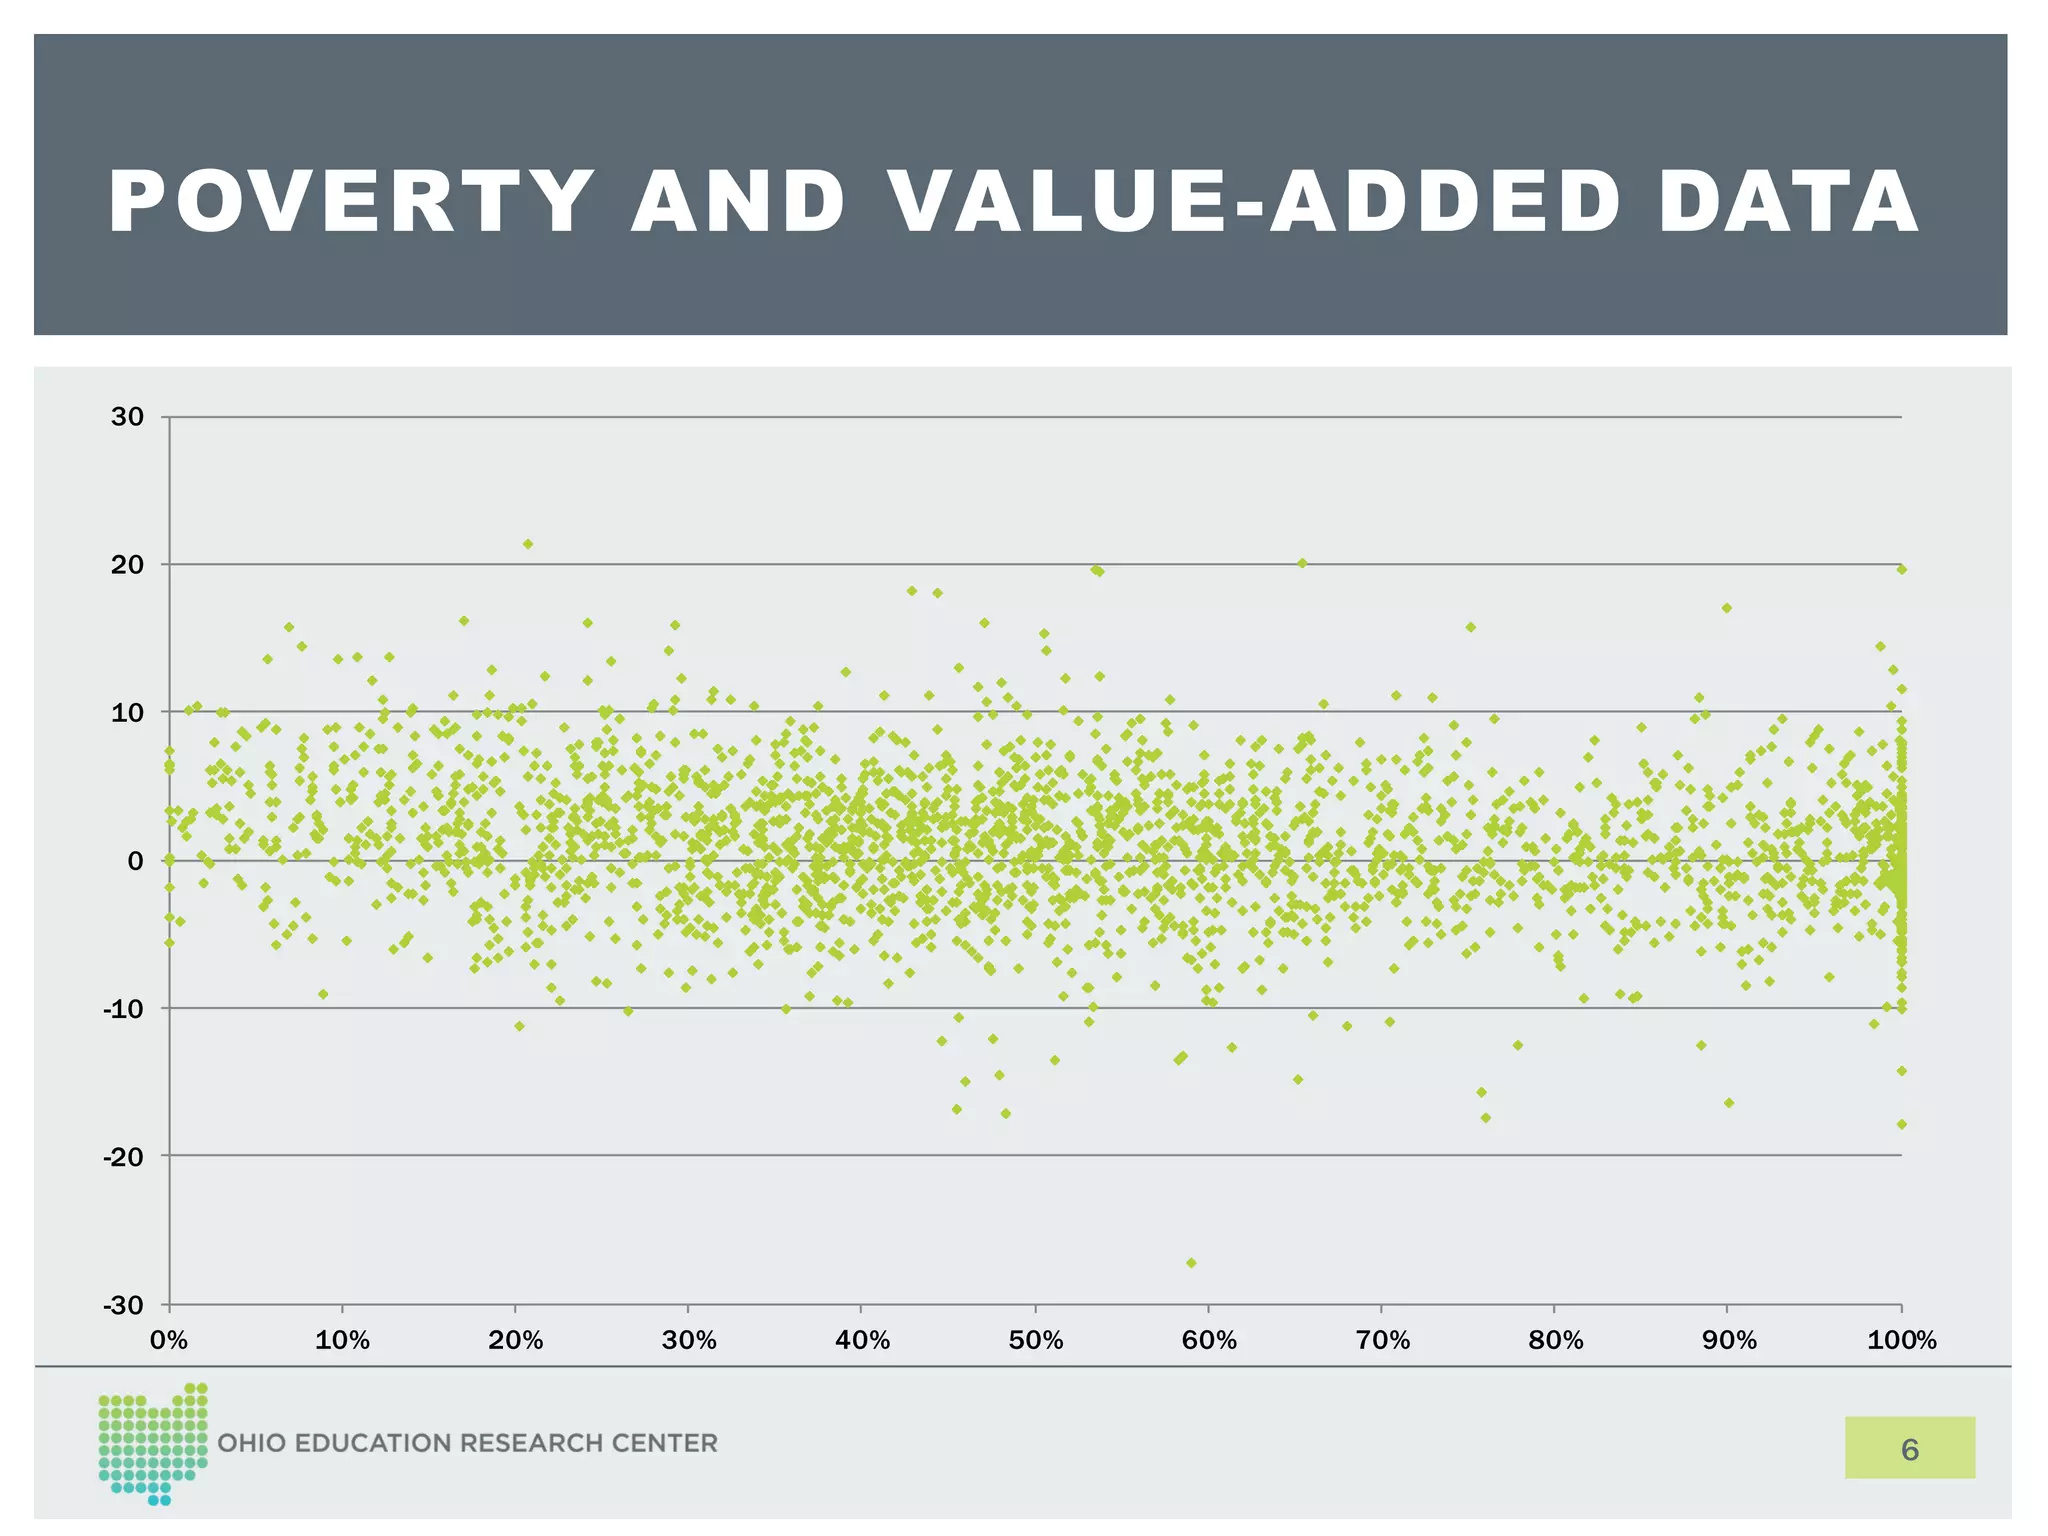
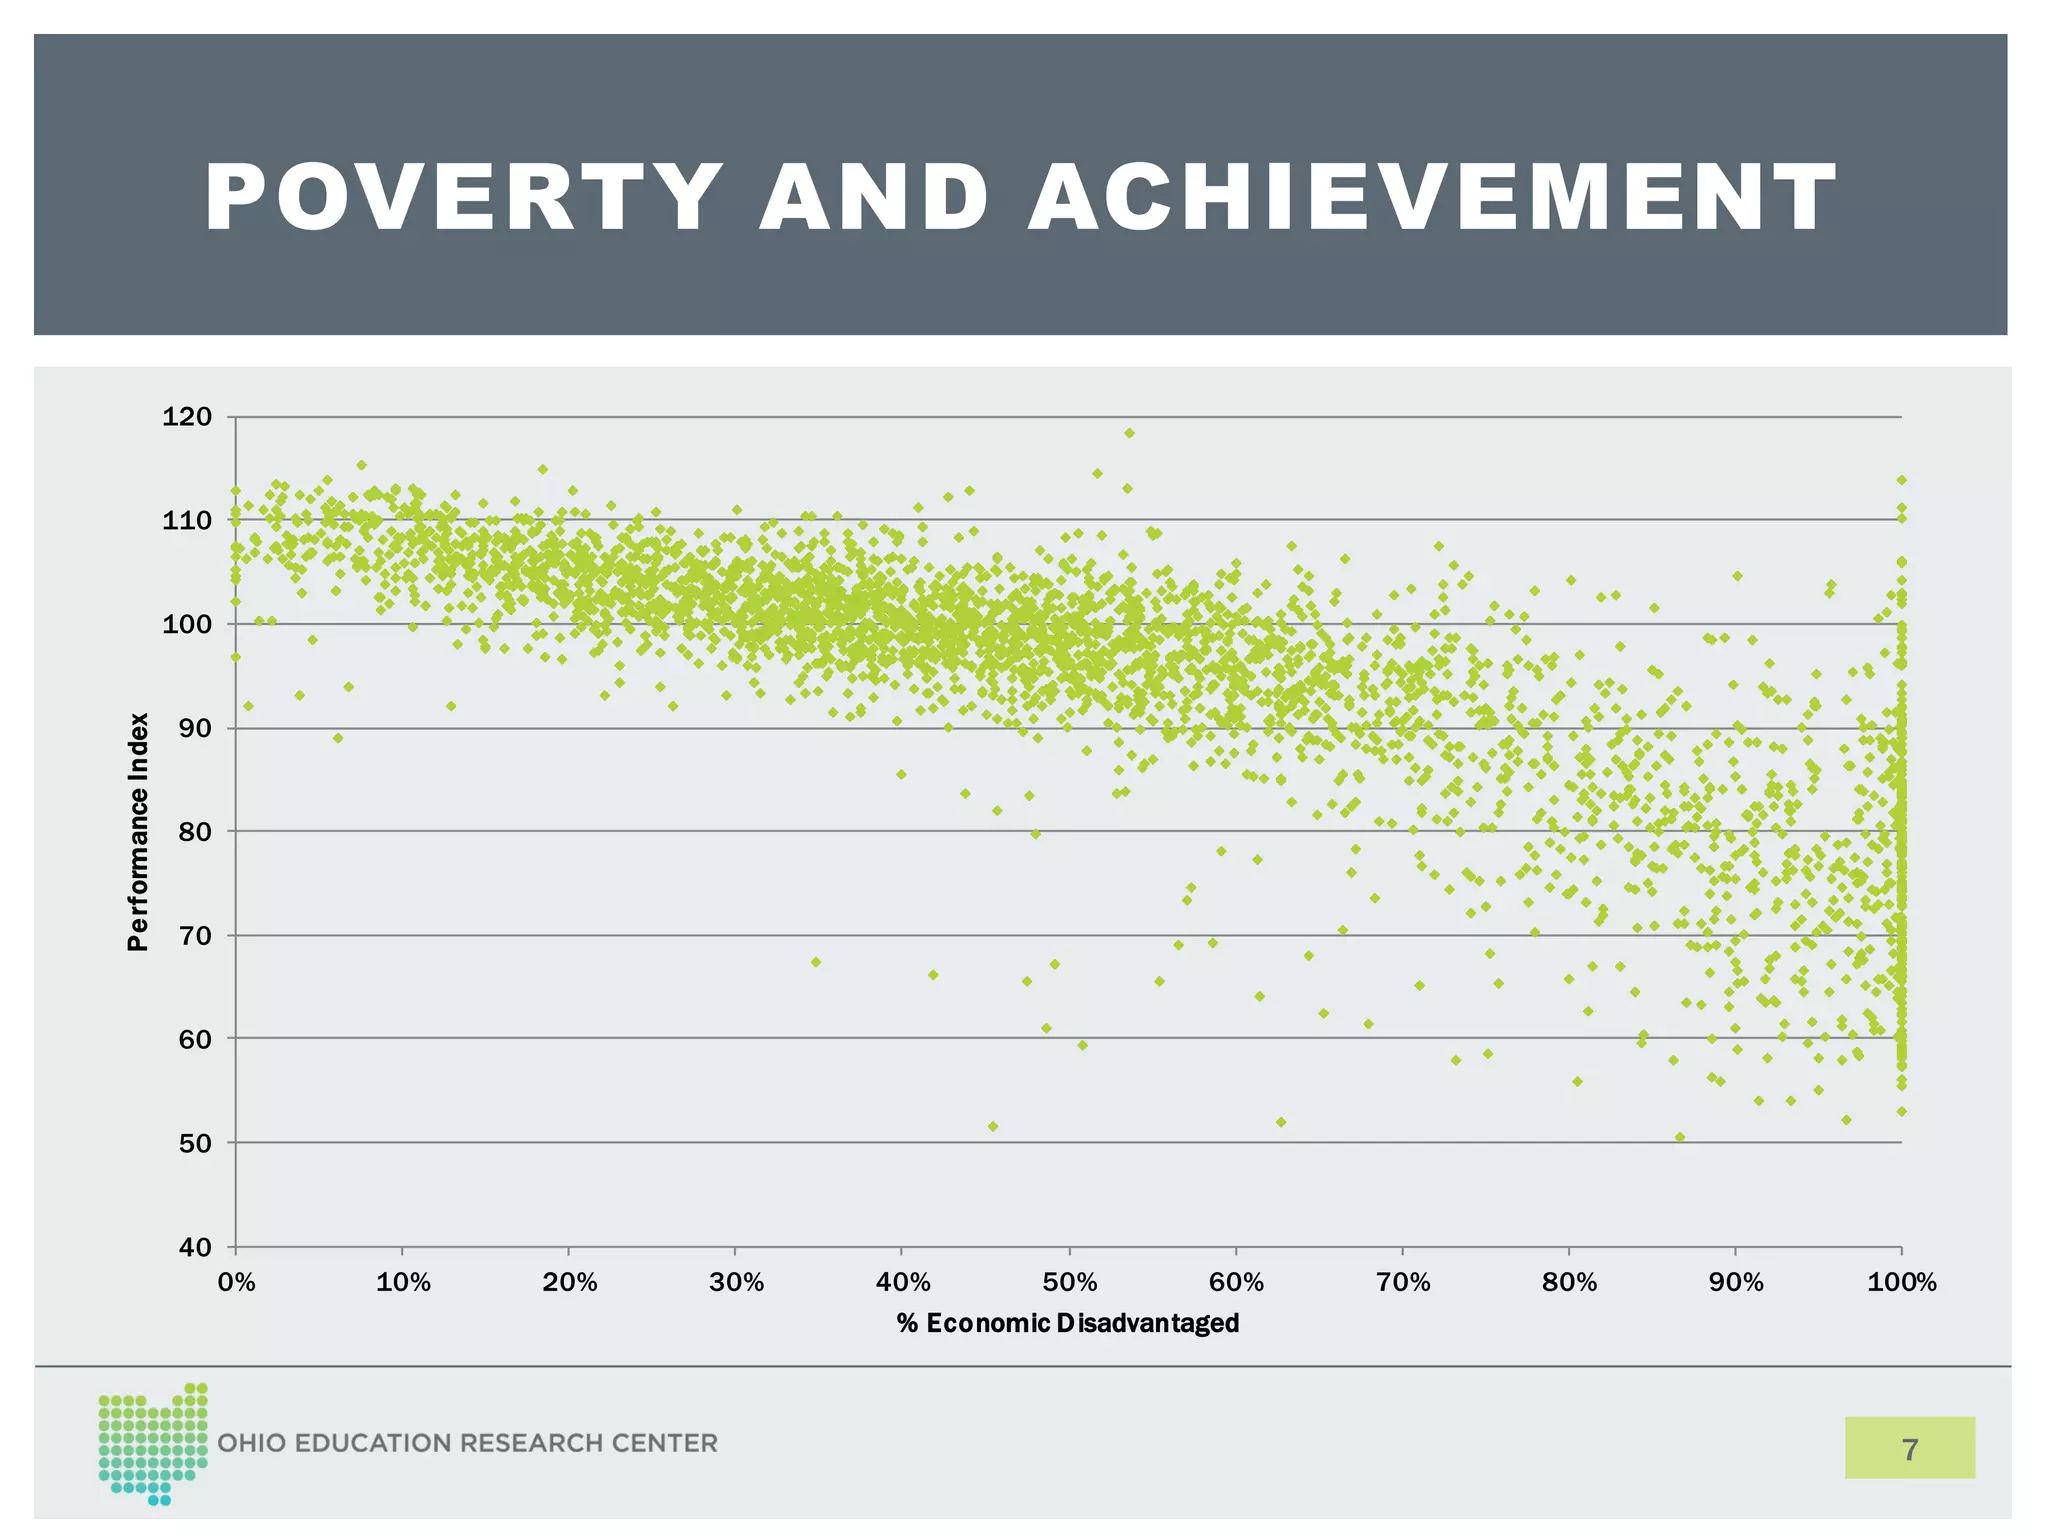

The document discusses Ohio's approach to measuring student success using value-added data. It provides an overview of Ohio's value-added timeline and system, which uses SAS EVAAS software to process data and provide diagnostic tools, accountability measures, and support for educators. The system aims to measure student growth and the impact of teaching beyond single test scores. EVAAS was developed from research on measuring teaching effectiveness, and accounts for factors like poverty that can impact achievement. Overall, the document introduces Ohio's approach to analyzing longitudinal student performance data to support classroom and school improvement efforts.


