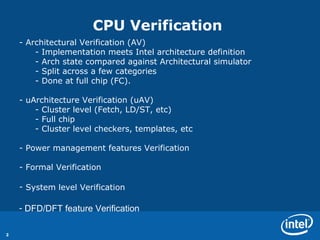
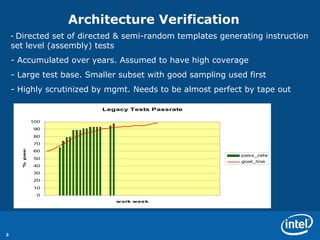
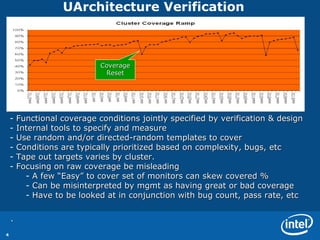
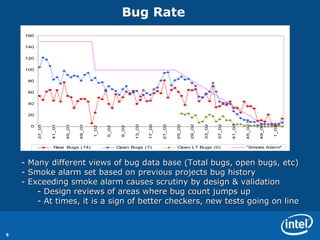
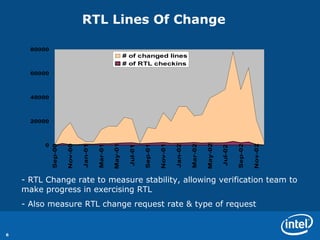
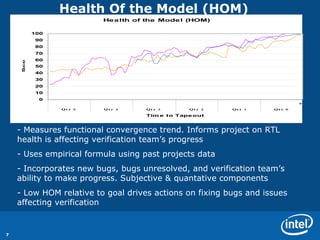
CPU Verification Metrics Shahram Salamian CPU Verification Manager  Mobility Group- Texas Design Center 6/27/2006
CPU Verification  Architectural Verification (AV)  Implementation meets Intel architecture definition  Arch state compared against Architectural simulator Split across a few categories  Done at full chip (FC).  uArchitecture Verification (uAV)  Cluster level (Fetch, LD/ST, etc) Full chip  Cluster level checkers, templates, etc Power management features Verification  Formal Verification  System level Verification   DFD/DFT feature Verification
Architecture Verification  Directed set of directed & semi-random templates generating instruction set level (assembly) tests Accumulated over years. Assumed to have high coverage  Large test base. Smaller subset with good sampling used first  Highly scrutinized by mgmt. Needs to be almost perfect by tape out
UArchitecture Verification  Functional coverage conditions jointly specified by verification & design Internal tools to specify and measure  Use random and/or directed-random templates to cover  Conditions are typically prioritized based on complexity, bugs, etc Tape out targets varies by cluster.  Focusing on raw coverage be misleading A few “Easy” to cover set of monitors can skew covered % Can be misinterpreted by mgmt as having great or bad coverage Have to be looked at in conjunction with bug count, pass rate, etc  ` Coverage Reset
Bug Rate  Many different views of bug data base (Total bugs, open bugs, etc) Smoke alarm set based on previous projects bug history Exceeding smoke alarm causes scrutiny by design & validation  Design reviews of areas where bug count jumps up At times, it is a sign of better checkers, new tests going on line
RTL Lines Of Change  RTL Change rate to measure stability, allowing verification team to make progress in exercising RTL  Also measure RTL change request rate & type of request
Health Of the Model (HOM)  Measures functional convergence trend. Informs project on RTL health is affecting verification team’s progress Uses empirical formula using past projects data  Incorporates new bugs, bugs unresolved, and verification team’s ability to make progress. Subjective & quantative components Low HOM relative to goal drives actions on fixing bugs and issues affecting verification
2 nd  Tier metrics  Cycles run each week, licenses, etc  Bugs caught at full chip vs cluster.  Used to improve test bench quality Bug cause  New condition hit or as result of timing, other bug fix, etc Test bench & other validation collateral bugs

Dv club foils_intel_austin

  • 1.
    CPU Verification MetricsShahram Salamian CPU Verification Manager Mobility Group- Texas Design Center 6/27/2006
  • 2.
    CPU Verification Architectural Verification (AV) Implementation meets Intel architecture definition Arch state compared against Architectural simulator Split across a few categories Done at full chip (FC). uArchitecture Verification (uAV) Cluster level (Fetch, LD/ST, etc) Full chip Cluster level checkers, templates, etc Power management features Verification Formal Verification System level Verification DFD/DFT feature Verification
  • 3.
    Architecture Verification Directed set of directed & semi-random templates generating instruction set level (assembly) tests Accumulated over years. Assumed to have high coverage Large test base. Smaller subset with good sampling used first Highly scrutinized by mgmt. Needs to be almost perfect by tape out
  • 4.
    UArchitecture Verification Functional coverage conditions jointly specified by verification & design Internal tools to specify and measure Use random and/or directed-random templates to cover Conditions are typically prioritized based on complexity, bugs, etc Tape out targets varies by cluster. Focusing on raw coverage be misleading A few “Easy” to cover set of monitors can skew covered % Can be misinterpreted by mgmt as having great or bad coverage Have to be looked at in conjunction with bug count, pass rate, etc ` Coverage Reset
  • 5.
    Bug Rate Many different views of bug data base (Total bugs, open bugs, etc) Smoke alarm set based on previous projects bug history Exceeding smoke alarm causes scrutiny by design & validation Design reviews of areas where bug count jumps up At times, it is a sign of better checkers, new tests going on line
  • 6.
    RTL Lines OfChange RTL Change rate to measure stability, allowing verification team to make progress in exercising RTL Also measure RTL change request rate & type of request
  • 7.
    Health Of theModel (HOM) Measures functional convergence trend. Informs project on RTL health is affecting verification team’s progress Uses empirical formula using past projects data Incorporates new bugs, bugs unresolved, and verification team’s ability to make progress. Subjective & quantative components Low HOM relative to goal drives actions on fixing bugs and issues affecting verification
  • 8.
    2 nd Tier metrics Cycles run each week, licenses, etc Bugs caught at full chip vs cluster. Used to improve test bench quality Bug cause New condition hit or as result of timing, other bug fix, etc Test bench & other validation collateral bugs