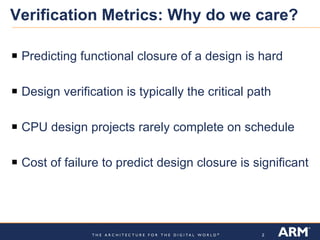
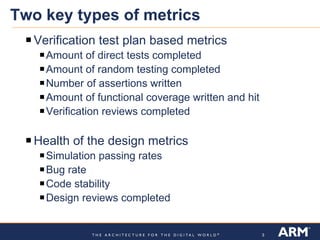
Verification Metrics Dave Williamson CPU Verification and Modeling Manager Austin Design Center June 2006
Verification Metrics: Why do we care? Predicting functional closure of a design is hard Design verification is typically the critical path CPU design projects rarely complete on schedule  Cost of failure to predict design closure is significant
Two key types of metrics Verification test plan based metrics Amount of direct tests completed  Amount of random testing completed Number of assertions written  Amount of functional coverage written and hit  Verification reviews completed Health of the design metrics Simulation passing rates Bug rate  Code stability Design reviews completed
Challenges and limitations Limitations of test plan based metrics Will give a best case answer for completion date The plan will grow as testing continues Limitations of health of the design based metrics Can give false impressions if used independent from test plan metrics Requires good historical data on similar project for proper interpretation General concerns to be aware of for all metrics What you measure will affect what you do Gathering metrics is not free Historical data can be misleading Don’t be a slave to the metrics:  they are a great tool, but not the complete answer
Bug rate example Knee in curve
Bug rate by unit example
Functional Coverage closure example New coverage points added

Arm validation metrics

  • 1.
    Verification Metrics DaveWilliamson CPU Verification and Modeling Manager Austin Design Center June 2006
  • 2.
    Verification Metrics: Whydo we care? Predicting functional closure of a design is hard Design verification is typically the critical path CPU design projects rarely complete on schedule Cost of failure to predict design closure is significant
  • 3.
    Two key typesof metrics Verification test plan based metrics Amount of direct tests completed Amount of random testing completed Number of assertions written Amount of functional coverage written and hit Verification reviews completed Health of the design metrics Simulation passing rates Bug rate Code stability Design reviews completed
  • 4.
    Challenges and limitationsLimitations of test plan based metrics Will give a best case answer for completion date The plan will grow as testing continues Limitations of health of the design based metrics Can give false impressions if used independent from test plan metrics Requires good historical data on similar project for proper interpretation General concerns to be aware of for all metrics What you measure will affect what you do Gathering metrics is not free Historical data can be misleading Don’t be a slave to the metrics: they are a great tool, but not the complete answer
  • 5.
    Bug rate exampleKnee in curve
  • 6.
    Bug rate byunit example
  • 7.
    Functional Coverage closureexample New coverage points added

Editor's Notes

  • #3 1. More so than other areas of processor design, visibility of completion is still fairly low at the end of the project. Dreaded “when will we find the last bug” question. 2. Verification complexity increases non-linearly with design complexity 3. empirical evidence shows that projects are almost always delayed. Best case they hit the externally published schedule, but usually this is the 2 nd or 3 rd internal schedule… 4. Conservative estimates means lost design win opportunities, Optimistic estimates means slipped schedules or buggy silicon
  • #4 1. Verification metrics are what is controlled by the DV team, health of the design is somewhat out of the control of the DV team 2. All metrics can be applied to full chip, or unit level of the design
  • #5 Test plan only covers what you know to do, not what do don’t know yet you need to do Test plan is non-exhaustive and when you find bugs in the design, new corner cases are exposed. This will happen all the way to the end of the project (historical data can help) Health of the design can look better or worse than what it really is based on what is currently happening on the testing side Most health of the design metrics are trailing indicators, so you really need good historical data on similar projects to make full use of them Need to be careful to avoid meeting the letter of the law but not the intent: For example, if you have hard metrics on cycles run per week or tests written per week, test/cycle quality might go down. Need to think up front about how you want to use metrics to make sure you track the right things and also need to account for the time to build the infrastructure required to do it Historical data is very useful, but every project is different, and generally speaking future projects are more complex than previous ones, so needs to be taken with a grain of salt Metrics won’t replace subjective gut feel from experience. If gut feel is that the design is not ready for tapeout, then it probably isn’t. Need to take metric results with a grain of salt. This applies to the final ‘when we done’ as well as determing critical priorities throughout the project
  • #6 Total bug graph fairly linear with one pronounced knee at about the 75% point Bugs per week pretty sporadic until it drops off at knee This is 4 week rolling average…results are even more sporadic if raw count is used
  • #7 Breakdown by unit can be useful to indicate early stablilty of certain units (or point to deficit testing) Relative number of bugs found per area is roughly consistent with expectations based on complexity of each unit SIMD unit was an early focus and got stable before the rest of the design
  • #8 Getting up to low 90% happens pretty quickly and most of the time is spent on closing the final 5% of the points Expect to have a few dips along the way as new coverage that wasn’t originally planned is added to the design May improve tracking in the future…breakout crosses vs. single points, add some way to indicate priority of points