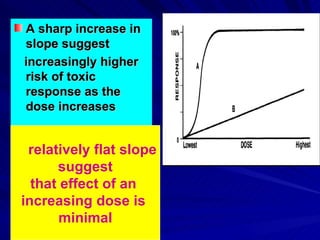
Download to read offline

![[D] (concentration units)
%
Maximal
Effect
0.01 0.10 1.00 10.00 100.00 1000.00
0.0
0.2
0.4
0.6
0.8
1.0
Partial agonist
Full Agonist
Partial agonist
PARTIAL AGONISTS - EFFICACY
Even though drugs may occupy the same # of receptors, the magnitude
of their effects may differ.](https://image.slidesharecdn.com/drc-231004195309-64a23fd6/85/DRC-pdf-25-320.jpg)
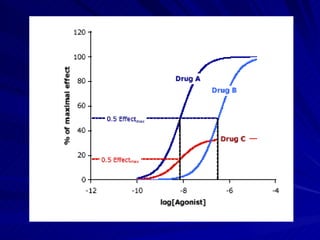
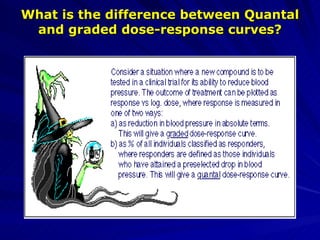
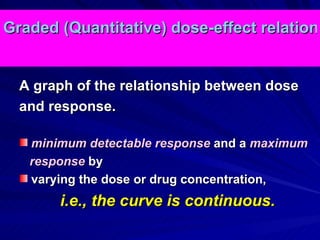
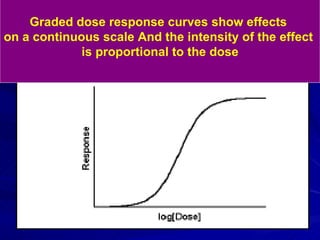
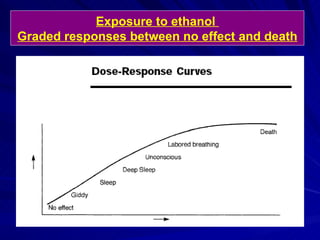
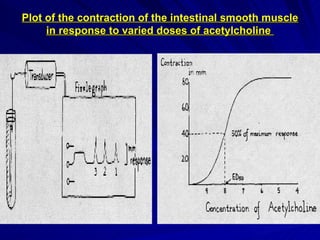
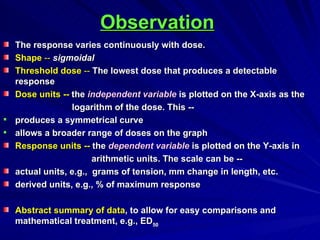
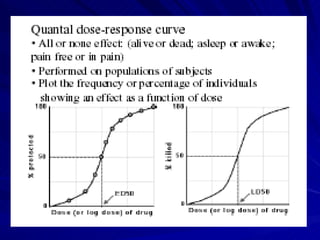

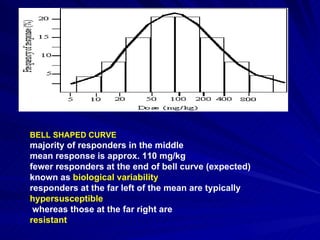
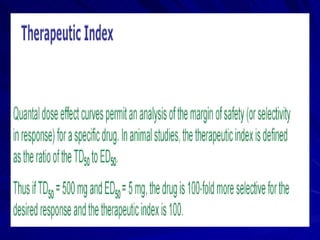
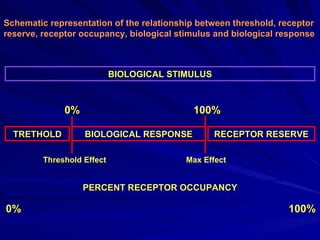

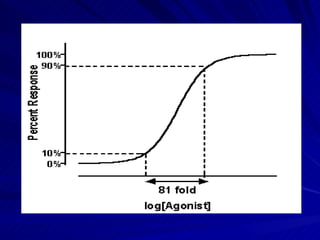
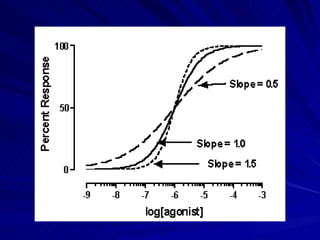
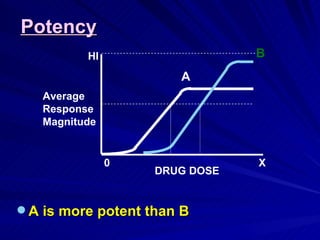
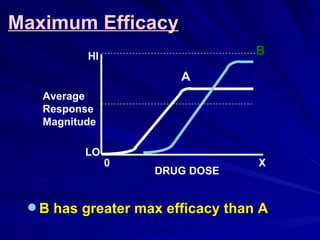
- A dose response relationship describes how the magnitude of a drug's effect varies with increasing or decreasing doses. Dose response curves plot this relationship, with dose on the x-axis and response on the y-axis. - There are two main types of dose response curves: graded/quantitative curves where response increases continuously with dose, and quantal/all-or-none curves where responses are binary above a threshold dose. - The shape, slope, efficacy and potency of a dose response curve provide information about a drug's effects, safety, and relative potencies of similar drugs. Steep curves indicate higher potency while flatter curves suggest a drug has less impact over a range of doses.


![ONFH[AVN HIP] -TRIPLE REGIME -A NOVAL SURGICAL CONCEPT .pptx](https://cdn.slidesharecdn.com/ss_thumbnails/onfhavnhip2026koaconcalicutdrgokuldevdrmashraf-260210064517-213ec005-thumbnail.jpg?width=640&height=640&fit=bounds)


