The document discusses the dose-response relationship, highlighting how the dosage of a drug affects its physiological response. It describes the dose-response curve, the distinction between graded and quantal response curves, and the concepts of drug potency and efficacy. Additionally, it explains the therapeutic index as a measure of drug safety, comparing median effective and lethal doses.
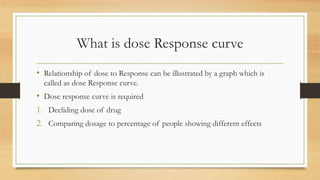
![Dose Response Relationship
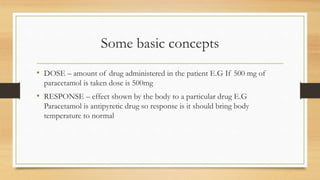
• Relationship used to analyze a kind of response Obtained after administering
specific does of drug E.G If 10mg of ILLAPRAZOLE [ppi] is administered
response is it should inhibit formation of proton pumps at 10mg specifically
• Dose response relationship has two components
1. Dose plasma concentration relationship
2. Plasma concentration response relationship](https://image.slidesharecdn.com/doseresponserelationshipcurve-220913131740-e0d8e933/85/Dose-Response-Relationship-Curve-pptx-4-320.jpg)
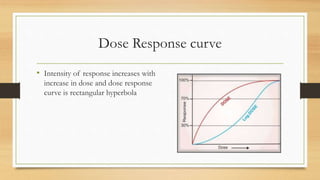
![Why dose response curve is Rectangular
hyperbola
• This is because drug-receptor interaction obeys law of mass action,
accordingly ,
• E = Emax × [D] / Kd + [D]
• Where, E = Observed effect of dose of drug , Emax = maximal respons,
Kd = dissociation constant of drug receptor complex](https://image.slidesharecdn.com/doseresponserelationshipcurve-220913131740-e0d8e933/85/Dose-Response-Relationship-Curve-pptx-7-320.jpg)