Downloaded 861 times
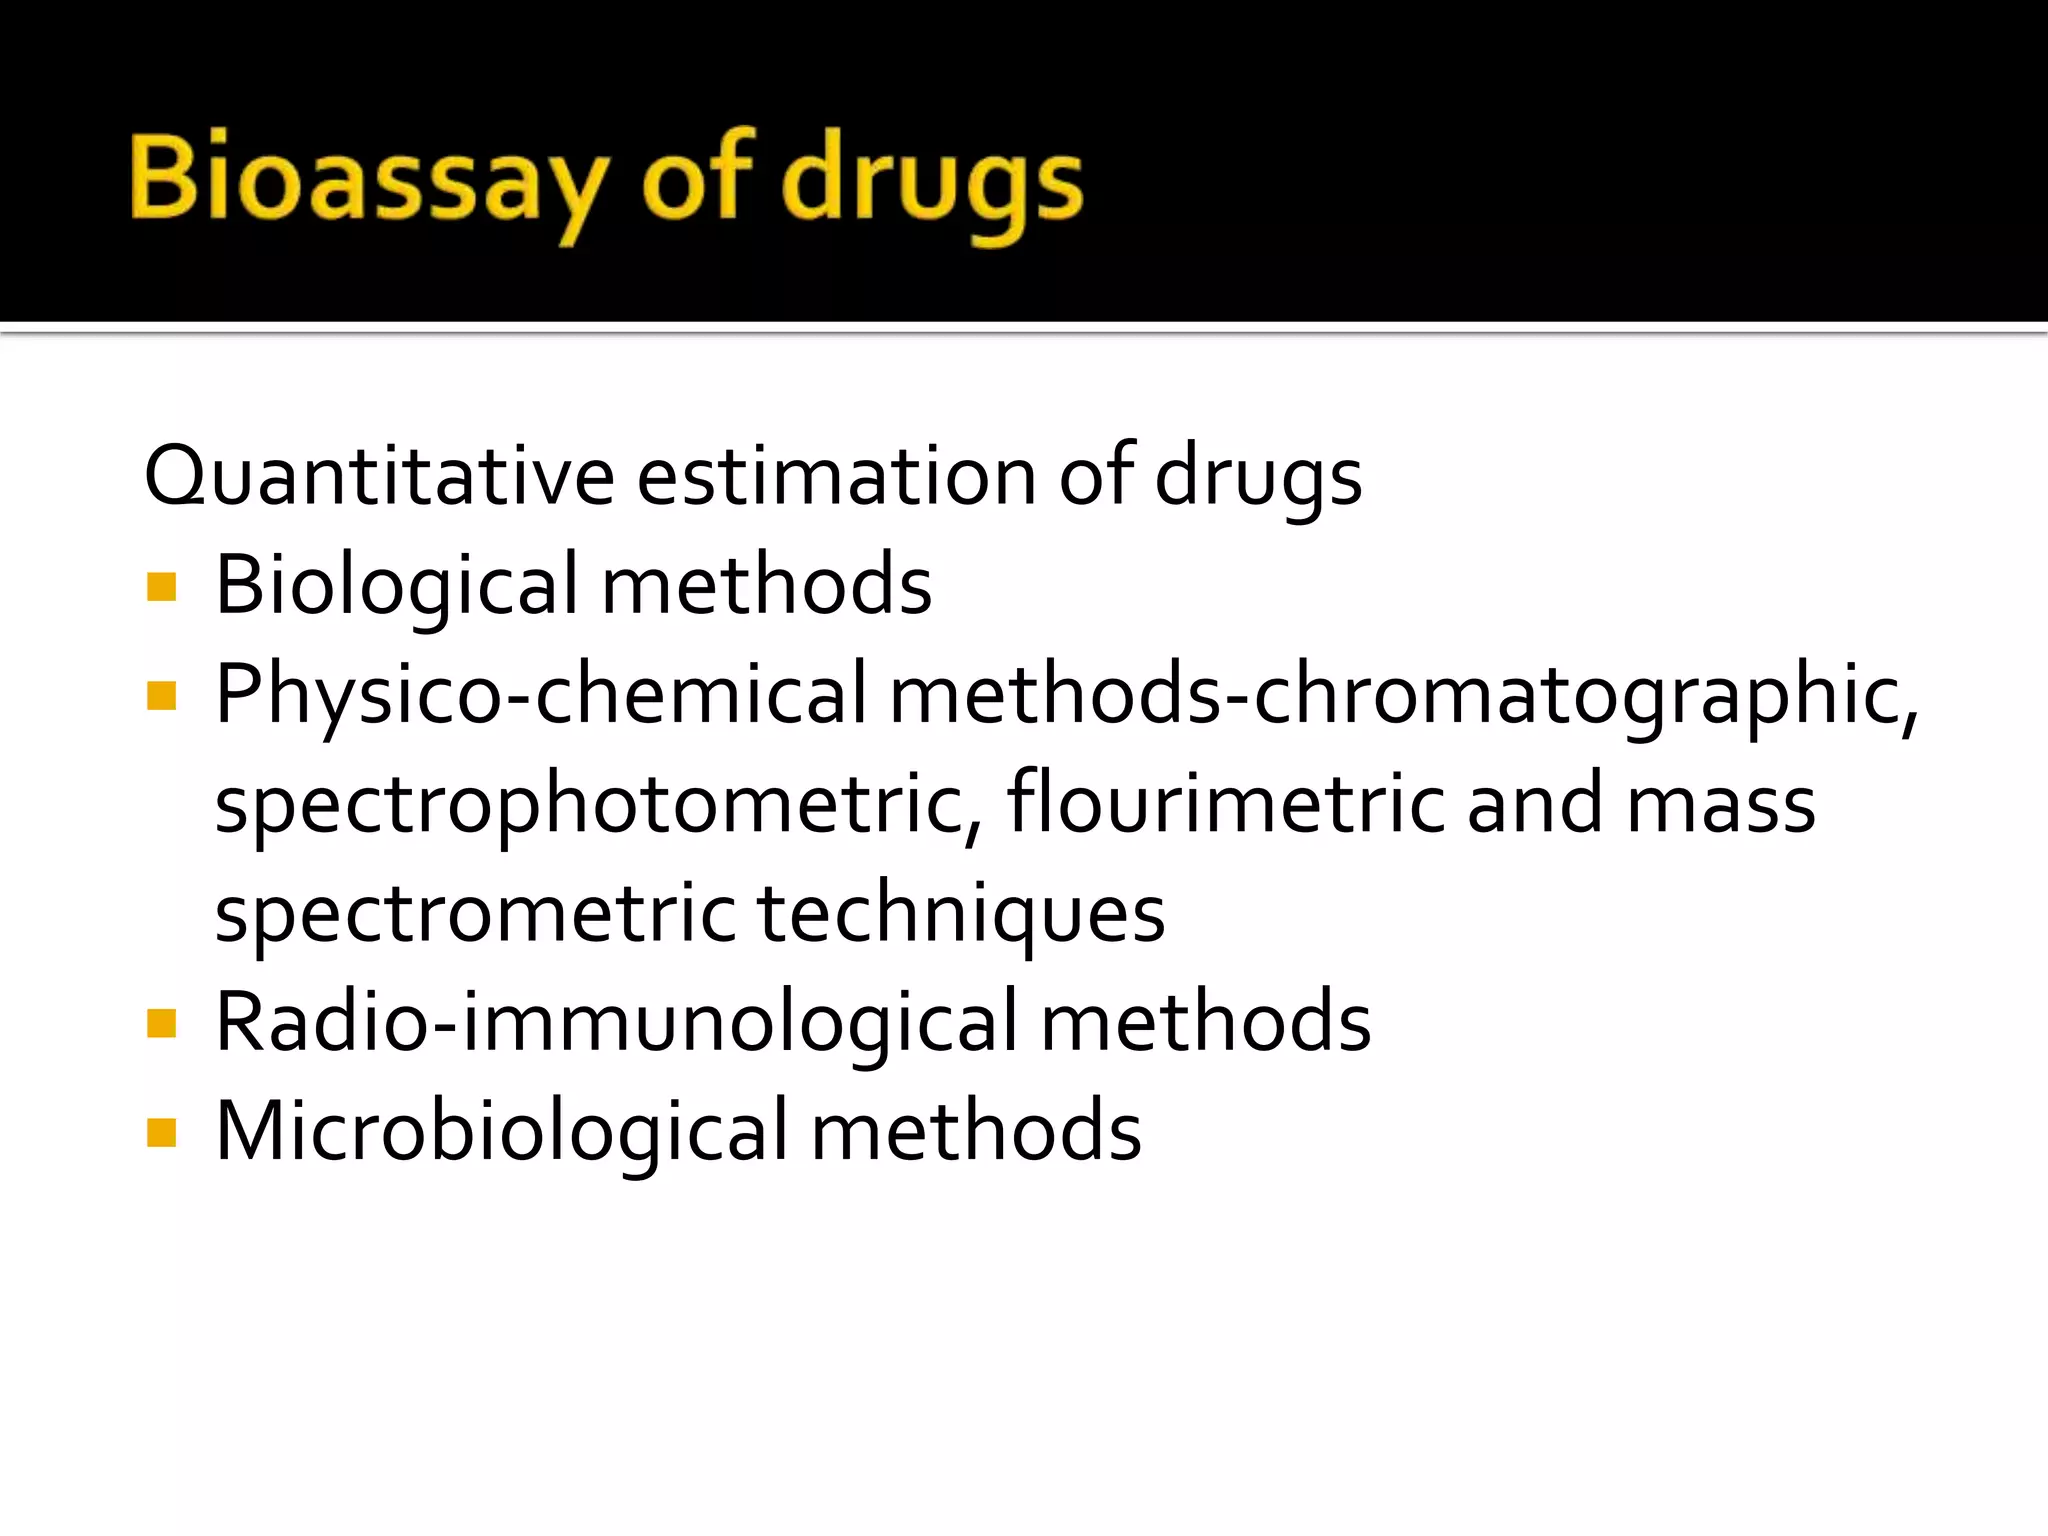

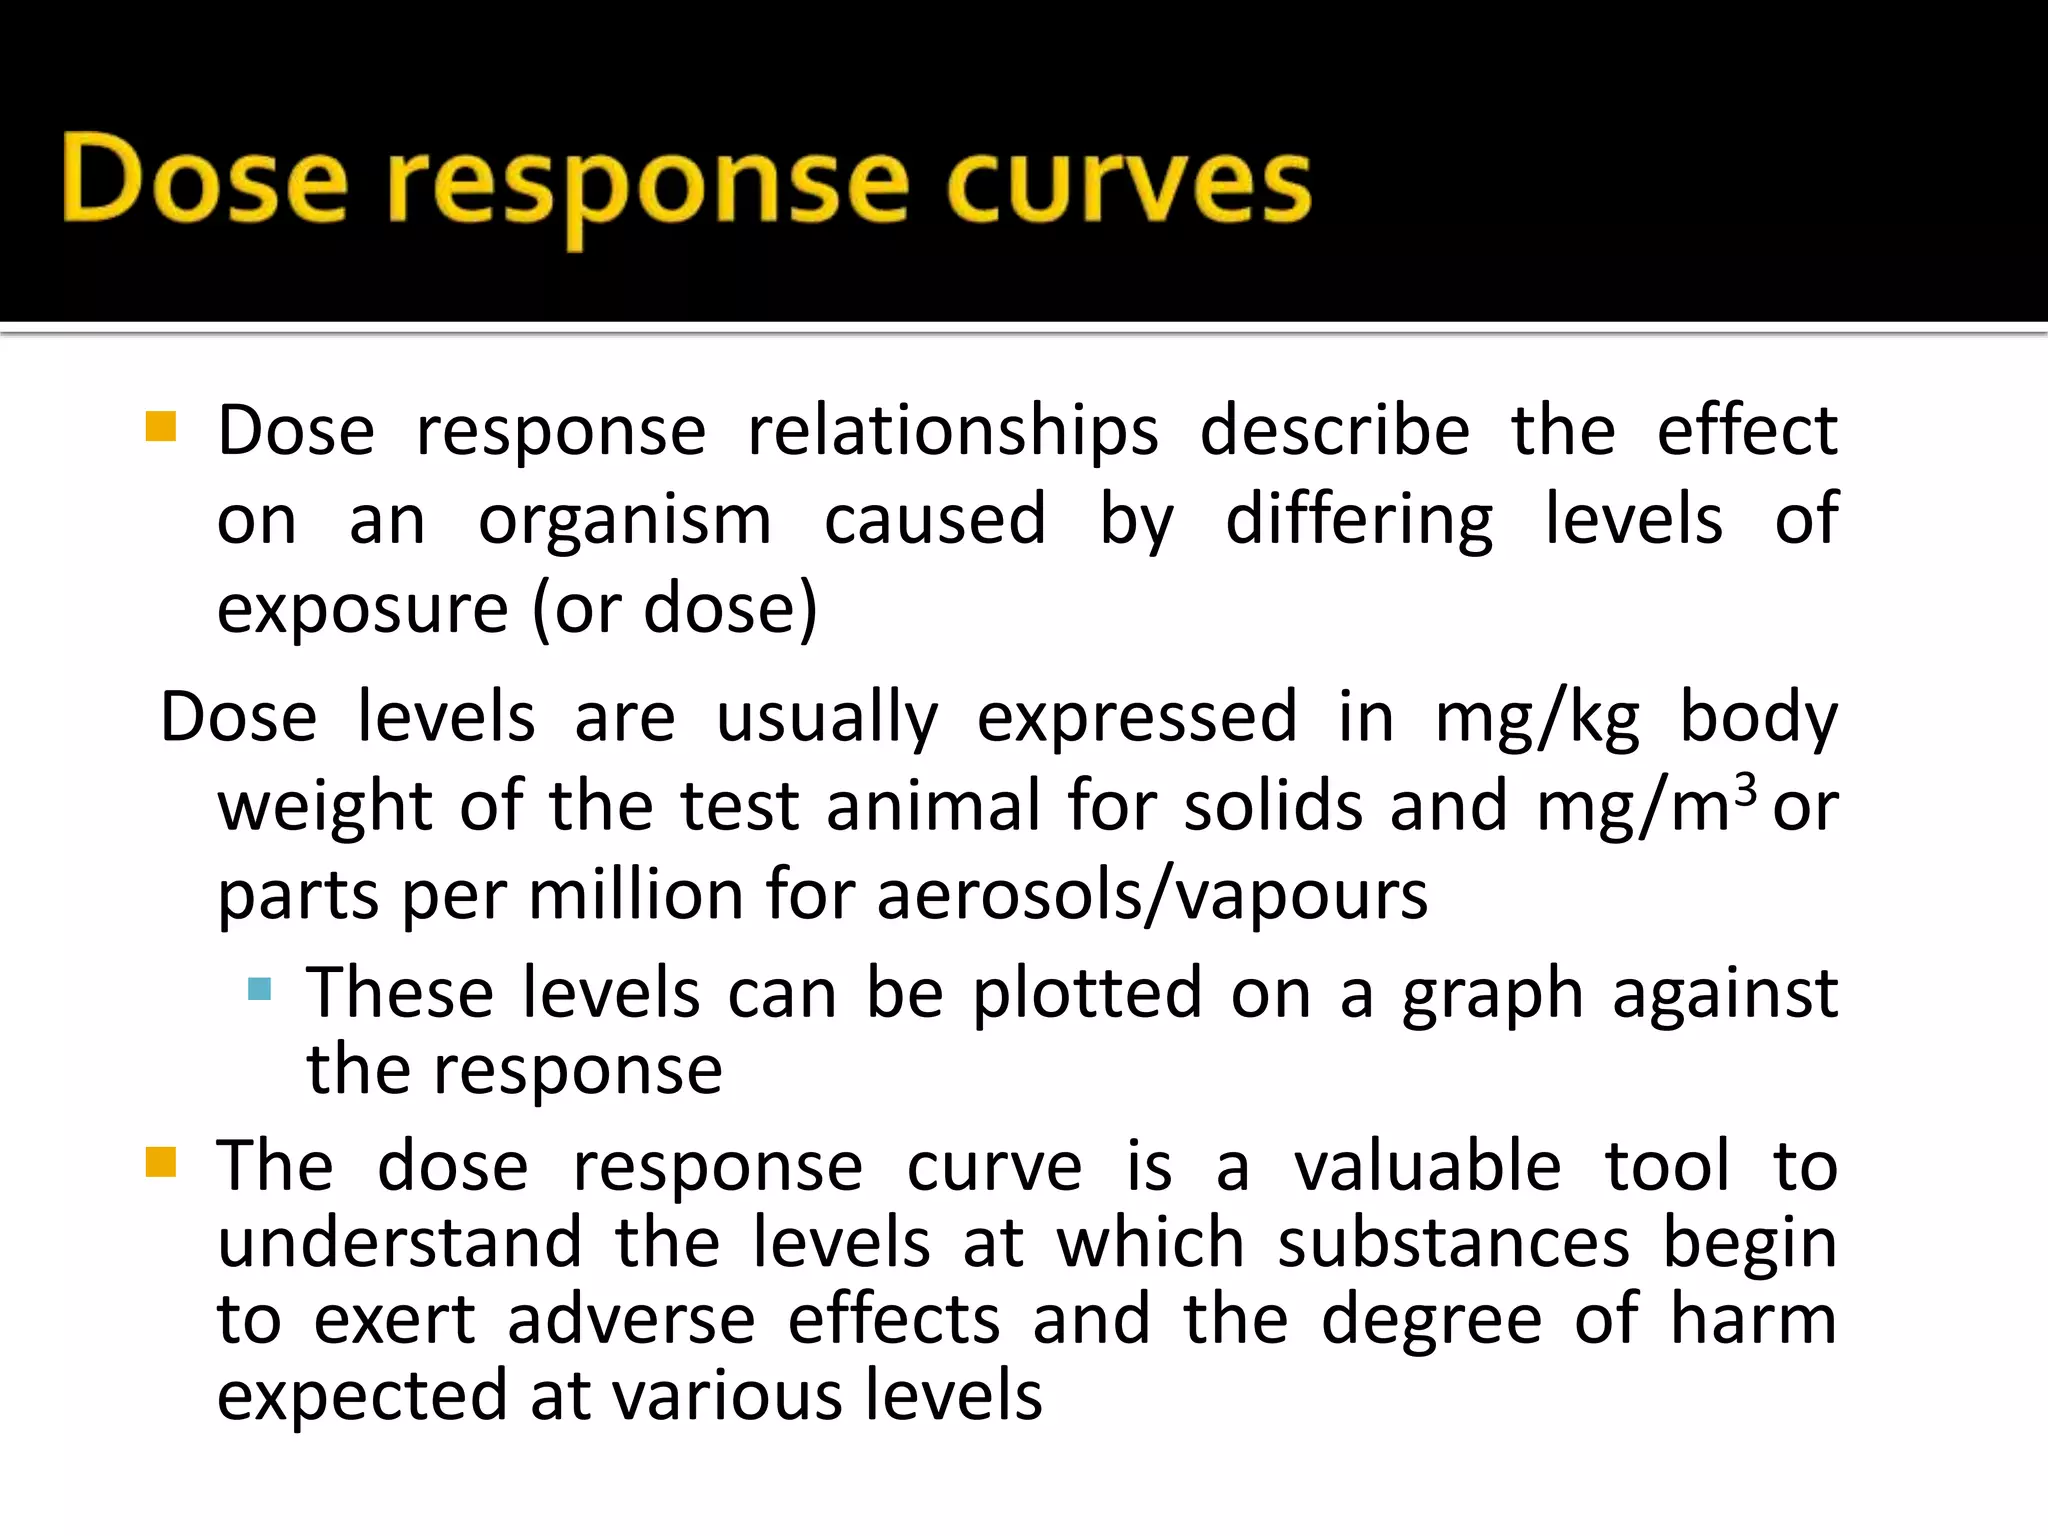
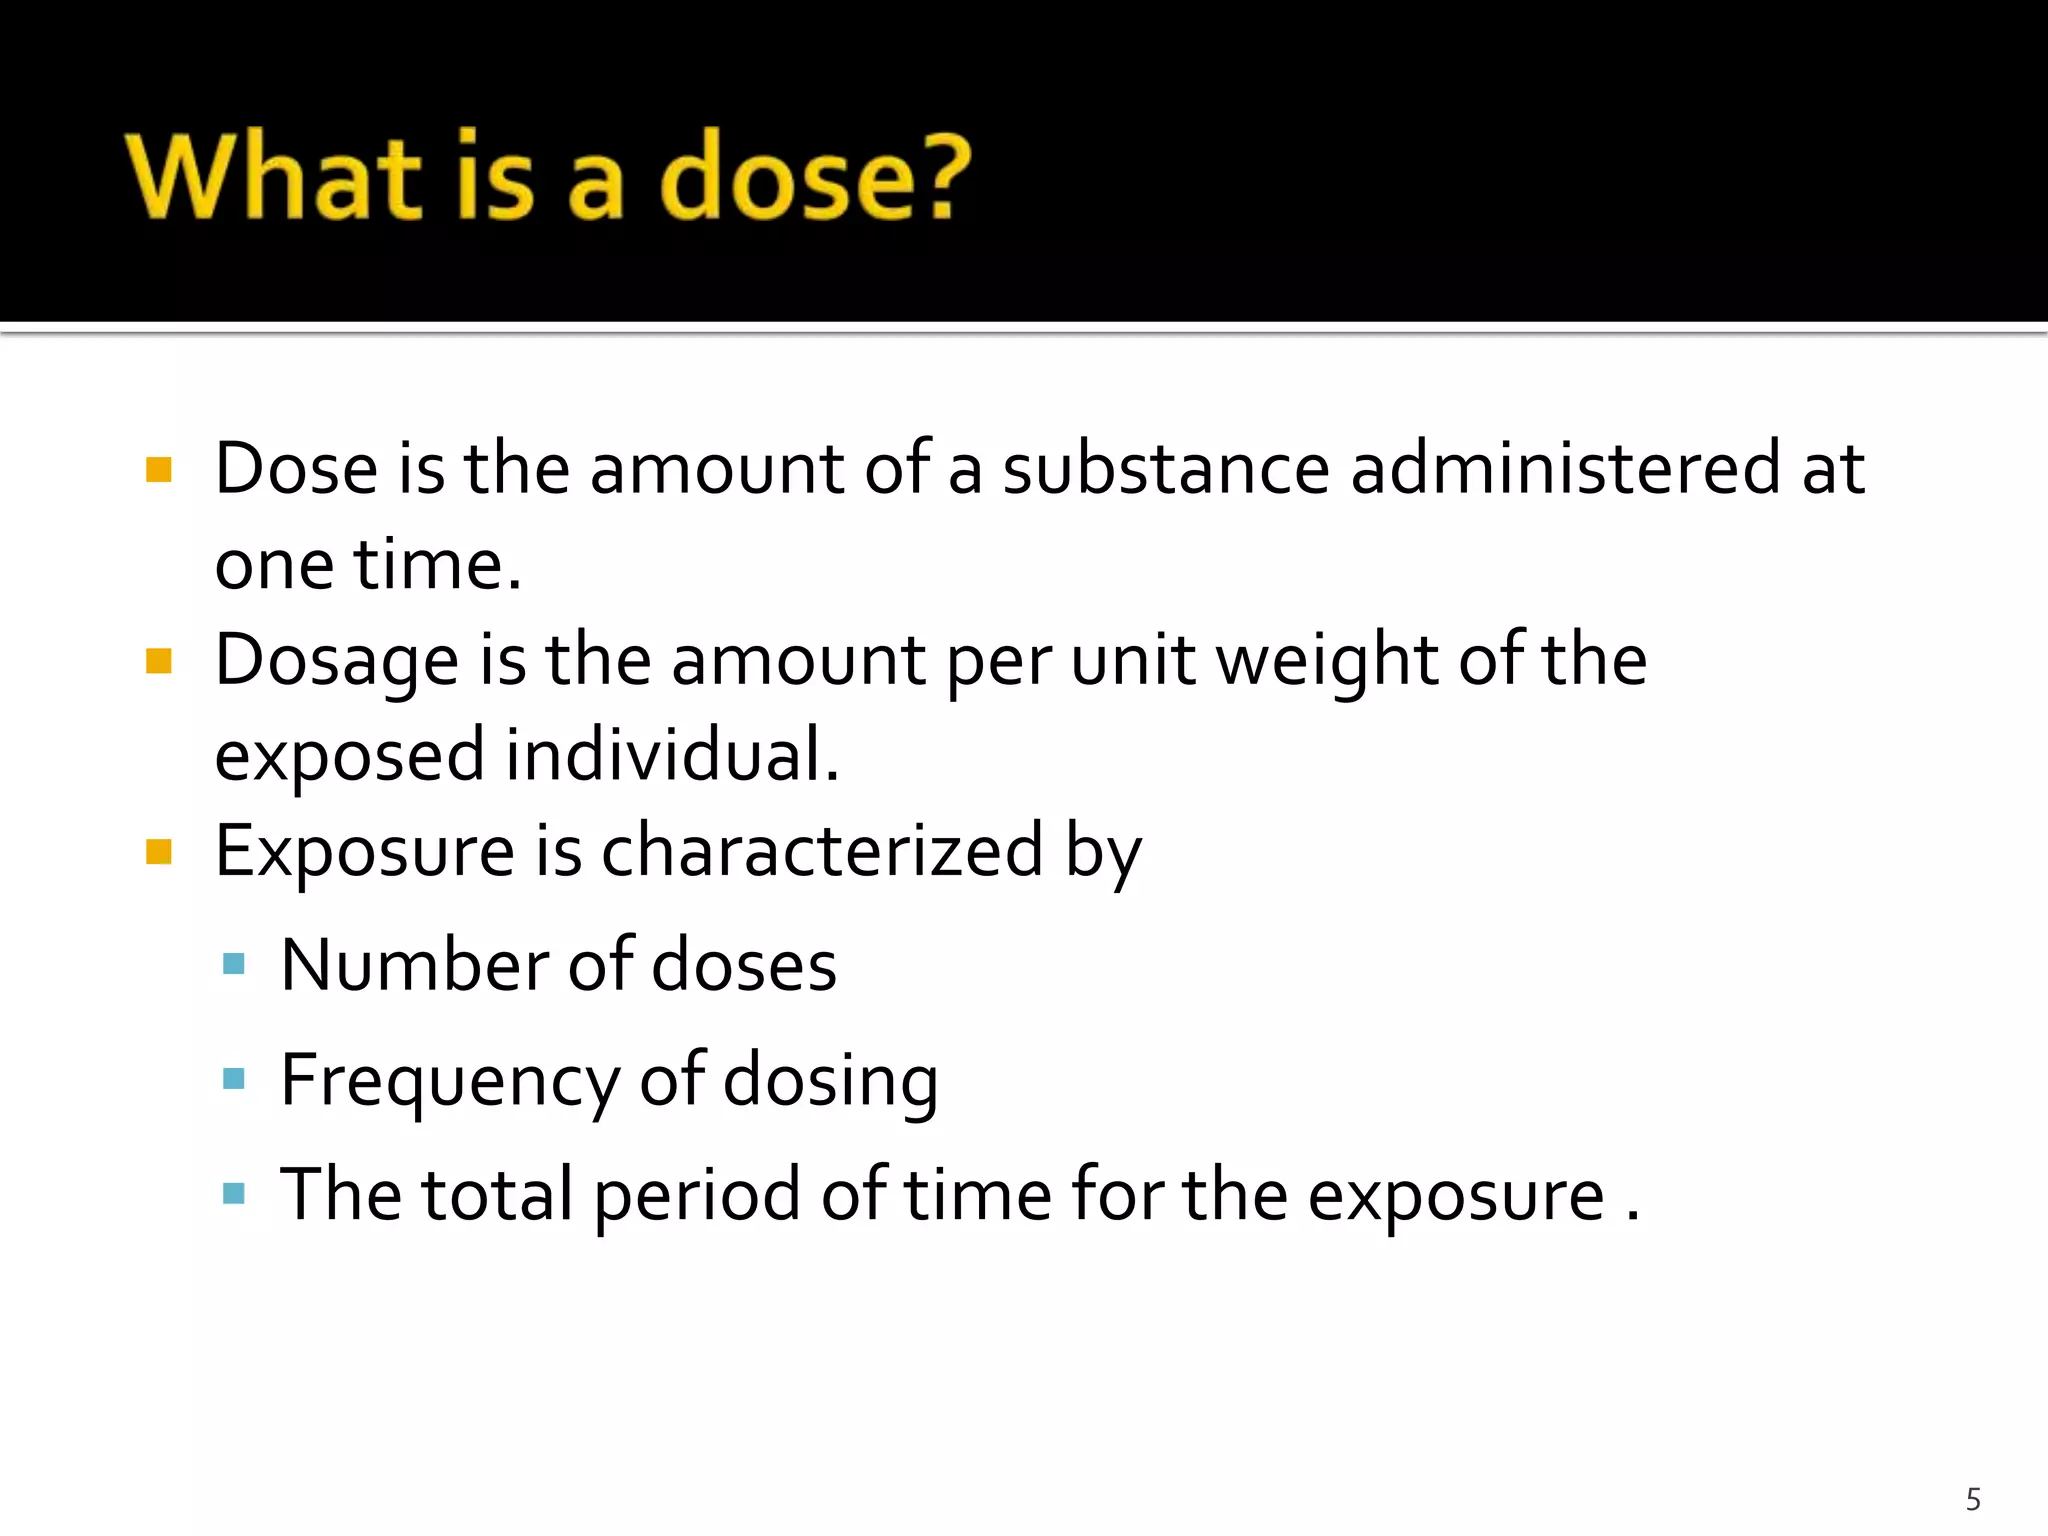
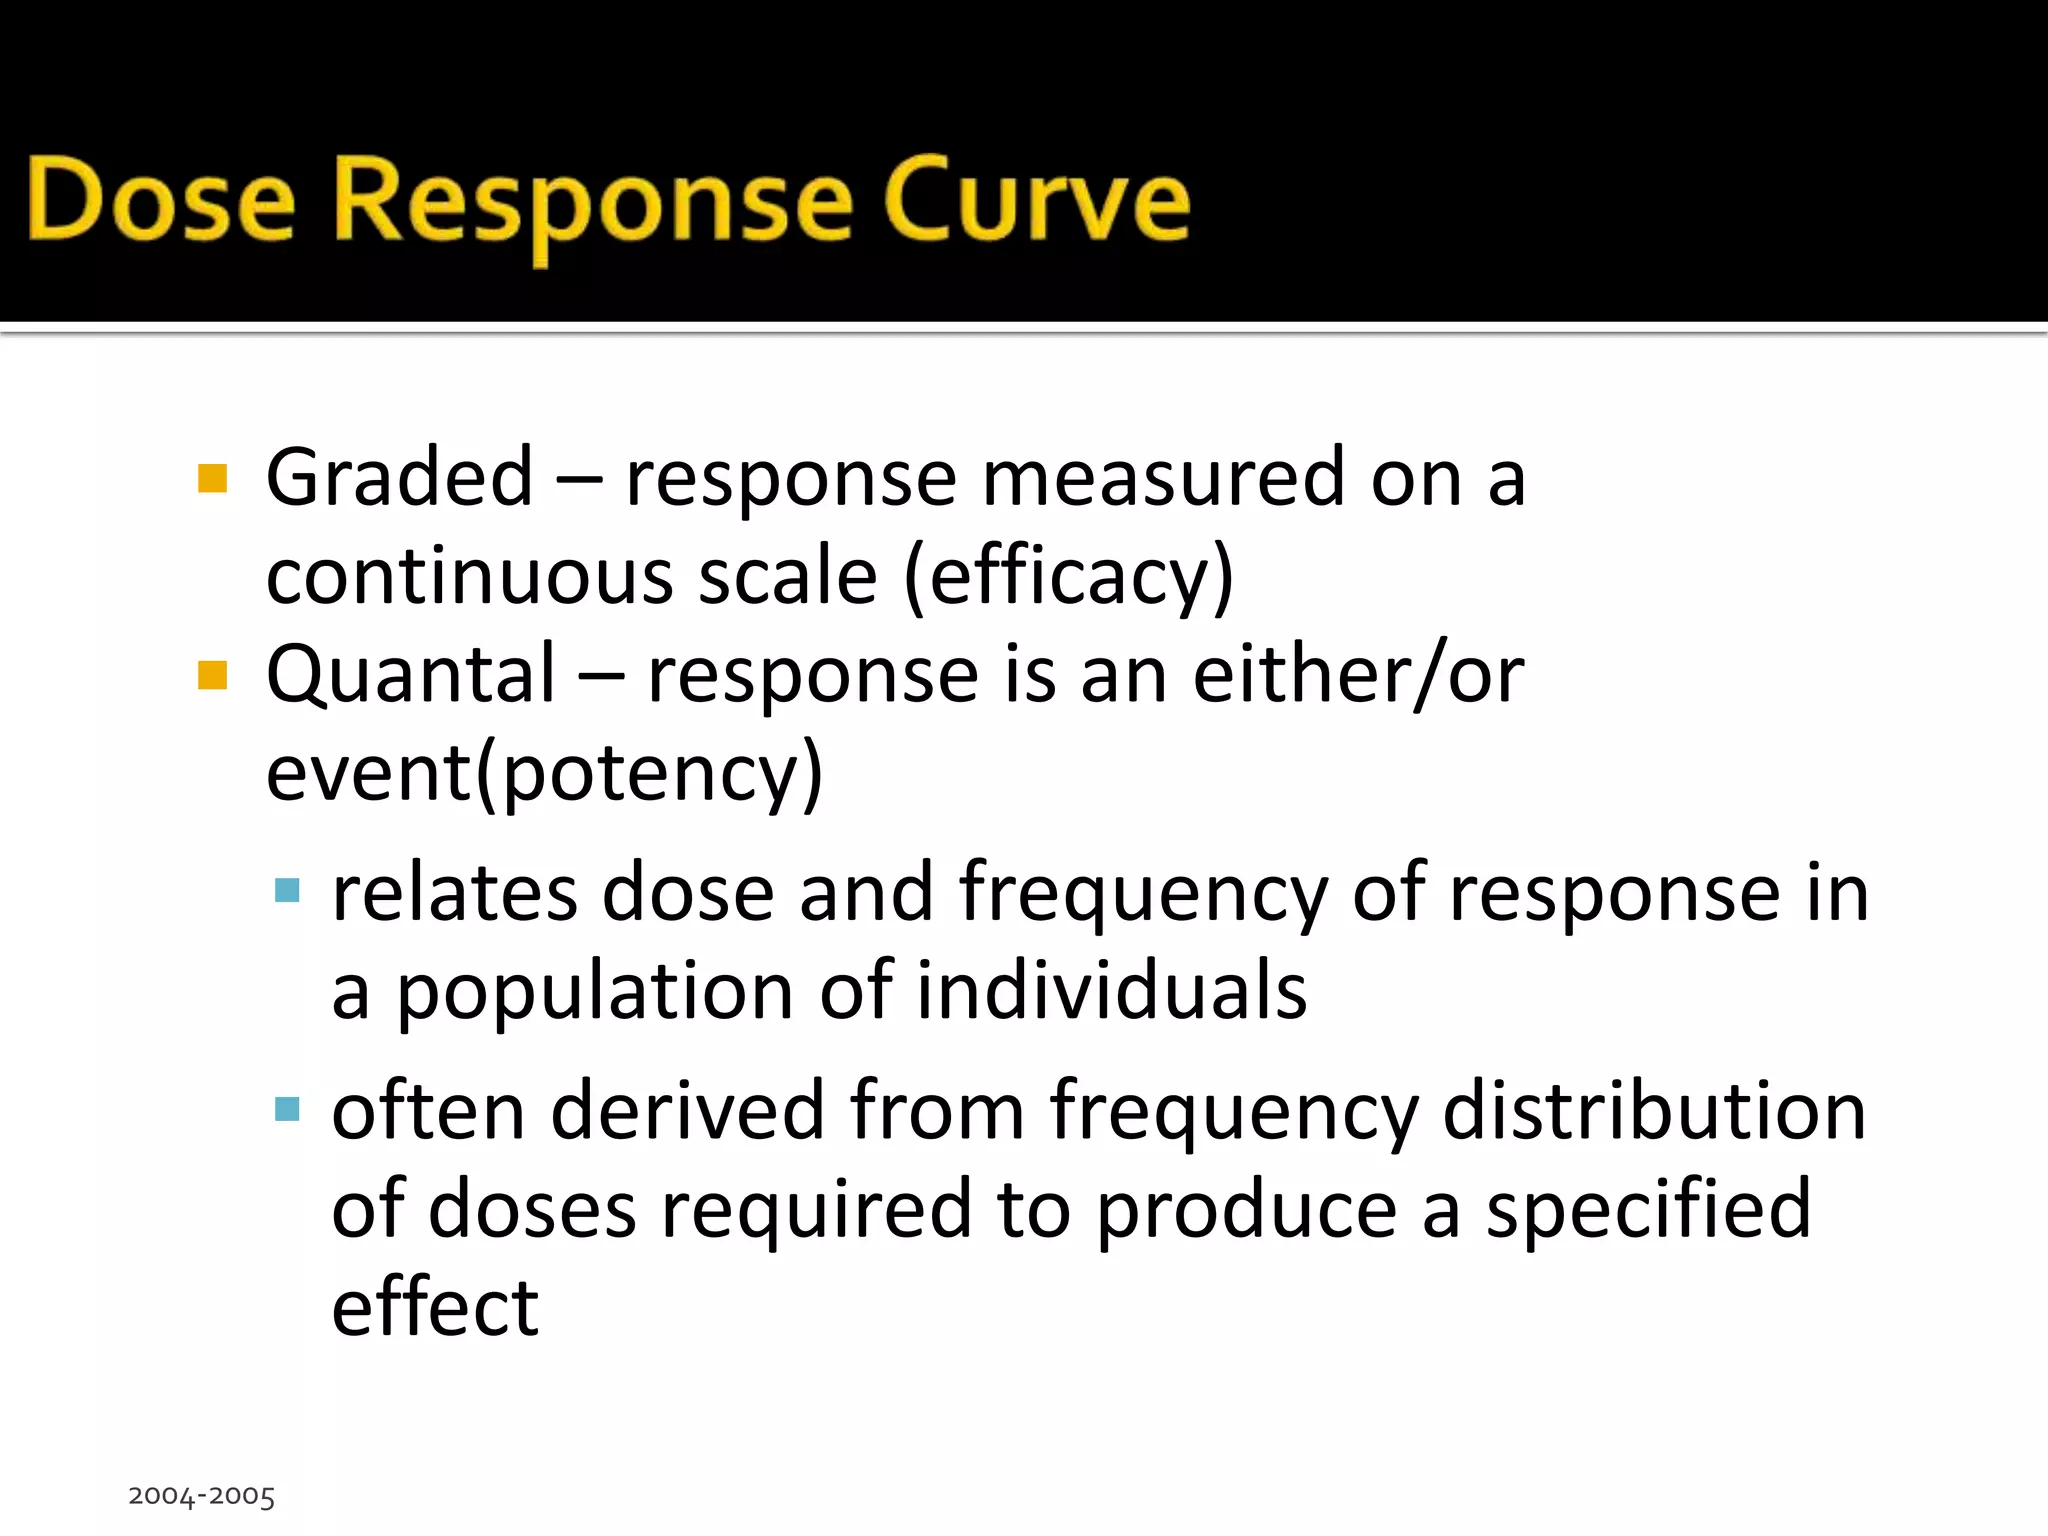
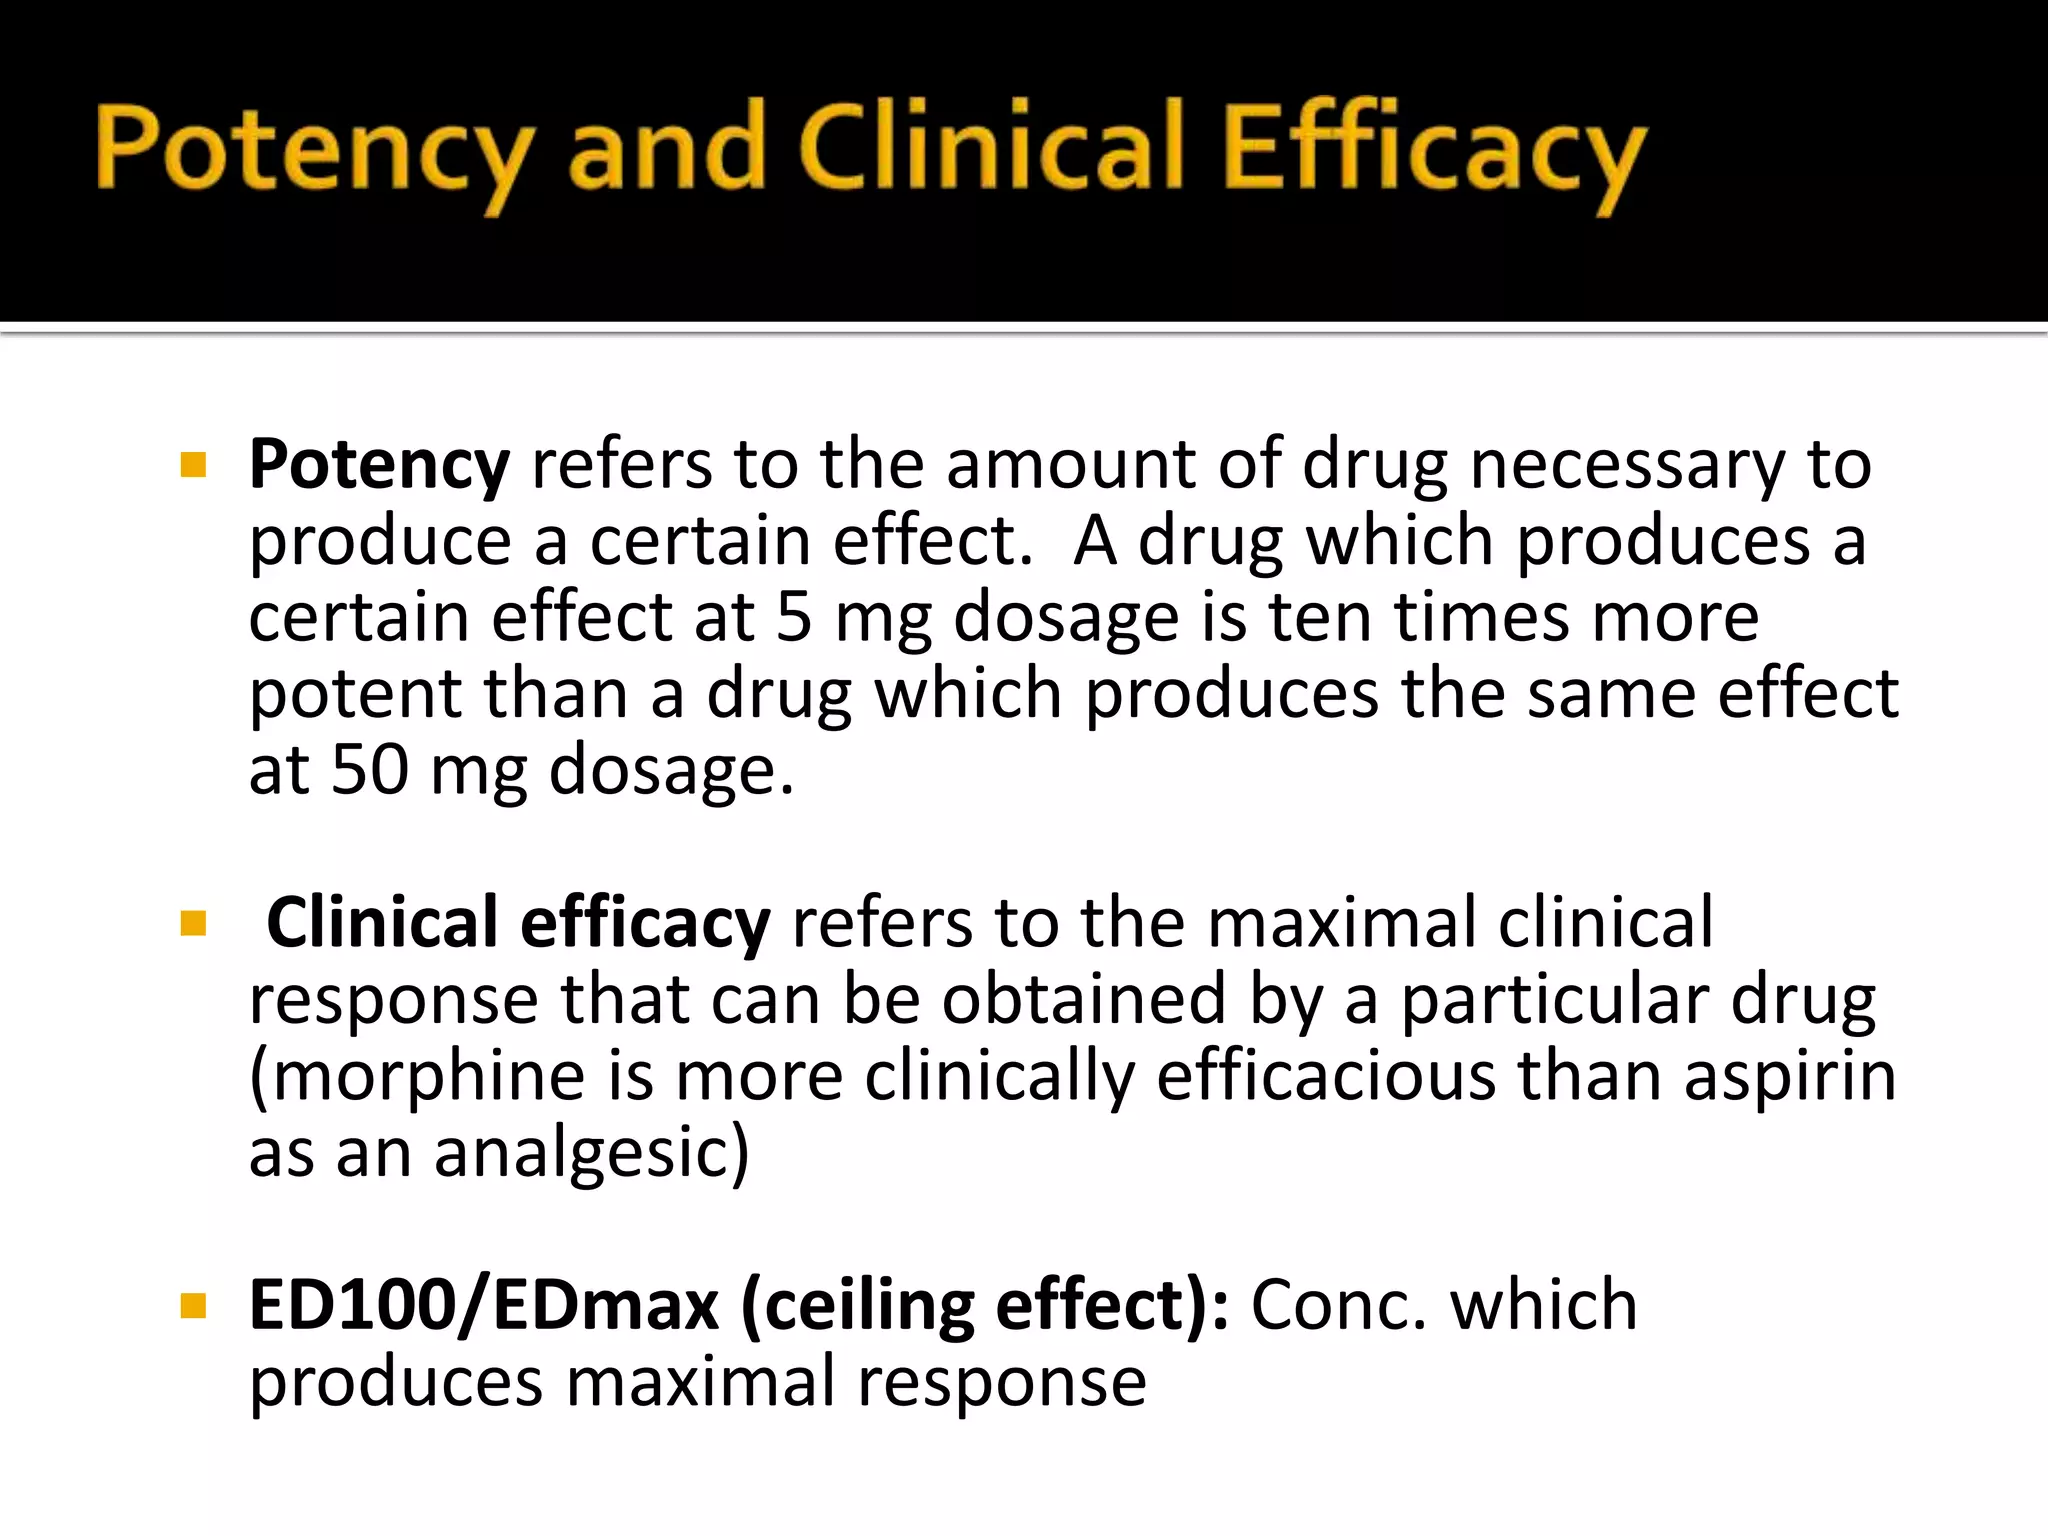
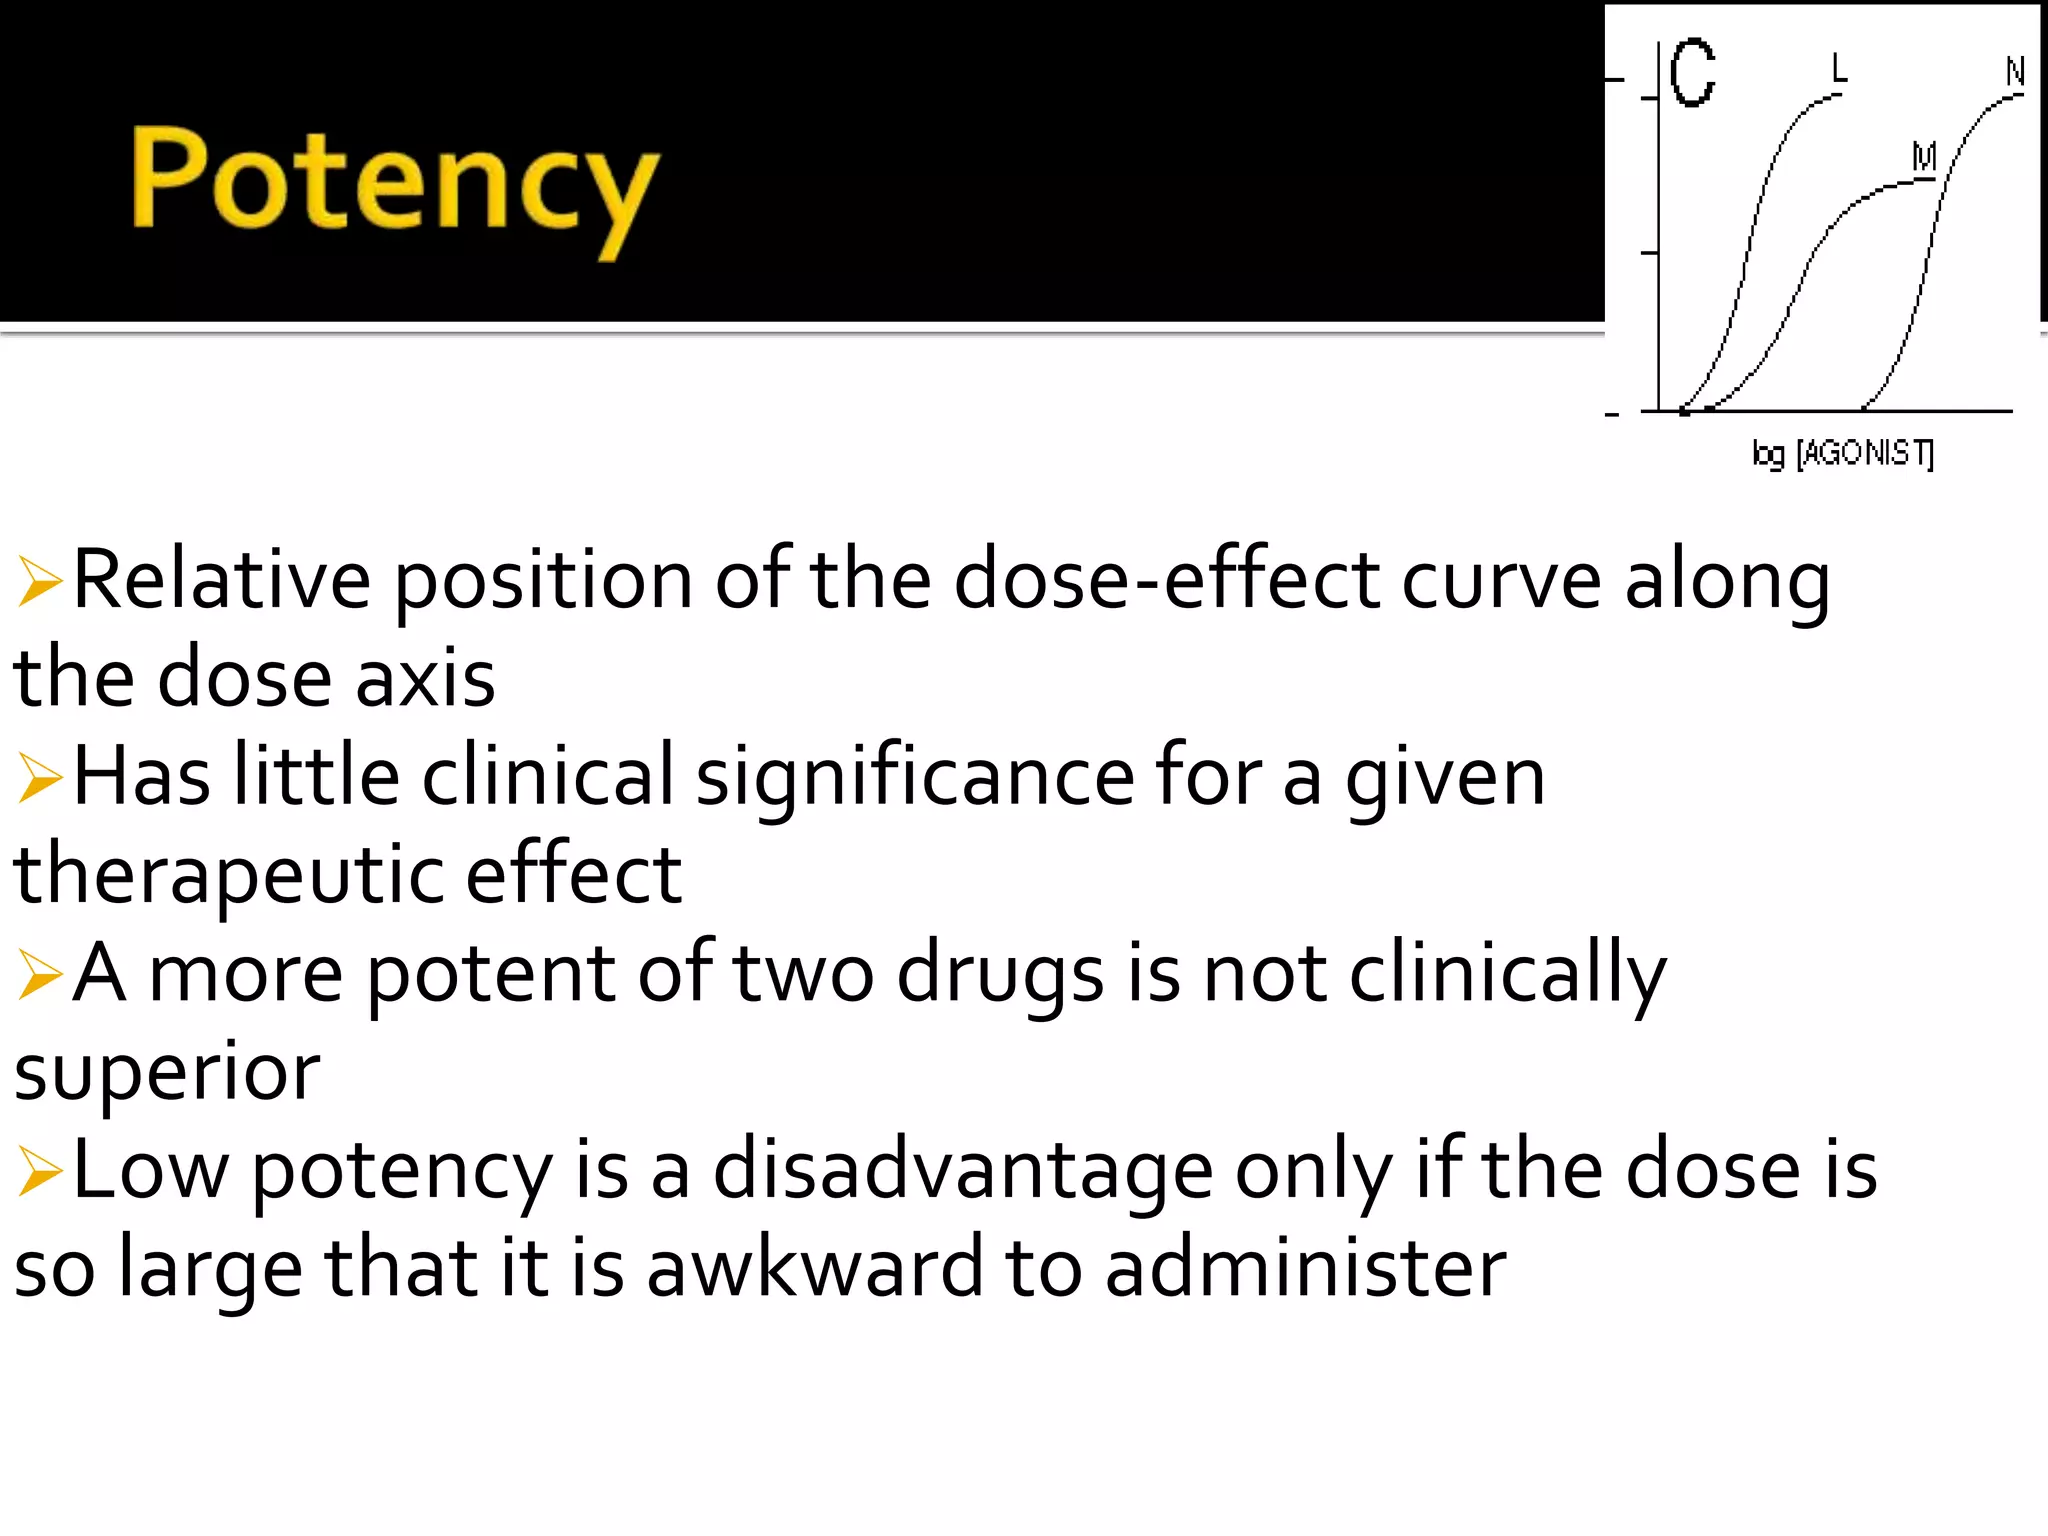
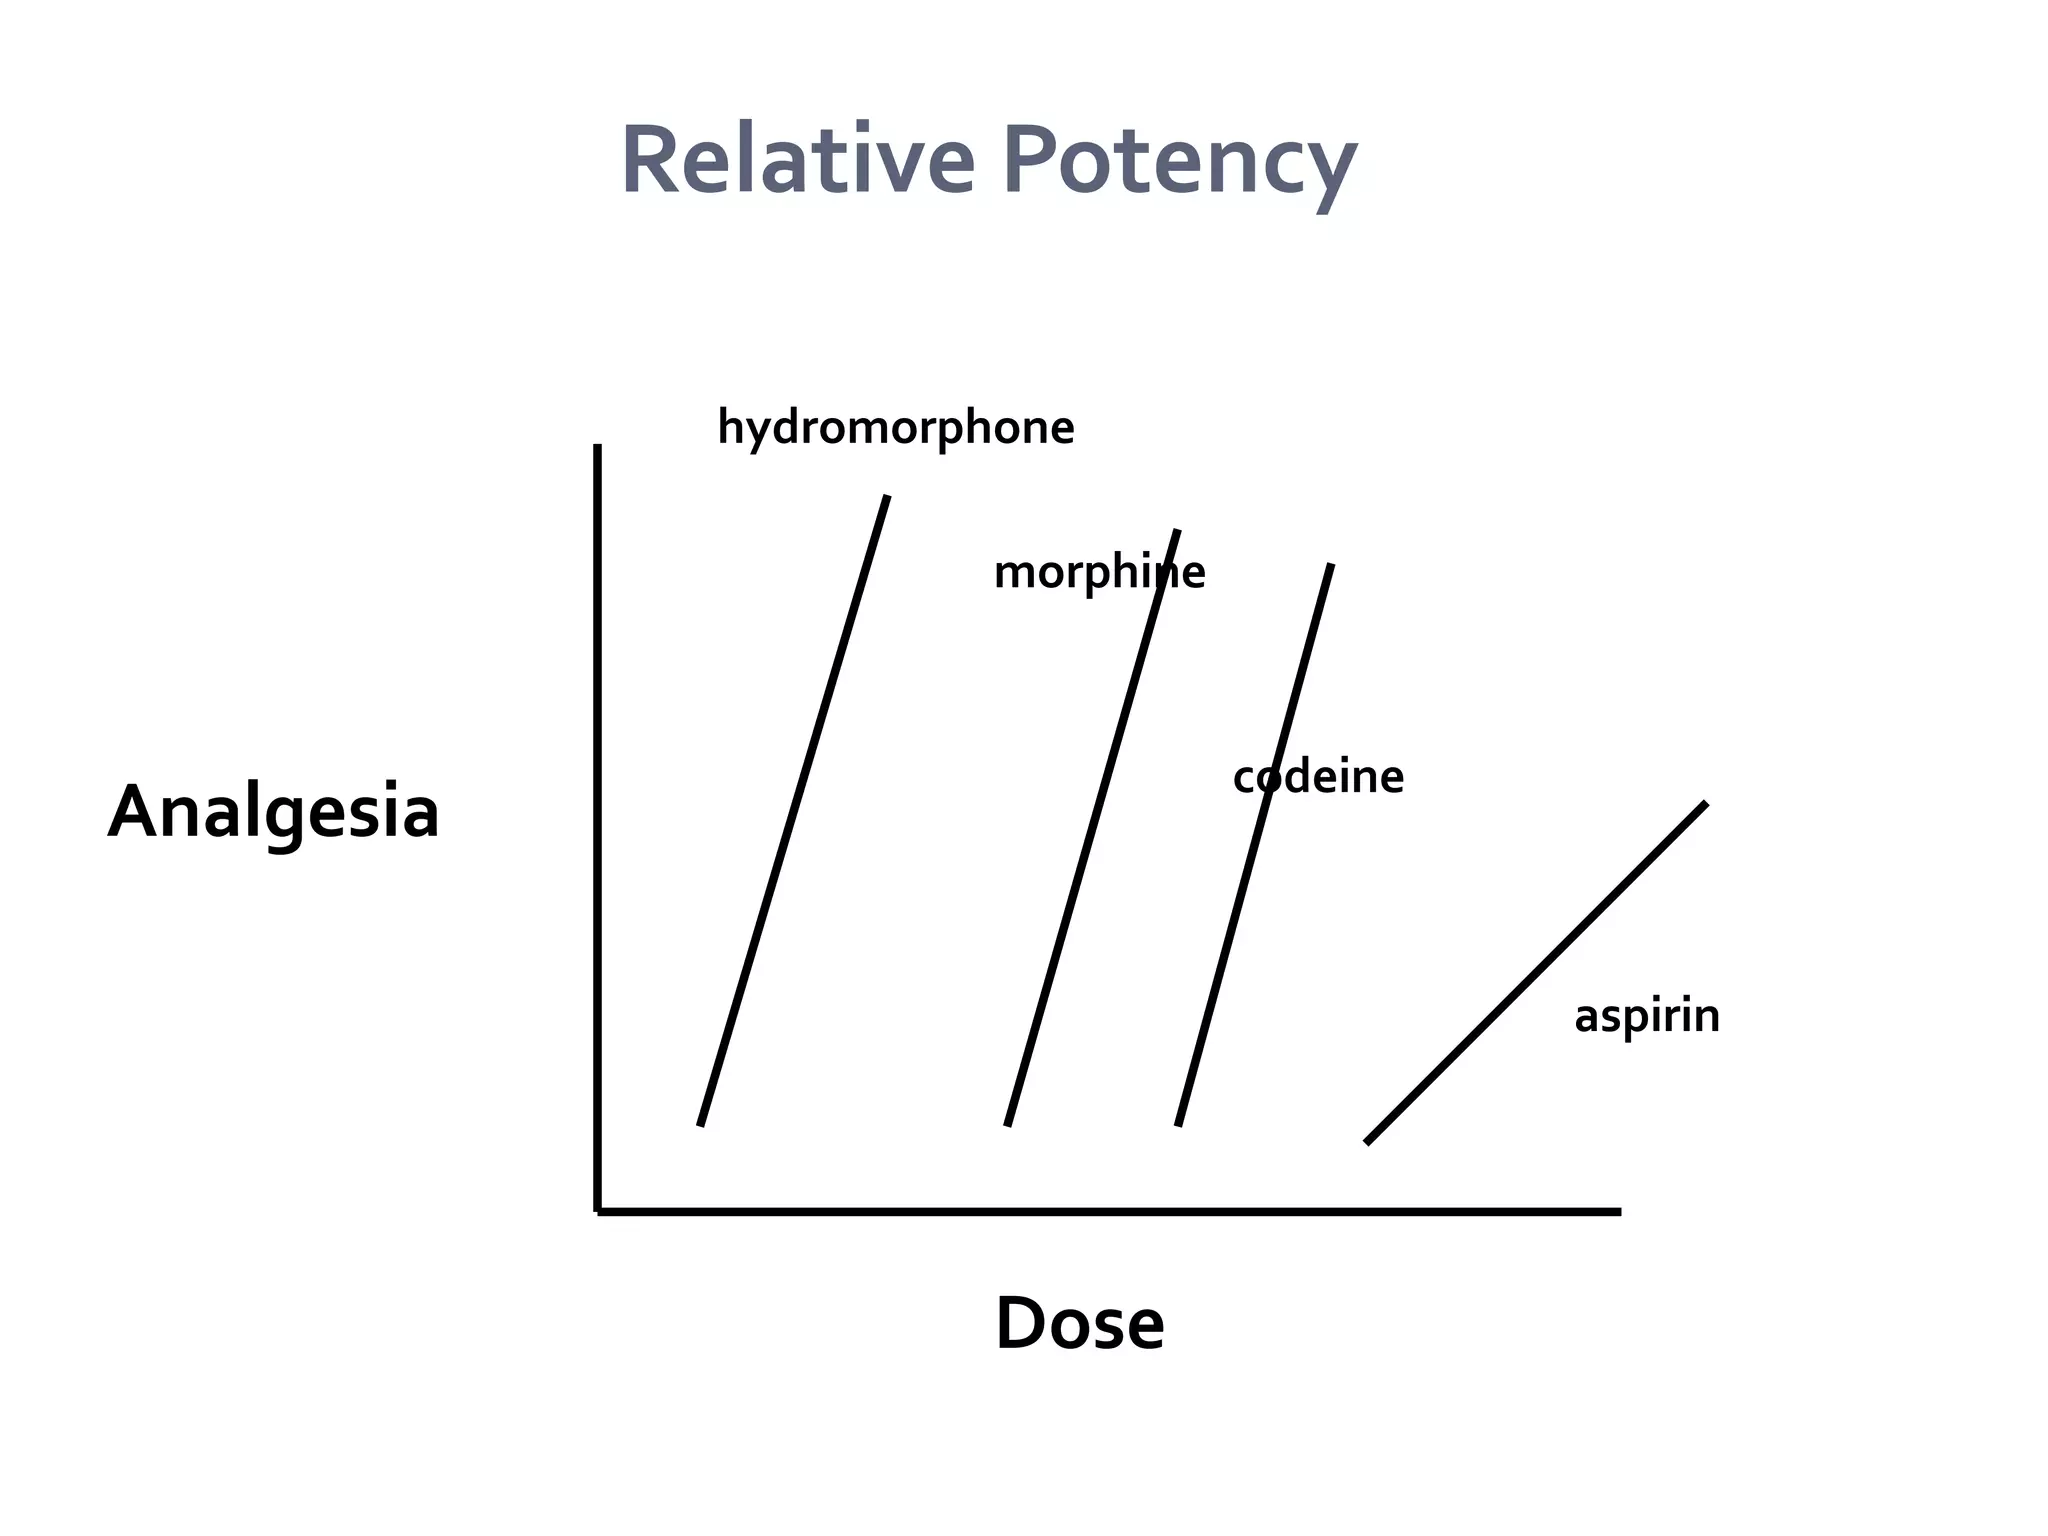
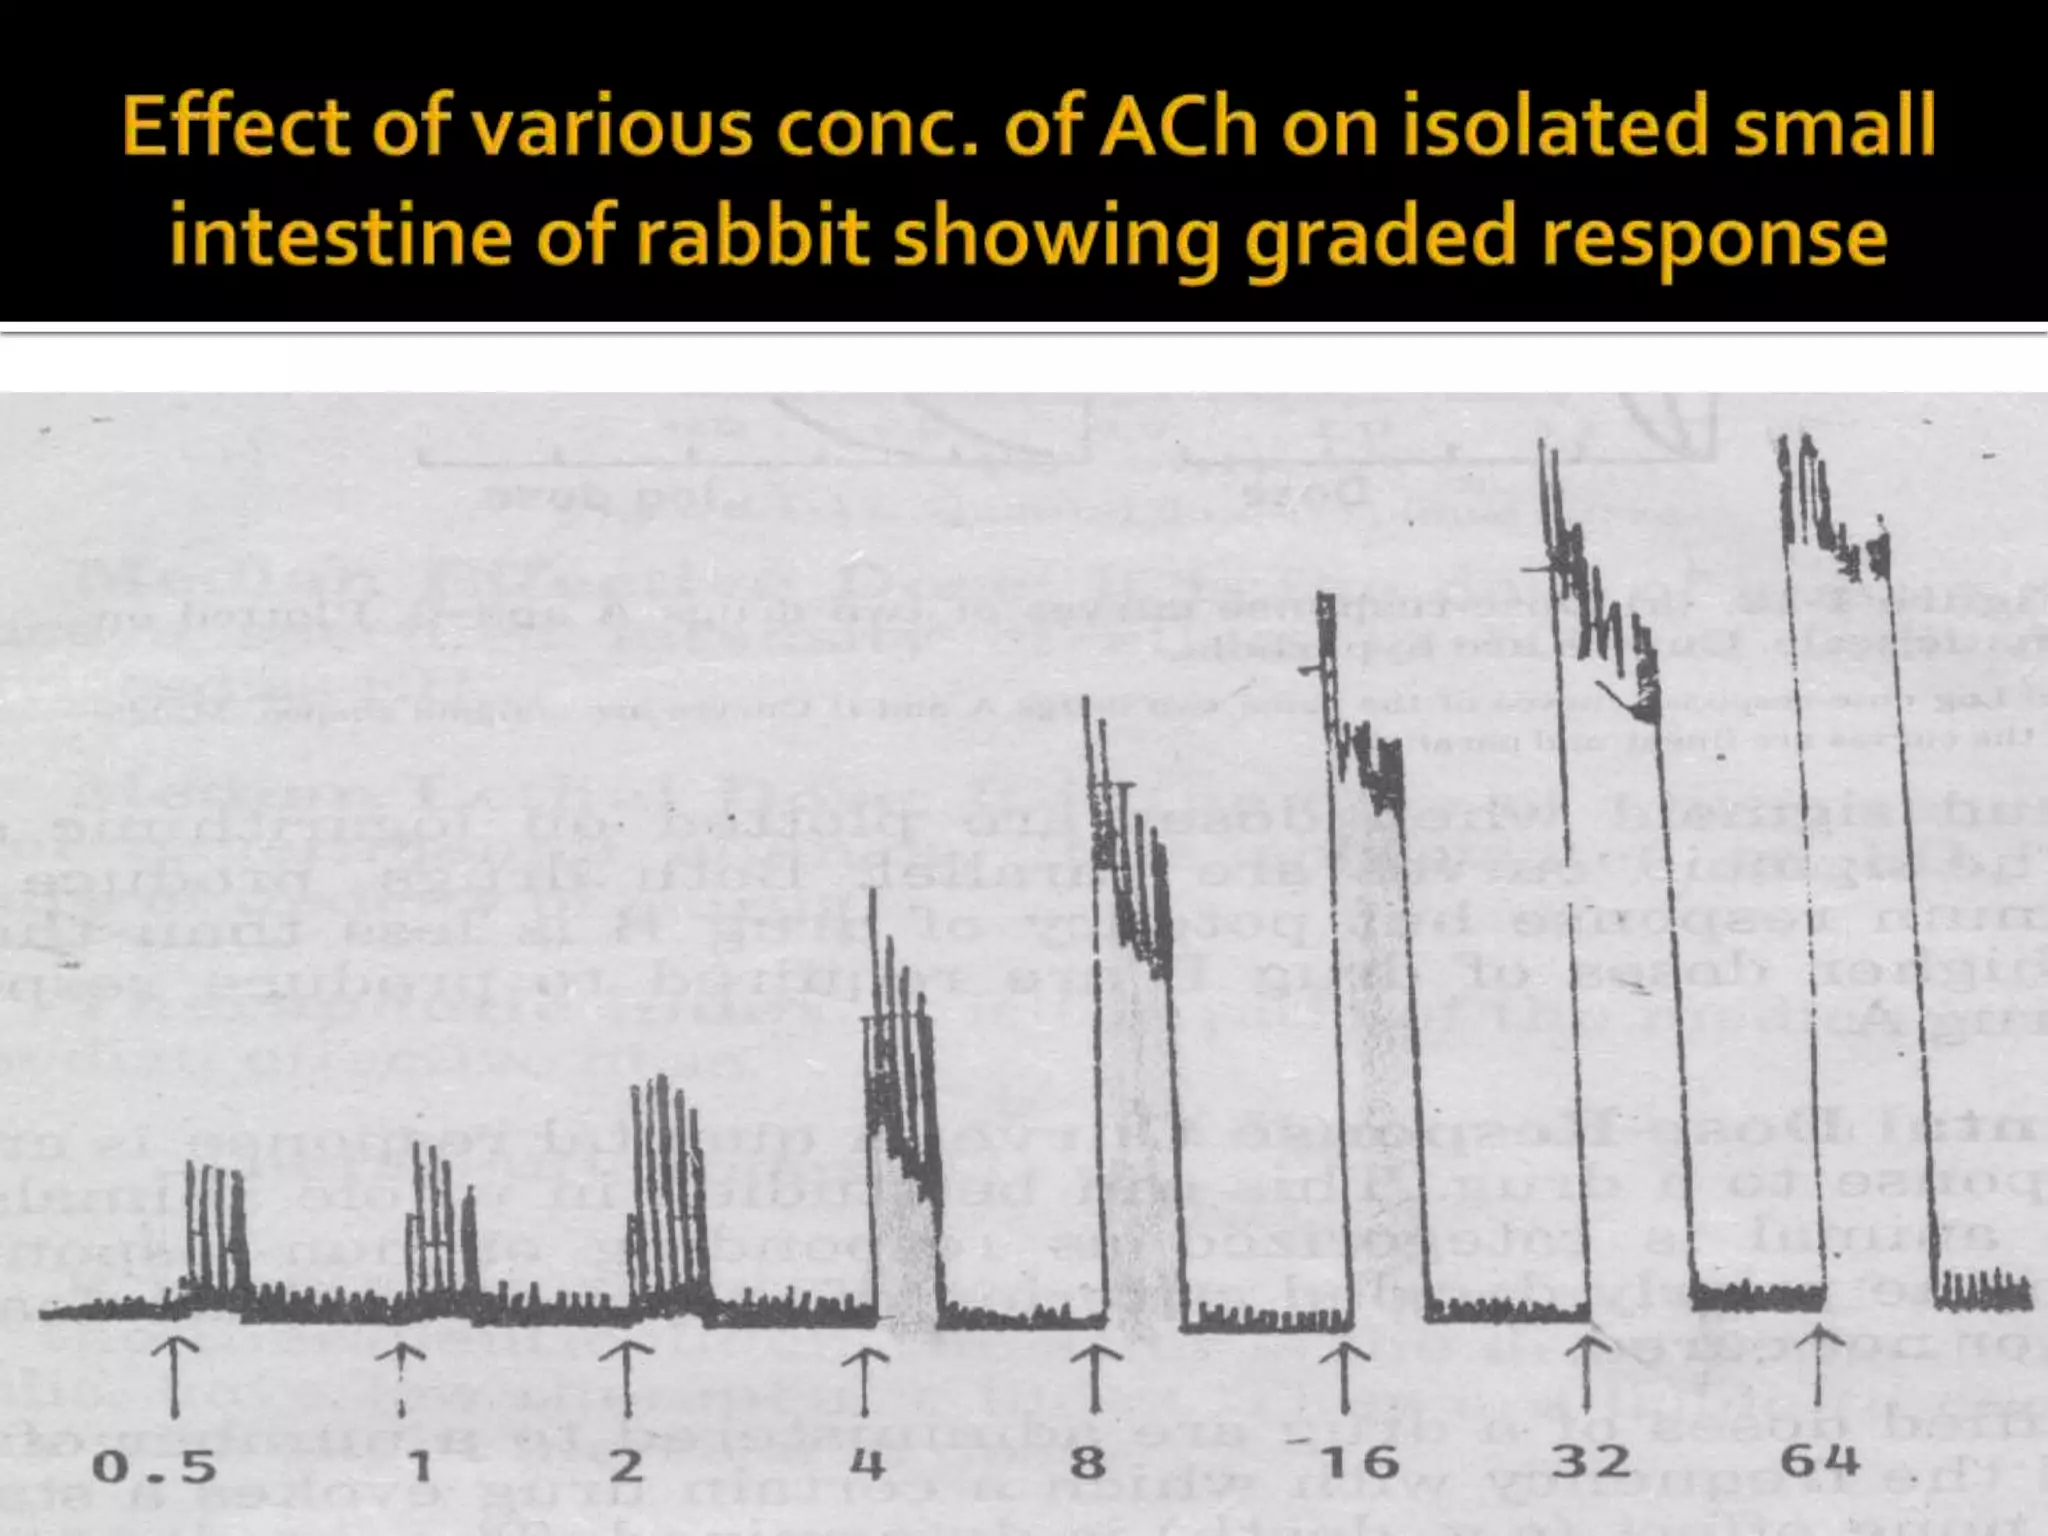


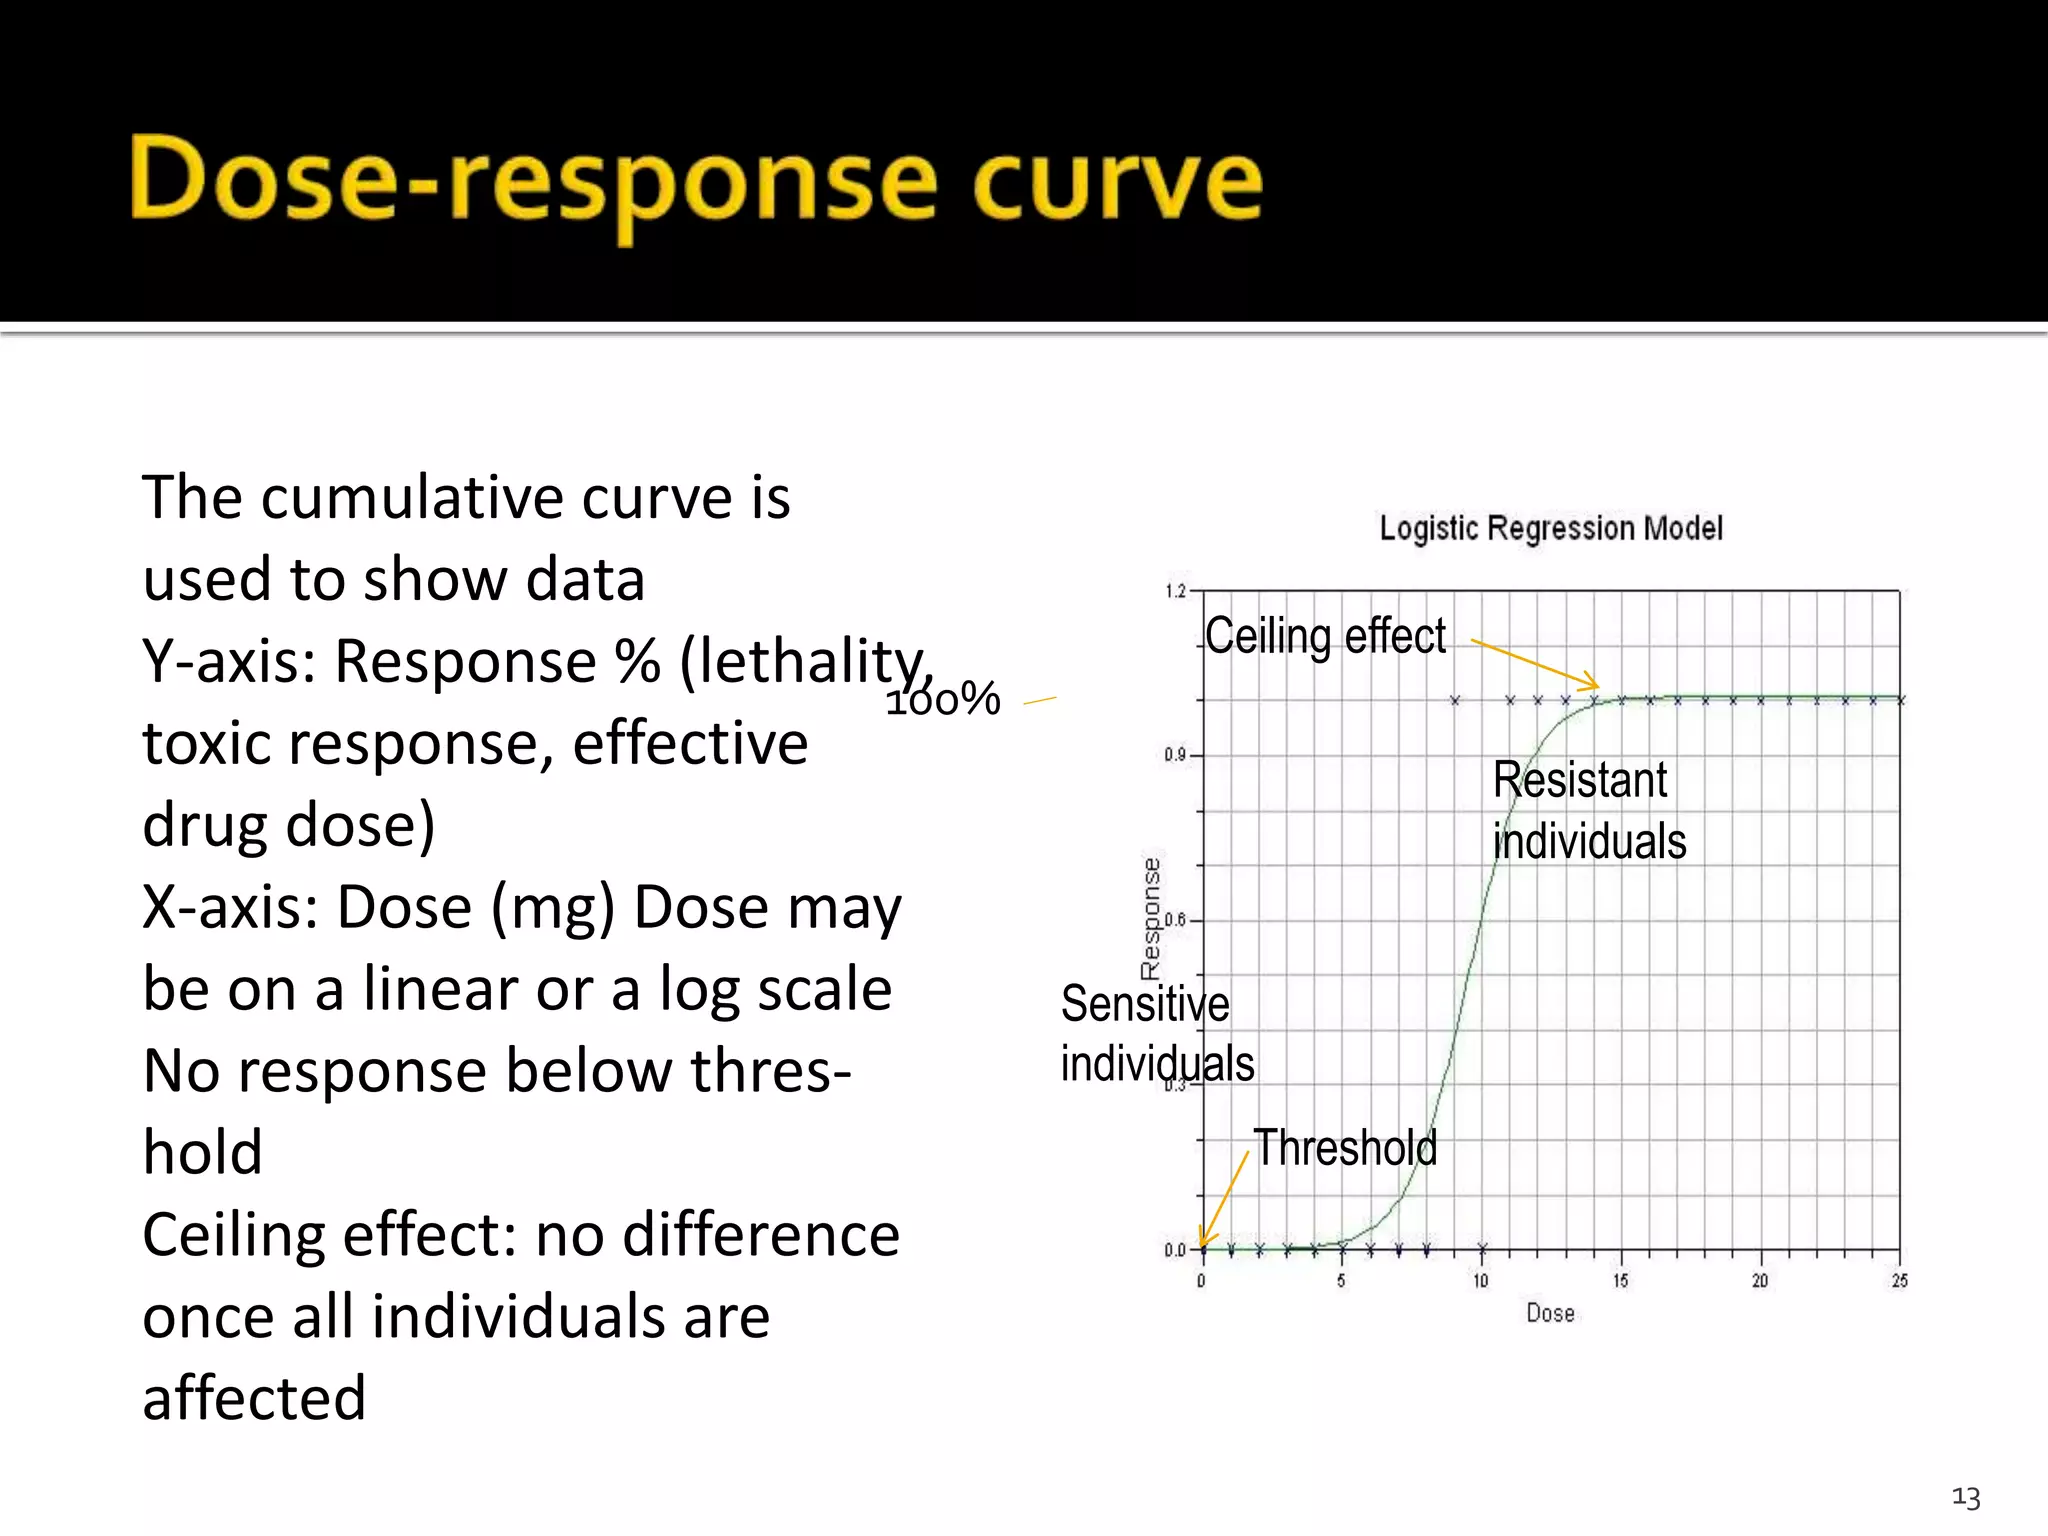
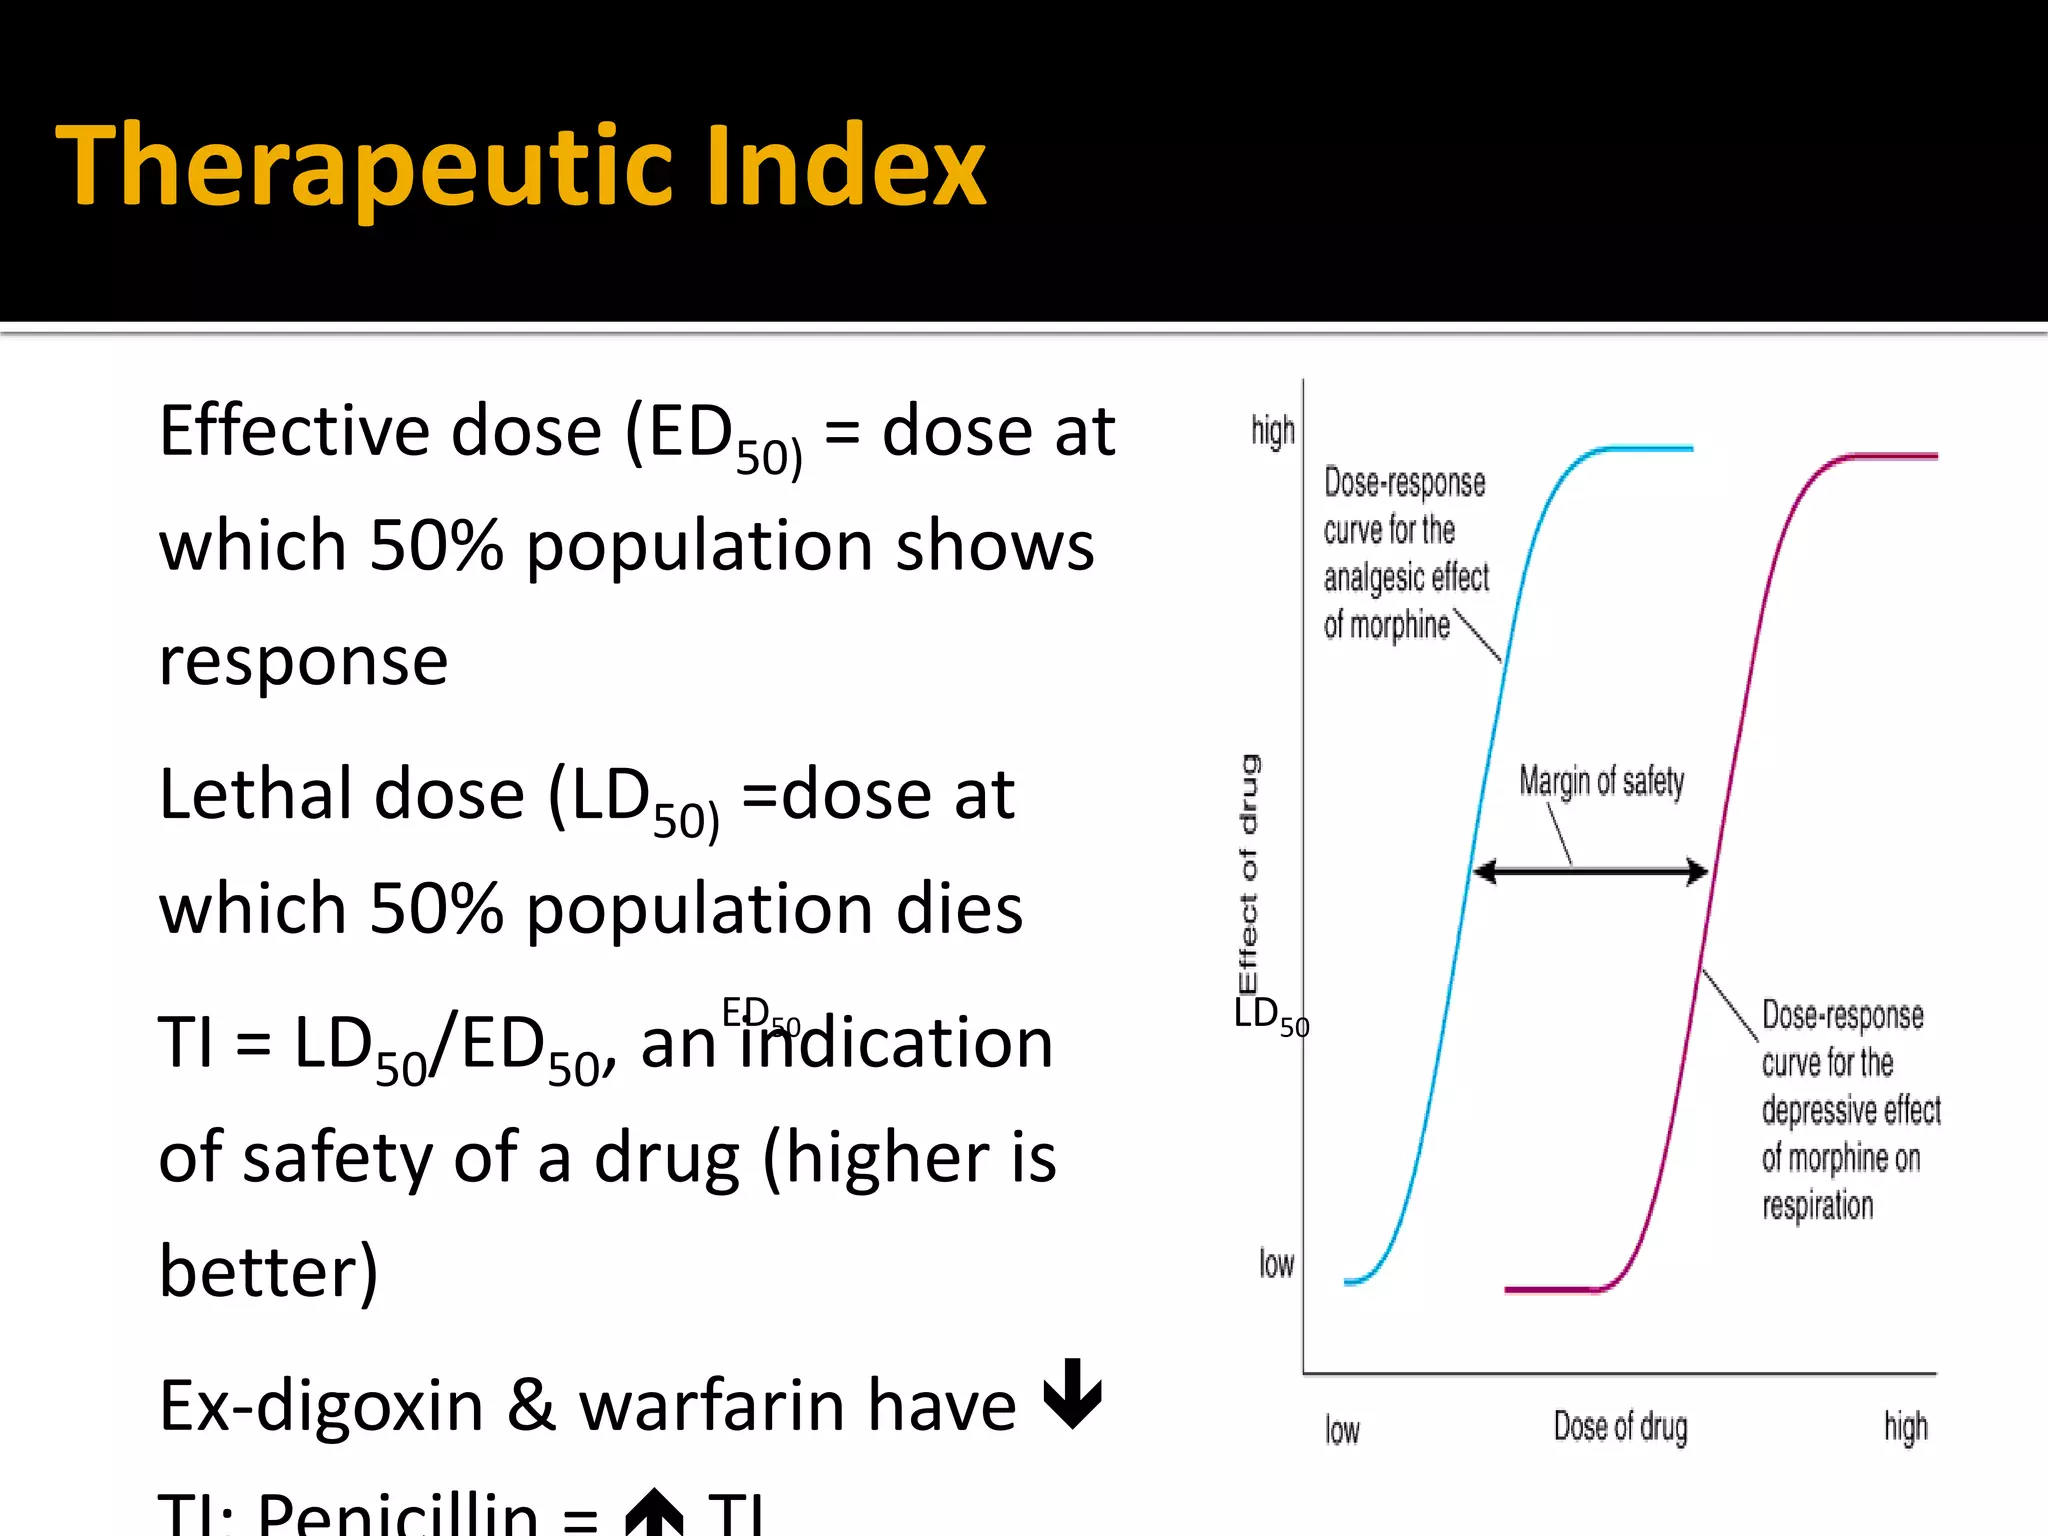


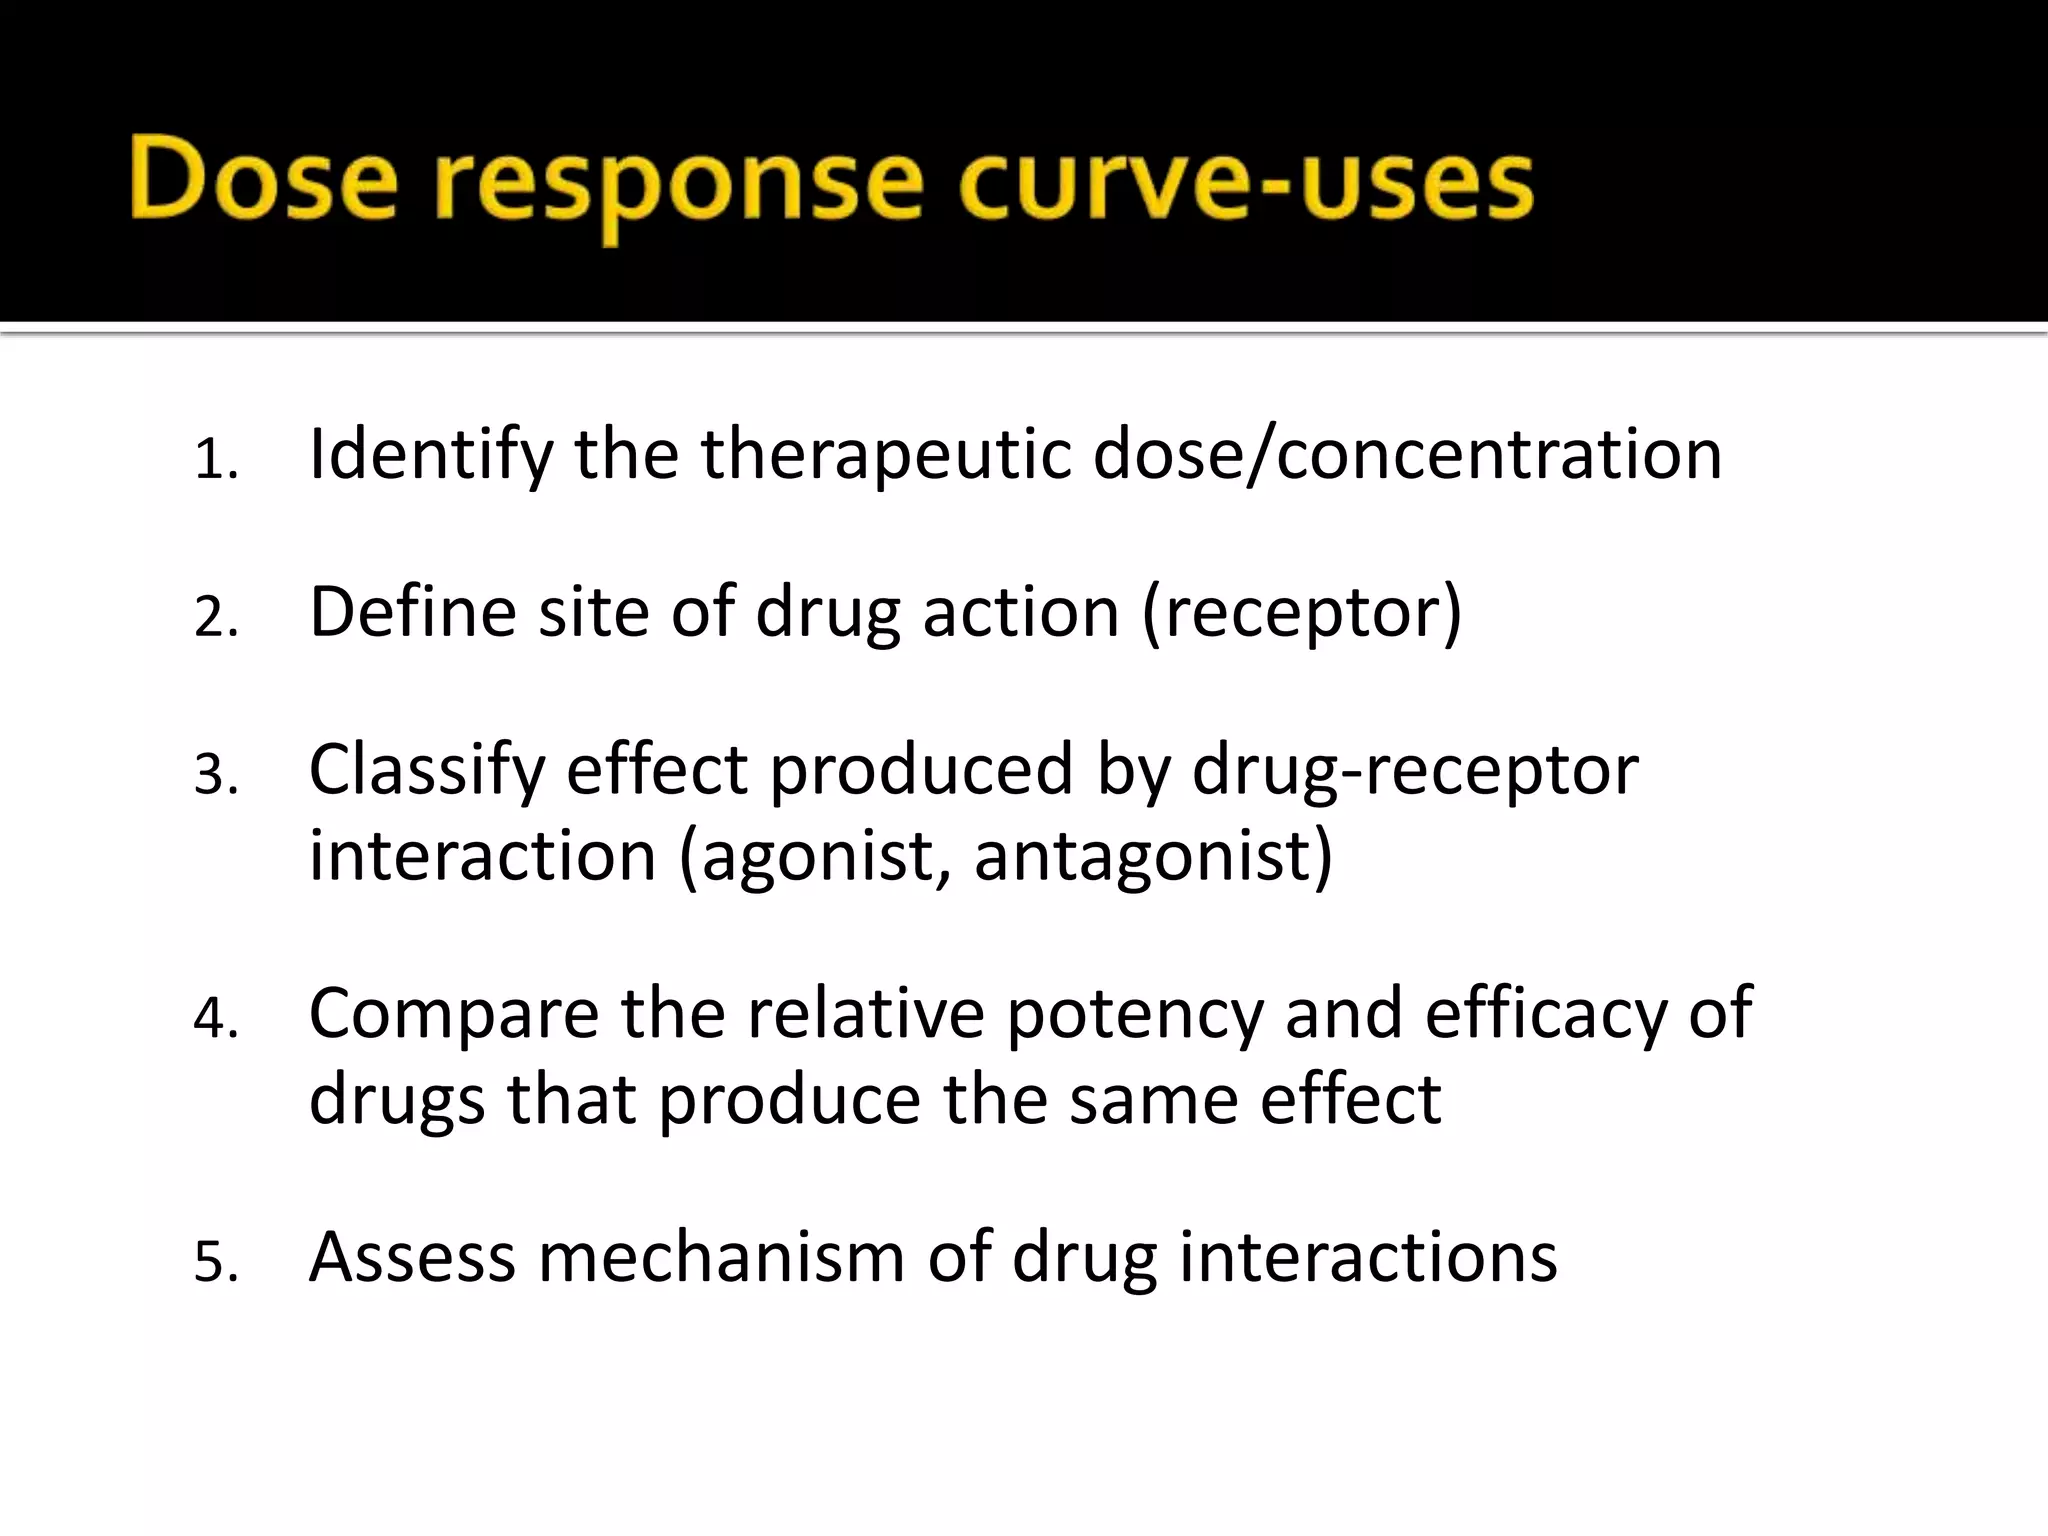

This document discusses various methods for quantitatively estimating drugs, including biological, physico-chemical, radioimmunological, and microbiological methods. It also describes dose-response relationships and different metrics used to characterize drug potency and efficacy such as ED50, LD50, TD50, and therapeutic index. Key concepts covered include quantal vs graded dose-response curves, the significance of potency vs efficacy, and using dose-response data to understand drug interactions and sites of action.


![Clinical Pharmacokinetics-II [dosing of drugs, tdm]](https://cdn.slidesharecdn.com/ss_thumbnails/clinicalpk-iidosingofdrugstdm-140217020047-phpapp02-thumbnail.jpg?width=640&height=640&fit=bounds)


