Downloaded 45 times
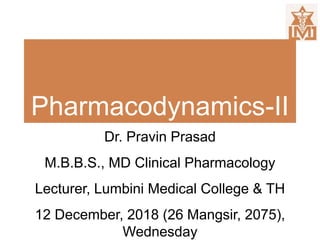


![Drug-Receptor Interactions
Log [drug]
LevelofResponse
Full agonist
Partial agonist
Baseline activity
Inverse agonis
Antagonist](https://image.slidesharecdn.com/pharmacodynamics-ii-181213024857/85/Pharmacodynamics-part-2-13-320.jpg)


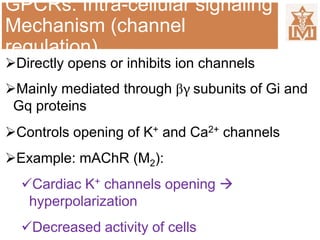
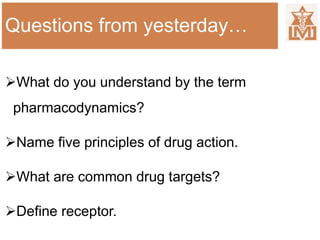
![Dose Response Curve
Log[Dose]
Response
Sigmoid curve
• Wider range can be
plotted
• Intermediate
portion essentially
linear
• Comparison of
responses can
be made](https://image.slidesharecdn.com/pharmacodynamics-ii-181213024857/85/Pharmacodynamics-part-2-19-320.jpg)
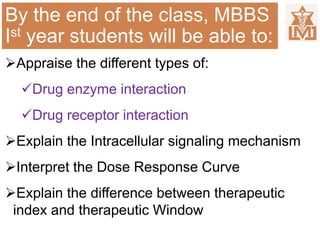
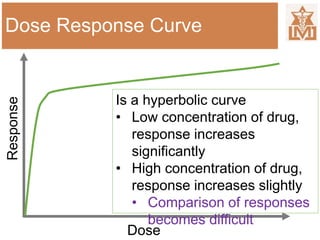
![Dose Response Curve
Log[Dose]
Response
Maximal Response
50% response
Efficacy
Potency
EC50
Slope](https://image.slidesharecdn.com/pharmacodynamics-ii-181213024857/85/Pharmacodynamics-part-2-20-320.jpg)
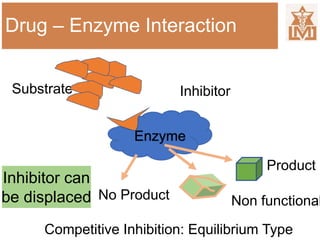
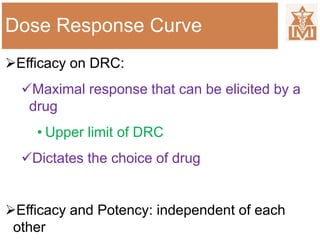
![Dose Response Curve
Potency on DRC:
Depicted by position of DRC on Log[dose]
axis
• More left- more potent
Comparison of potency of two drugs done at
EC50
• Drug Concentration at which 50%
response is obtained](https://image.slidesharecdn.com/pharmacodynamics-ii-181213024857/85/Pharmacodynamics-part-2-21-320.jpg)


![Dose Response Curve
Log[Dose]
Response(numberofanimals)
50% response
ED50
LD50
Effective dose
DRC Lethal dose
DRC
TI= LD50/ED50](https://image.slidesharecdn.com/pharmacodynamics-ii-181213024857/85/Pharmacodynamics-part-2-25-320.jpg)

![Dose Response Curve
Log[Dose]
Response(%)
Maximal
acceptable
adverse
effect
Therapeuti
c Window/
range
Effective dose
DRC Adverse
effect DRC
Minimal
therapeutic
effect](https://image.slidesharecdn.com/pharmacodynamics-ii-181213024857/85/Pharmacodynamics-part-2-27-320.jpg)

![Post-Test
Log[Dose]
Response
Identify the drug
with highest:
• Potency
• Efficacy
A
B
C](https://image.slidesharecdn.com/pharmacodynamics-ii-181213024857/85/Pharmacodynamics-part-2-30-320.jpg)
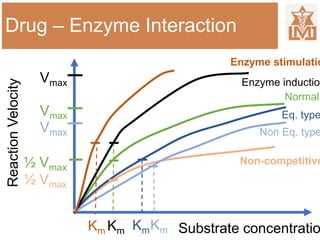
![Conclusion
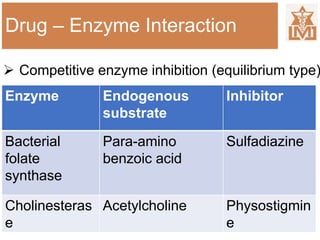
Competitive enzyme inhibition (equilibrium type)
can be reversed by increasing the concentration of
substrate
Agonists have affinity to receptors, but differ in
their intrinsic activity
Depending on the G-protein of GPCRs, signalling
pathway may include cAMP, IP3-DAG or ion
channels themselves
Log[dose] response curve is used for comparing
drugs
Therapeutic window is more clinically applicable](https://image.slidesharecdn.com/pharmacodynamics-ii-181213024857/85/Pharmacodynamics-part-2-31-320.jpg)

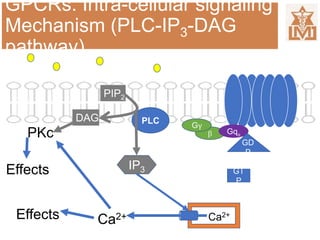
The document outlines a pharmacodynamics lecture by Dr. Pravin Prasad, focusing on drug interactions with enzymes and receptors, the mechanisms of signal transduction, and the analysis of dose-response curves. Key concepts include competitive and non-competitive enzyme inhibition, the roles of agonists and antagonists in receptor interactions, and the definition and importance of therapeutic index and therapeutic window. The session aims to equip first-year MBBS students with an understanding of these pharmacological principles, preparing them for further discussions on factors modifying drug action.


