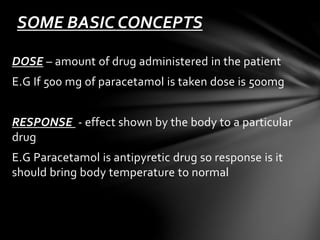
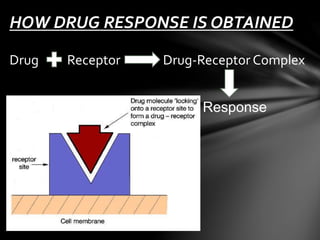
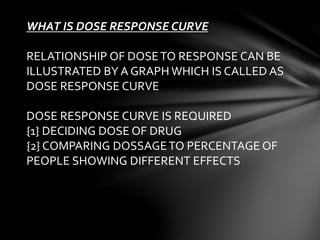
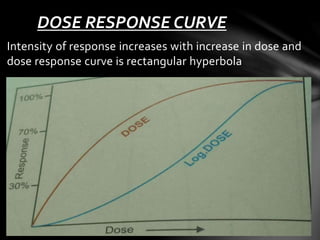
DOSE RESPONSE RELATIONSHIP 
SAURABH WANI 
PGDPM 2013-2014 
GARWARE COLLEGE 
CLINICAL PHARMACOLOGY
SOME BASIC CONCEPTS 
DOSE – amount of drug administered in the patient 
E.G If 500 mg of paracetamol is taken dose is 500mg 
RESPONSE - effect shown by the body to a particular 
drug 
E.G Paracetamol is antipyretic drug so response is it 
should bring body temperature to normal
HOW DRUG RESPONSE IS OBTAINED 
Drug Receptor Drug-Receptor Complex 
Response
WHAT IS DOSE RESPONSE 
RELATIONSHIP 
A RELATIONSHIP USED TO ANALYZE A KIND OF 
RESPONSE OBTAINED AFTER ADMINISTERING 
SPECIFIC DOSE OF DRUG 
E.G If 10mg of ILLAPRAZOLE [ppi] is administered 
response is it should inhibit formation of proton pumps at 
10mg specifically 
Dose response relationship has two components 
[1] DOSE PLASMA CONCENTRATION RELATIONSHIP 
[2] PLASMA CONCENTRATION RESPONSE 
RELATIONSHIP
WHAT IS DOSE RESPONSE CURVE 
RELATIONSHIP OF DOSE TO RESPONSE CAN BE 
ILLUSTRATED BY A GRAPH WHICH IS CALLED AS 
DOSE RESPONSE CURVE 
DOSE RESPONSE CURVE IS REQUIRED 
{1} DECIDING DOSE OF DRUG 
{2} COMPARING DOSSAGE TO PERCENTAGE OF 
PEOPLE SHOWING DIFFERENT EFFECTS
DOSE RESPONSE CURVE 
Intensity of response increases with increase in dose and 
dose response curve is rectangular hyperbola
WHY DOSE RESPONSE CURVE IS 
RECTANGULAR HYPERBOLA 
This is because drug-receptor interaction obeys law 
of mass action, accordingly 
E = Emax [D] 
Kd [D] 
Where 
E = Observed effect of dose of drug 
Emax = maximal response 
Kd = dissociation constant of drug receptor 
complex
ADVANTAGES OF PLOTTING LOG DOSE RESPONSE 
CURVES 
[1] WIDE RANGE OF DRUG DOSES CAN BE DISPLAYED 
ON GRAPH 
[2] COMPARISON BETWEEN AGONIST AND 
ANTAGONIST BECOMES EASIER
THRESHOLD 
A dose below which there are no adverse effects 
from exposure to chemicals
TYPES OF DOSE RESPONSE 
CURVES 
GRADED DOSE RESPONSE CURVES 
QUANTAL DOSE RESPONSE CURVES
GRADED DOSE RESPONSE CURVES 
Graded dose response curves are constructed for 
response that are measured on continuous scale 
E.G heart rate 
GRADED dose response curves relates the intensity of 
response to size of dose hence used in characterizing 
actions of drug 
Graded dose response means slight increase of drug 
brings small increase in response 
E.G increased dose of Histamine causes gradual 
contraction of guinea pig ileum
• Very low dose of histamine has no effect and 
response is obtained only beyond the threshold 
dose of 20 mg 
• Very high dose of more than 50 mg has no 
additional effect and response remains constant at 
this maximal levels 
• Graded dose response means the pharmacological 
effect of drug expressed in quality or number such 
as heart rate by beat and blood pressure by mmHg
DOSE ERSPONSE CURVE STUDYING 
THE EFFECT OF ASPIRIN 
LINEAR PLOT SEMILOG PLOT
QUANTAL DOSE RESPONSE 
CURVES 
Quantal dose response curves are constructed for those 
drugs that elicit all or none response 
E.G presence or absence of epileptic seizures 
Indicates that given dose of drug has or has not evoked a 
certain effect in various subject under investigation that 
is pharmacological effects are expressed in passive or 
negative
Quantal dose response curves 
An experiment performed 
on 100 subjects 
And the effective dose to 
produce a quantal response 
was determined for each 
individual
DOSE RESPONSE CURVE 
INFORMATION
Drug potency and efficacy 
Drug potency refers to amount of drug needed to produce 
a response.Relative potency is more meaningful than 
absolute potency 
E.G If 10 mg of morphine=100 mg of pethidine, morphine is 
10 times more potent than pethidine 
Drug efficacy refers to ability of drug to elicit a response 
when it binds to a receptor 
E.G Morphine produces a degree of analgesia not 
obtainable with any dose of aspirin hence Morphine is 
more efficacious than aspirin
Drug potency and efficacy curves 
[1] Drug B is less potent but equally 
efficacious as drug A 
[2] Drug C is less potent and less 
efficacious than drug A ,But equally 
potent and less efficacious than 
drug B 
[3] Drug D is more potent than drug 
A,B,& C but less efficacious than 
drugs A&B and equally efficacious 
as drug C
SLOPE AND VARIABLITY 
Effect of incremental increase 
in dose 
Variability is reproductivity of 
data different for different people
Therapeutic index 
Therapeutic index is used for judging drug safety . 
Therapeutic index is ratio of Ld50 to Ed50 
Ed50 – Median effective dose at which 50% of individuals 
exhibit a specific effect 
Ld50 – Median lethal dose required to produce death in 
50% individuals
Factors affecting drug response 
[1] AGE 
[2] WEIGHT 
[3] GENDER 
[4] ENVIRONMENT 
[5] FEVER 
[6] SHOCK
THANKYOU

Dose response relationship

  • 1.
    DOSE RESPONSE RELATIONSHIP SAURABH WANI PGDPM 2013-2014 GARWARE COLLEGE CLINICAL PHARMACOLOGY
  • 2.
    SOME BASIC CONCEPTS DOSE – amount of drug administered in the patient E.G If 500 mg of paracetamol is taken dose is 500mg RESPONSE - effect shown by the body to a particular drug E.G Paracetamol is antipyretic drug so response is it should bring body temperature to normal
  • 3.
    HOW DRUG RESPONSEIS OBTAINED Drug Receptor Drug-Receptor Complex Response
  • 4.
    WHAT IS DOSERESPONSE RELATIONSHIP A RELATIONSHIP USED TO ANALYZE A KIND OF RESPONSE OBTAINED AFTER ADMINISTERING SPECIFIC DOSE OF DRUG E.G If 10mg of ILLAPRAZOLE [ppi] is administered response is it should inhibit formation of proton pumps at 10mg specifically Dose response relationship has two components [1] DOSE PLASMA CONCENTRATION RELATIONSHIP [2] PLASMA CONCENTRATION RESPONSE RELATIONSHIP
  • 5.
    WHAT IS DOSERESPONSE CURVE RELATIONSHIP OF DOSE TO RESPONSE CAN BE ILLUSTRATED BY A GRAPH WHICH IS CALLED AS DOSE RESPONSE CURVE DOSE RESPONSE CURVE IS REQUIRED {1} DECIDING DOSE OF DRUG {2} COMPARING DOSSAGE TO PERCENTAGE OF PEOPLE SHOWING DIFFERENT EFFECTS
  • 6.
    DOSE RESPONSE CURVE Intensity of response increases with increase in dose and dose response curve is rectangular hyperbola
  • 7.
    WHY DOSE RESPONSECURVE IS RECTANGULAR HYPERBOLA This is because drug-receptor interaction obeys law of mass action, accordingly E = Emax [D] Kd [D] Where E = Observed effect of dose of drug Emax = maximal response Kd = dissociation constant of drug receptor complex
  • 8.
    ADVANTAGES OF PLOTTINGLOG DOSE RESPONSE CURVES [1] WIDE RANGE OF DRUG DOSES CAN BE DISPLAYED ON GRAPH [2] COMPARISON BETWEEN AGONIST AND ANTAGONIST BECOMES EASIER
  • 9.
    THRESHOLD A dosebelow which there are no adverse effects from exposure to chemicals
  • 10.
    TYPES OF DOSERESPONSE CURVES GRADED DOSE RESPONSE CURVES QUANTAL DOSE RESPONSE CURVES
  • 11.
    GRADED DOSE RESPONSECURVES Graded dose response curves are constructed for response that are measured on continuous scale E.G heart rate GRADED dose response curves relates the intensity of response to size of dose hence used in characterizing actions of drug Graded dose response means slight increase of drug brings small increase in response E.G increased dose of Histamine causes gradual contraction of guinea pig ileum
  • 12.
    • Very lowdose of histamine has no effect and response is obtained only beyond the threshold dose of 20 mg • Very high dose of more than 50 mg has no additional effect and response remains constant at this maximal levels • Graded dose response means the pharmacological effect of drug expressed in quality or number such as heart rate by beat and blood pressure by mmHg
  • 13.
    DOSE ERSPONSE CURVESTUDYING THE EFFECT OF ASPIRIN LINEAR PLOT SEMILOG PLOT
  • 14.
    QUANTAL DOSE RESPONSE CURVES Quantal dose response curves are constructed for those drugs that elicit all or none response E.G presence or absence of epileptic seizures Indicates that given dose of drug has or has not evoked a certain effect in various subject under investigation that is pharmacological effects are expressed in passive or negative
  • 15.
    Quantal dose responsecurves An experiment performed on 100 subjects And the effective dose to produce a quantal response was determined for each individual
  • 16.
    DOSE RESPONSE CURVE INFORMATION
  • 17.
    Drug potency andefficacy Drug potency refers to amount of drug needed to produce a response.Relative potency is more meaningful than absolute potency E.G If 10 mg of morphine=100 mg of pethidine, morphine is 10 times more potent than pethidine Drug efficacy refers to ability of drug to elicit a response when it binds to a receptor E.G Morphine produces a degree of analgesia not obtainable with any dose of aspirin hence Morphine is more efficacious than aspirin
  • 18.
    Drug potency andefficacy curves [1] Drug B is less potent but equally efficacious as drug A [2] Drug C is less potent and less efficacious than drug A ,But equally potent and less efficacious than drug B [3] Drug D is more potent than drug A,B,& C but less efficacious than drugs A&B and equally efficacious as drug C
  • 19.
    SLOPE AND VARIABLITY Effect of incremental increase in dose Variability is reproductivity of data different for different people
  • 20.
    Therapeutic index Therapeuticindex is used for judging drug safety . Therapeutic index is ratio of Ld50 to Ed50 Ed50 – Median effective dose at which 50% of individuals exhibit a specific effect Ld50 – Median lethal dose required to produce death in 50% individuals
  • 21.
    Factors affecting drugresponse [1] AGE [2] WEIGHT [3] GENDER [4] ENVIRONMENT [5] FEVER [6] SHOCK
  • 22.