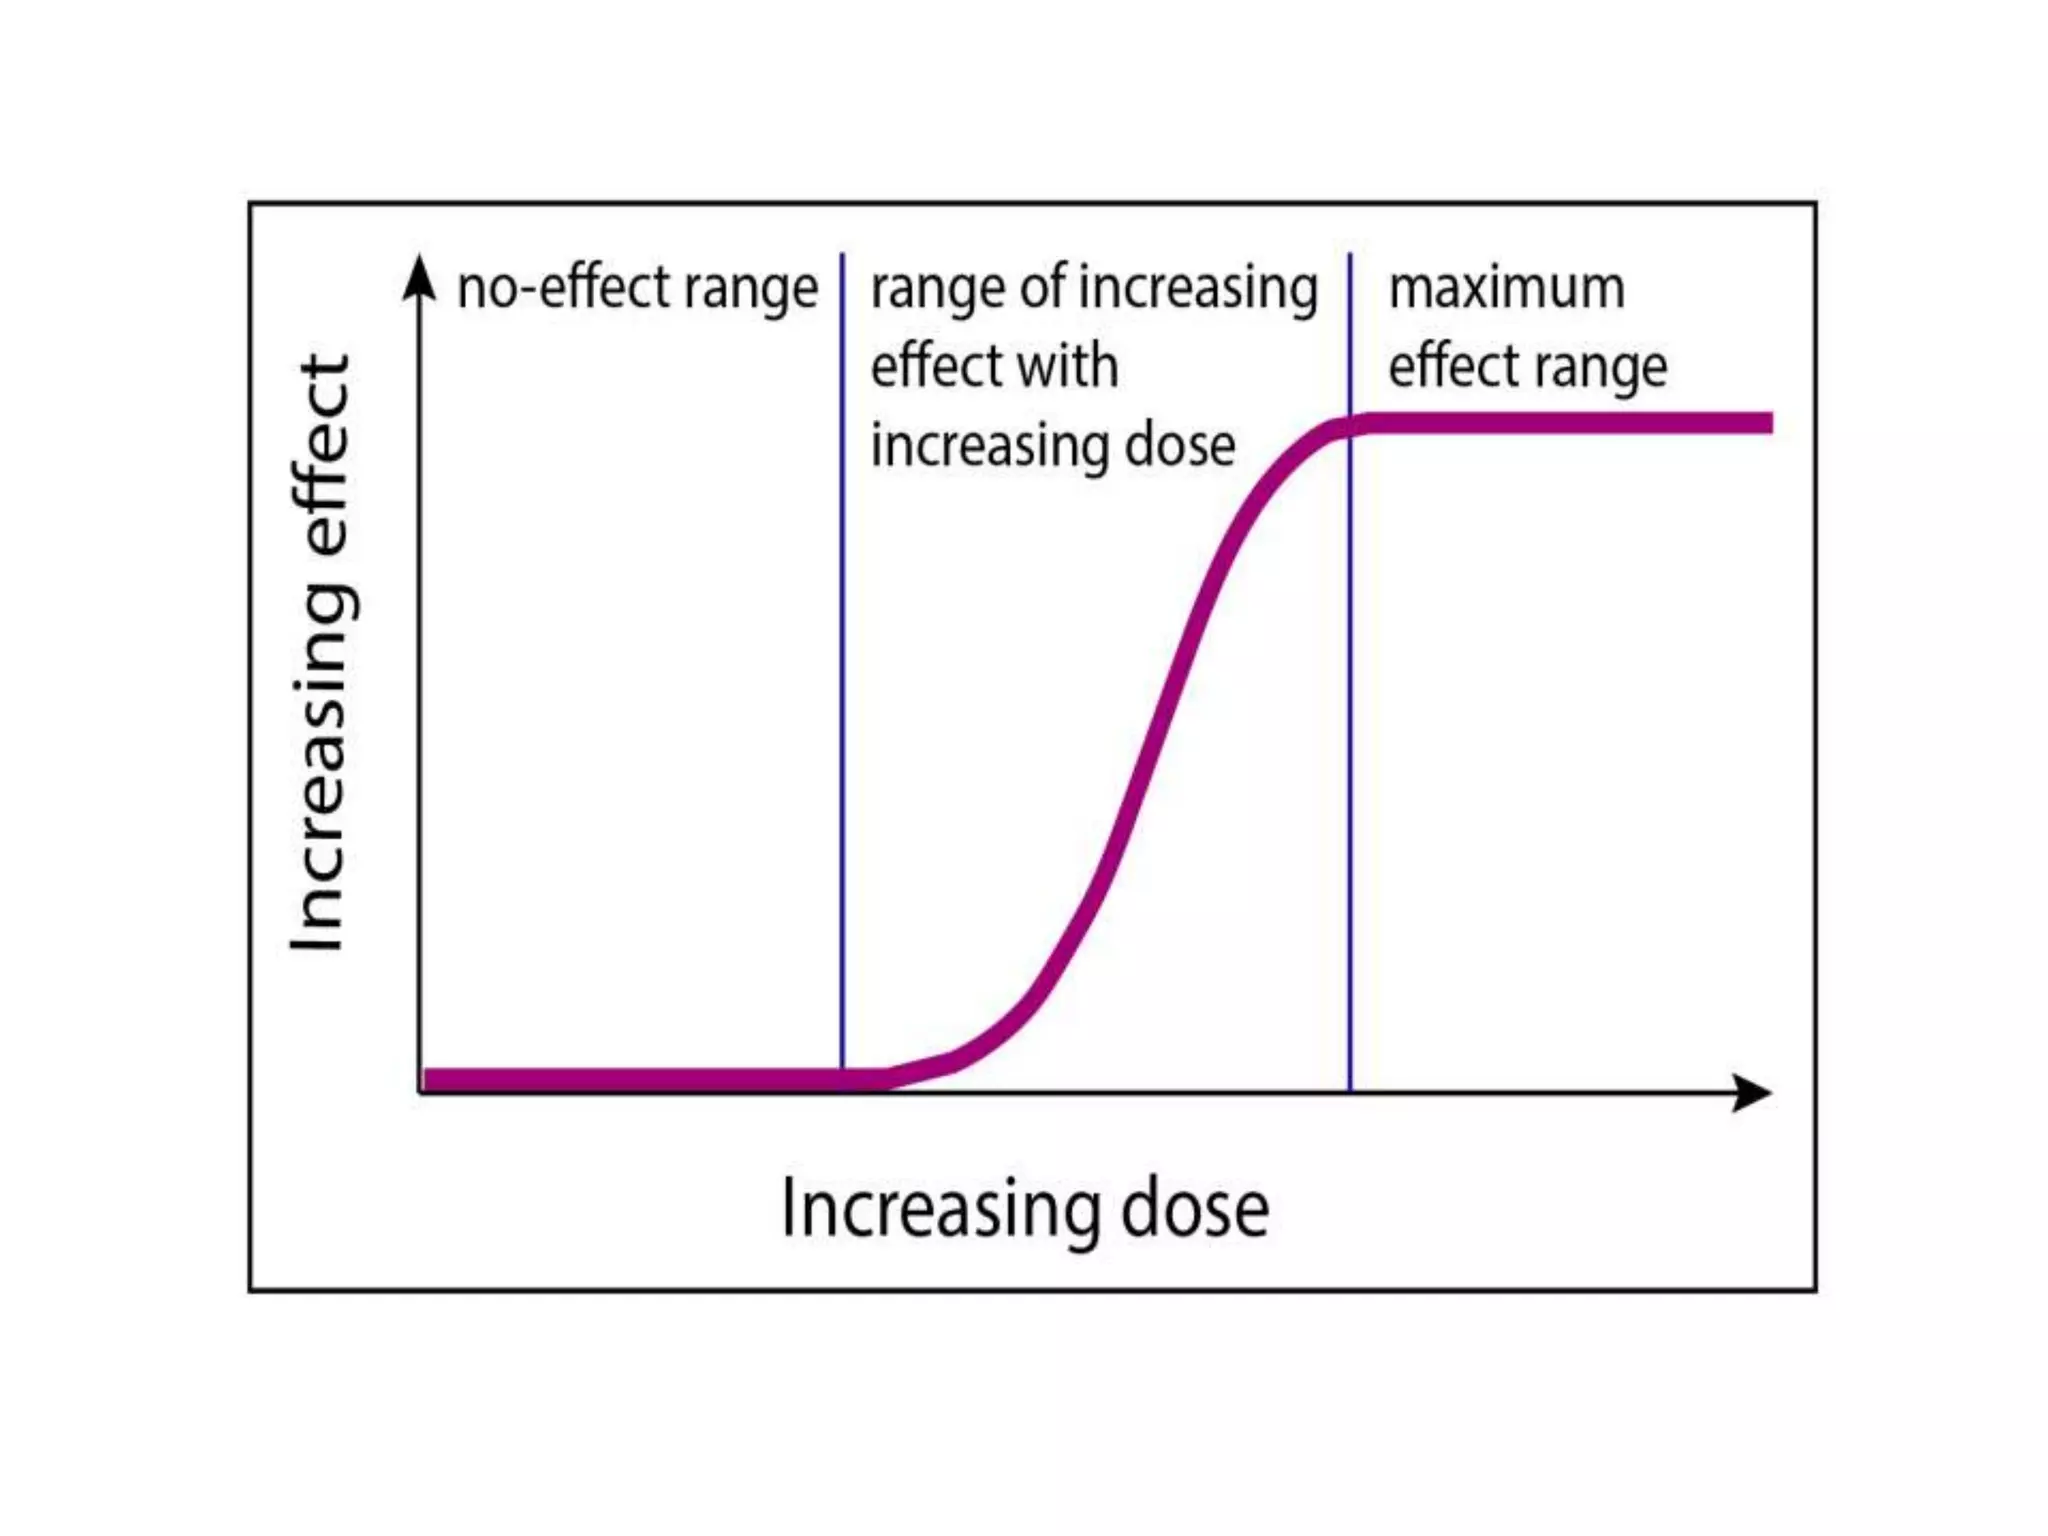
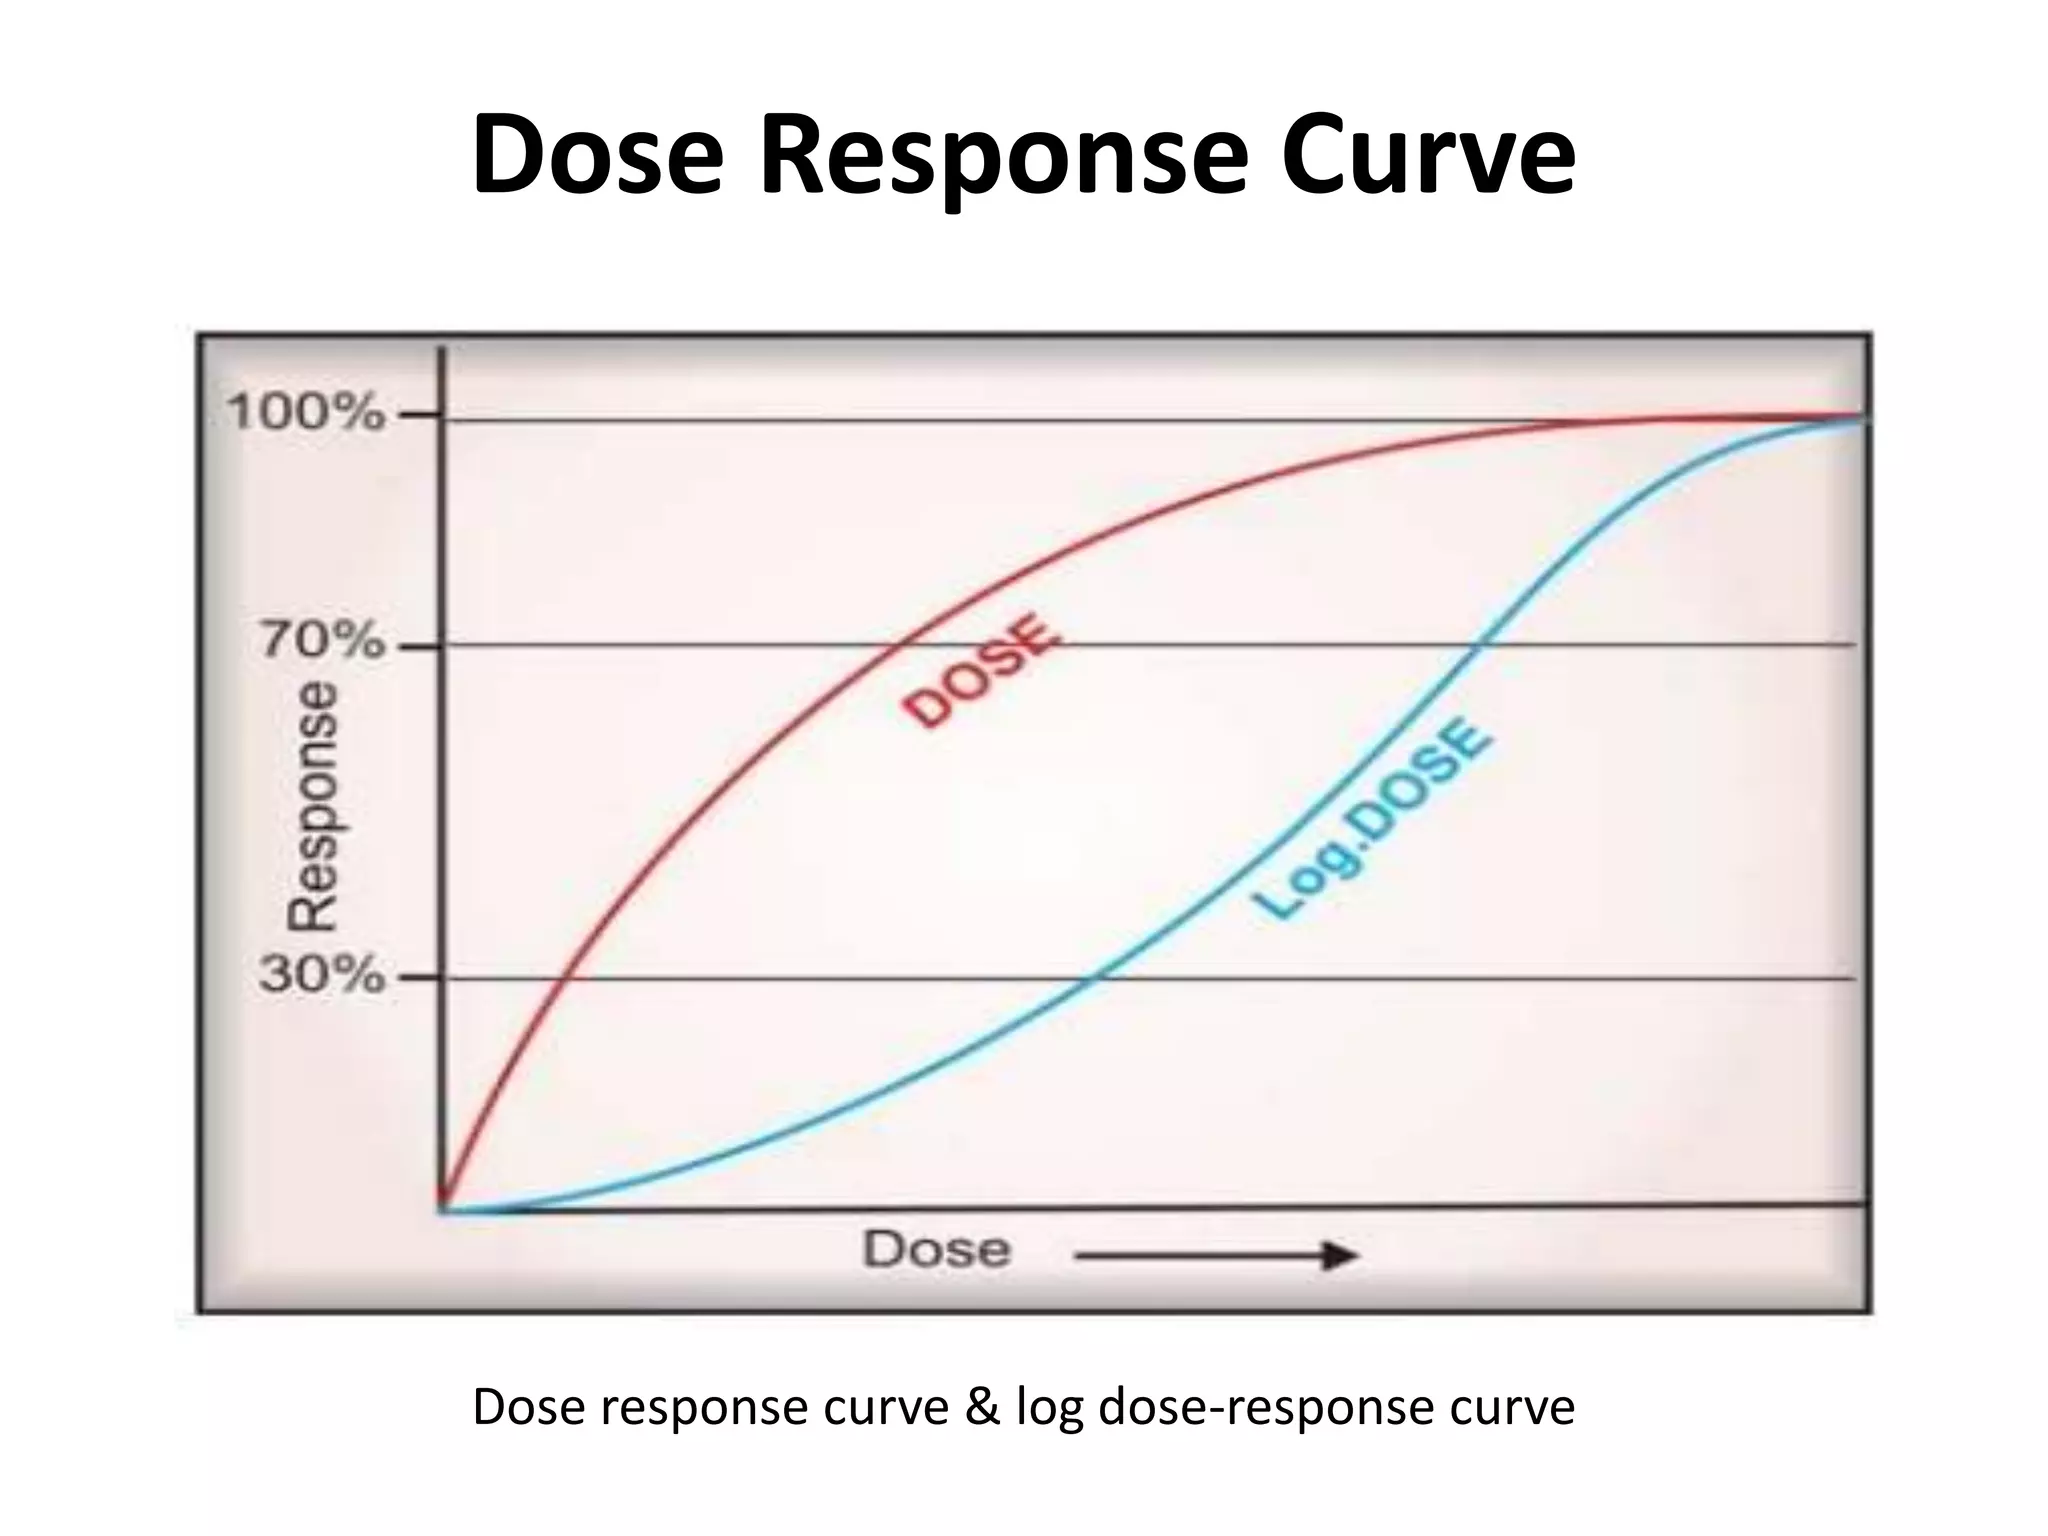


The document discusses dose-response curves and their significance. It explains that dose-response curves show the relationship between the dose of a drug administered and the intensity of response produced. A log dose-response curve becomes sigmoid shaped and allows comparison of drug potency. The position, slope and maximum effect of the curve provide information about a drug's potency, efficacy, safety, therapeutic index and window. Quantal and graded dose-response curves are used to assess different types of drug responses.
Introduction to Dose Response relationship and its significance in pharmacology.
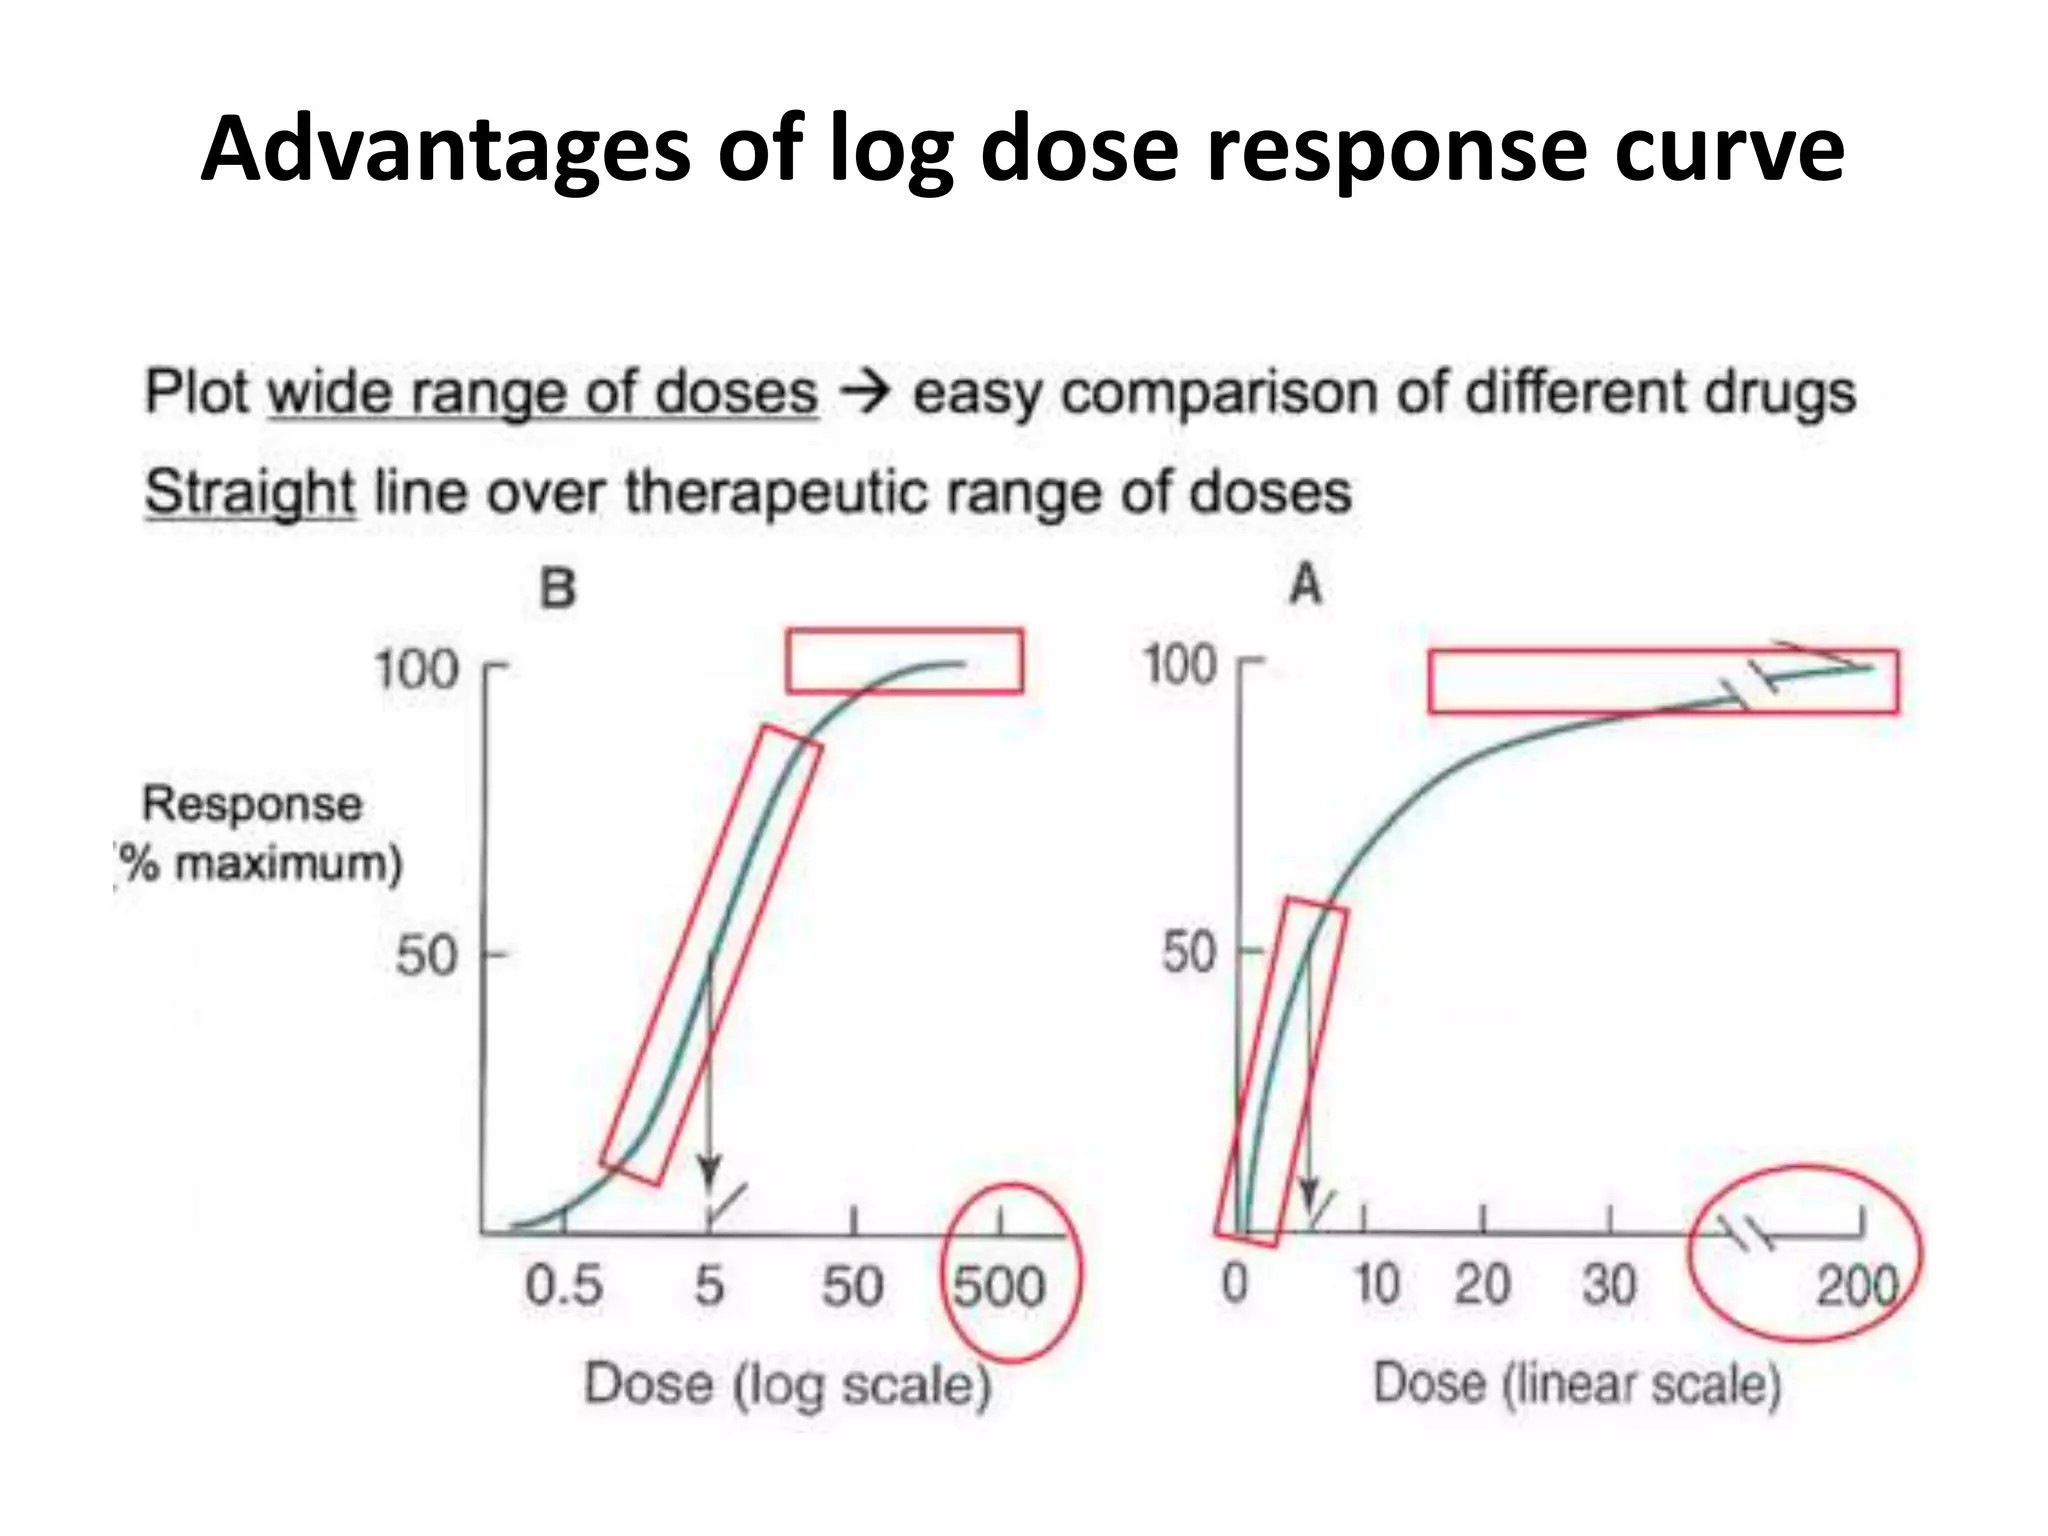
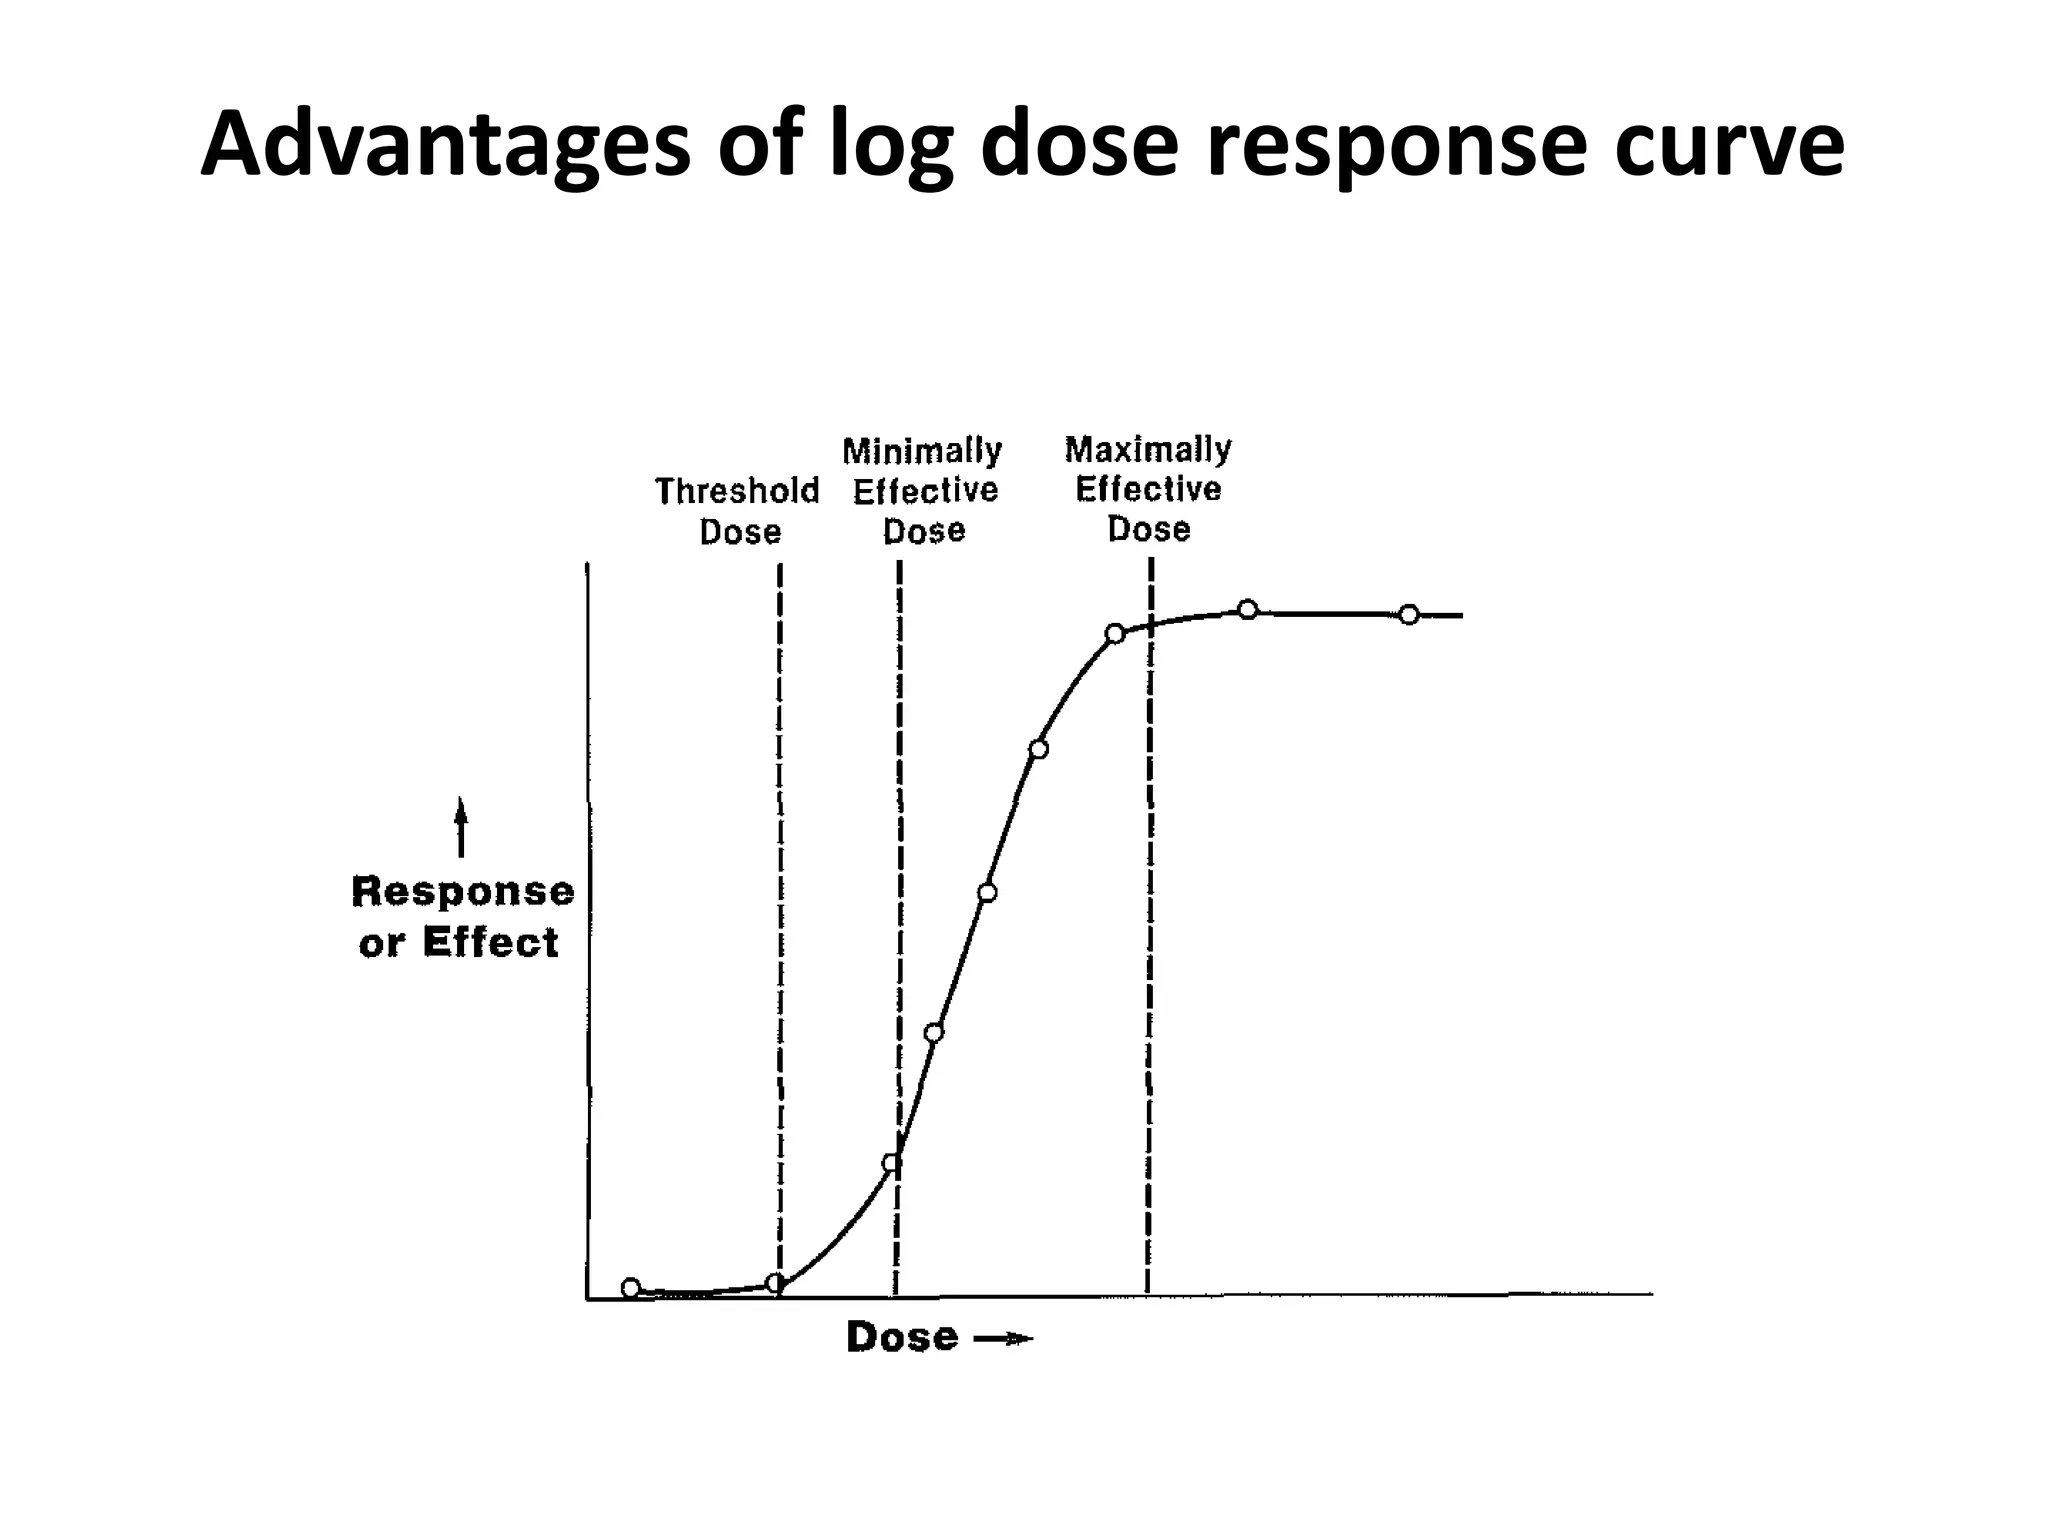
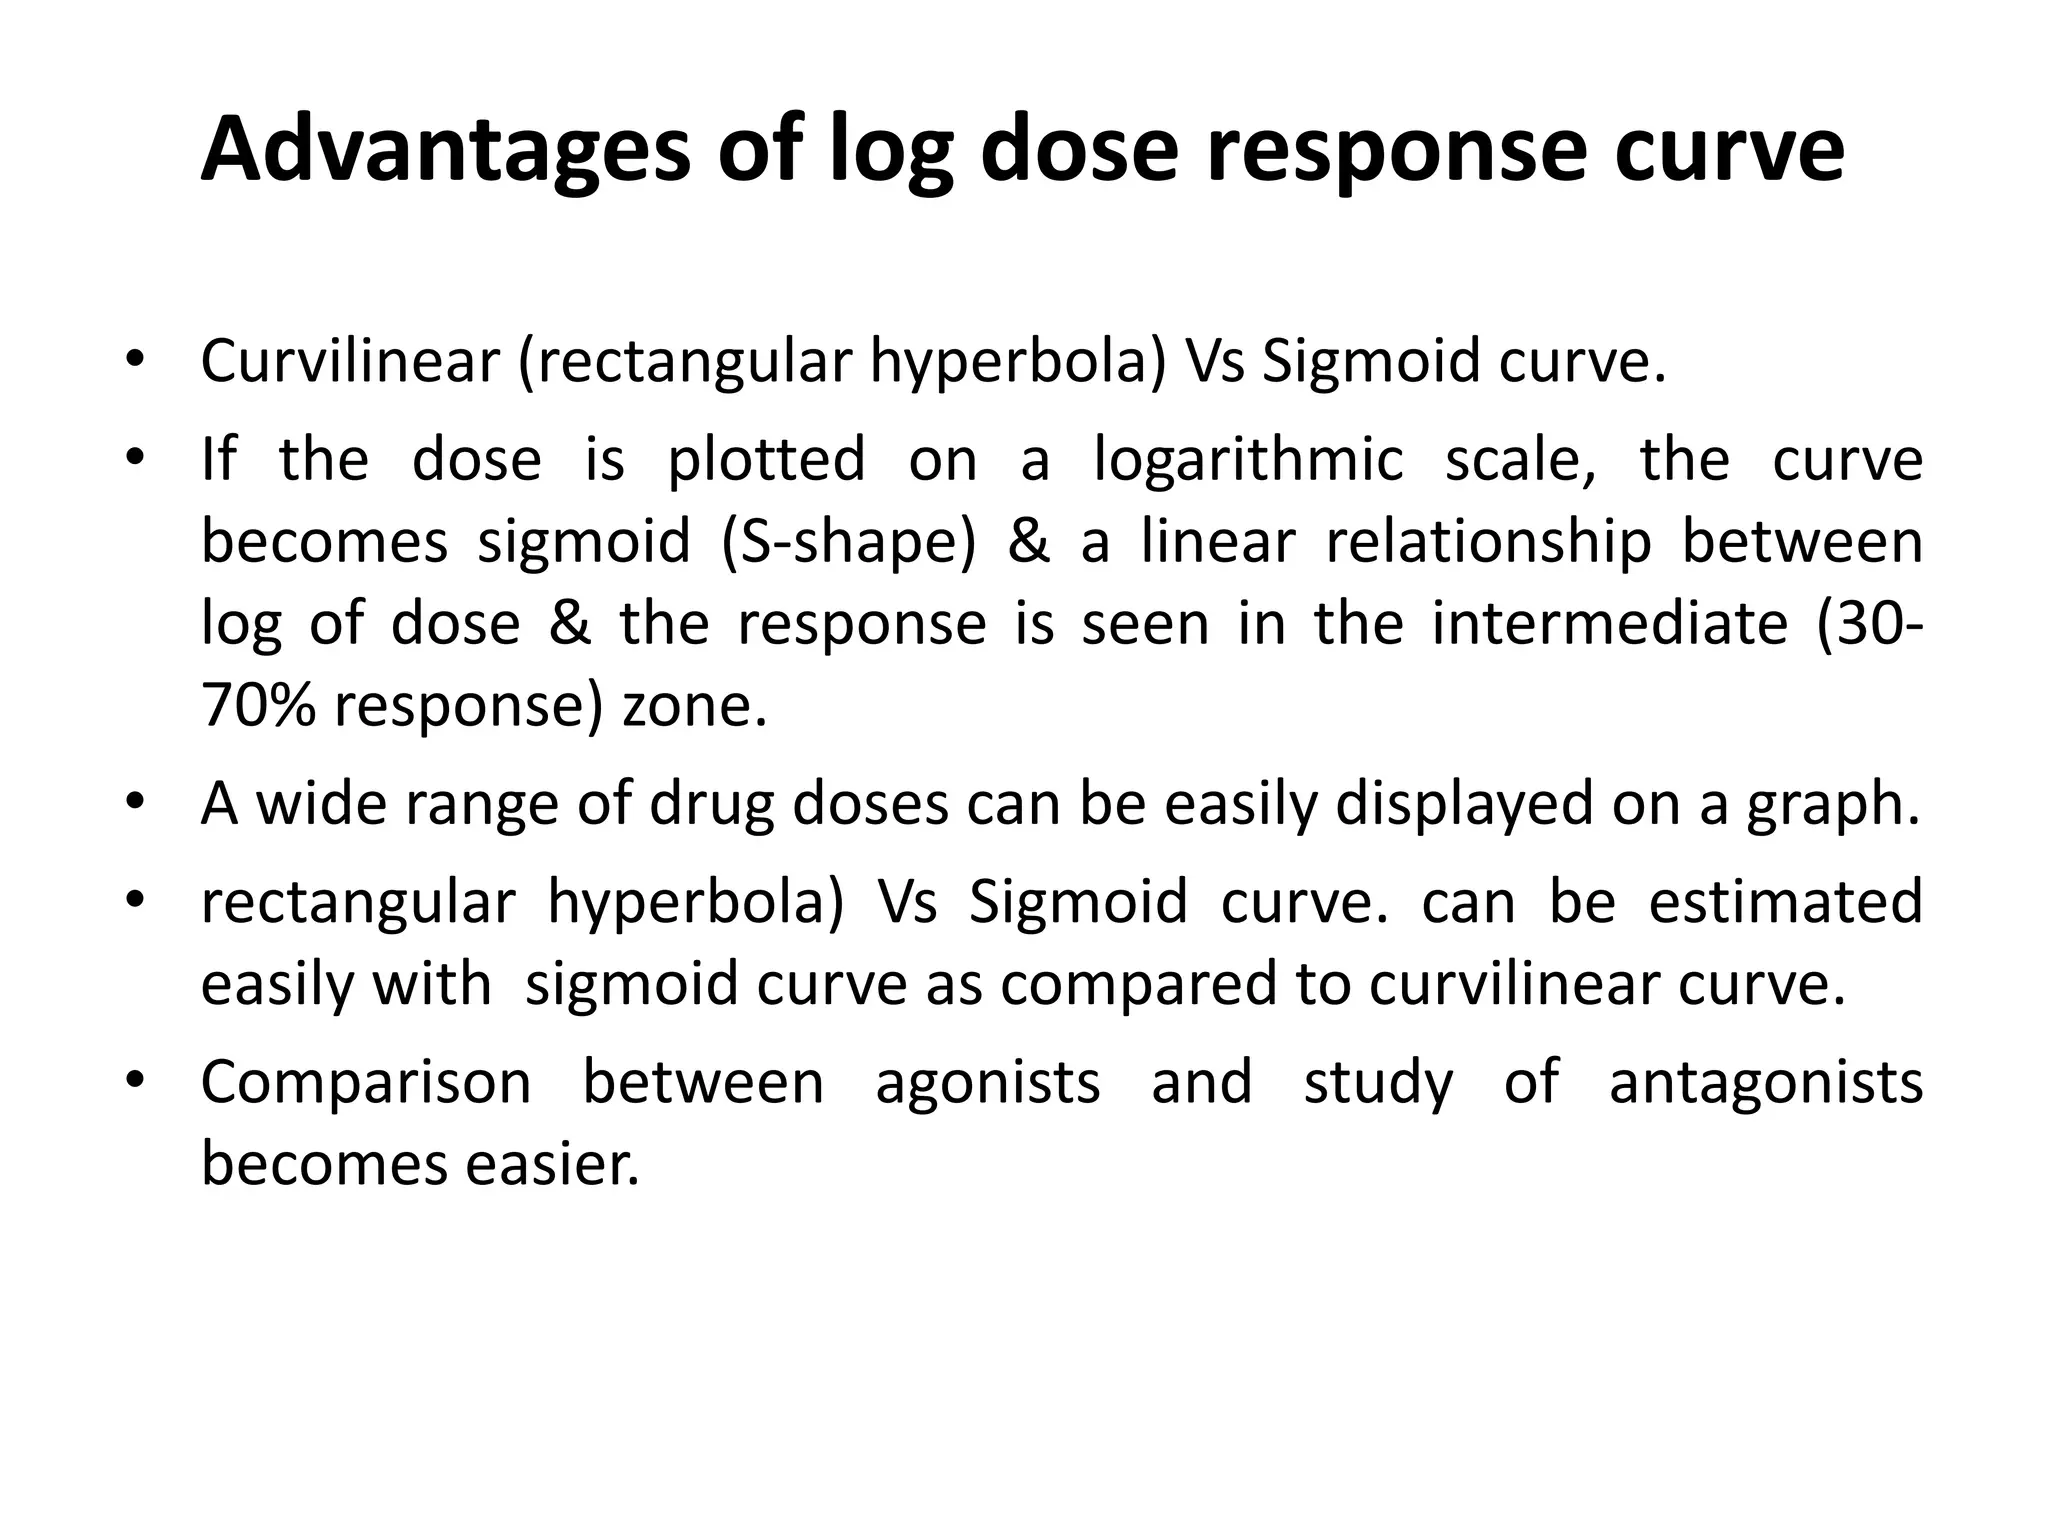
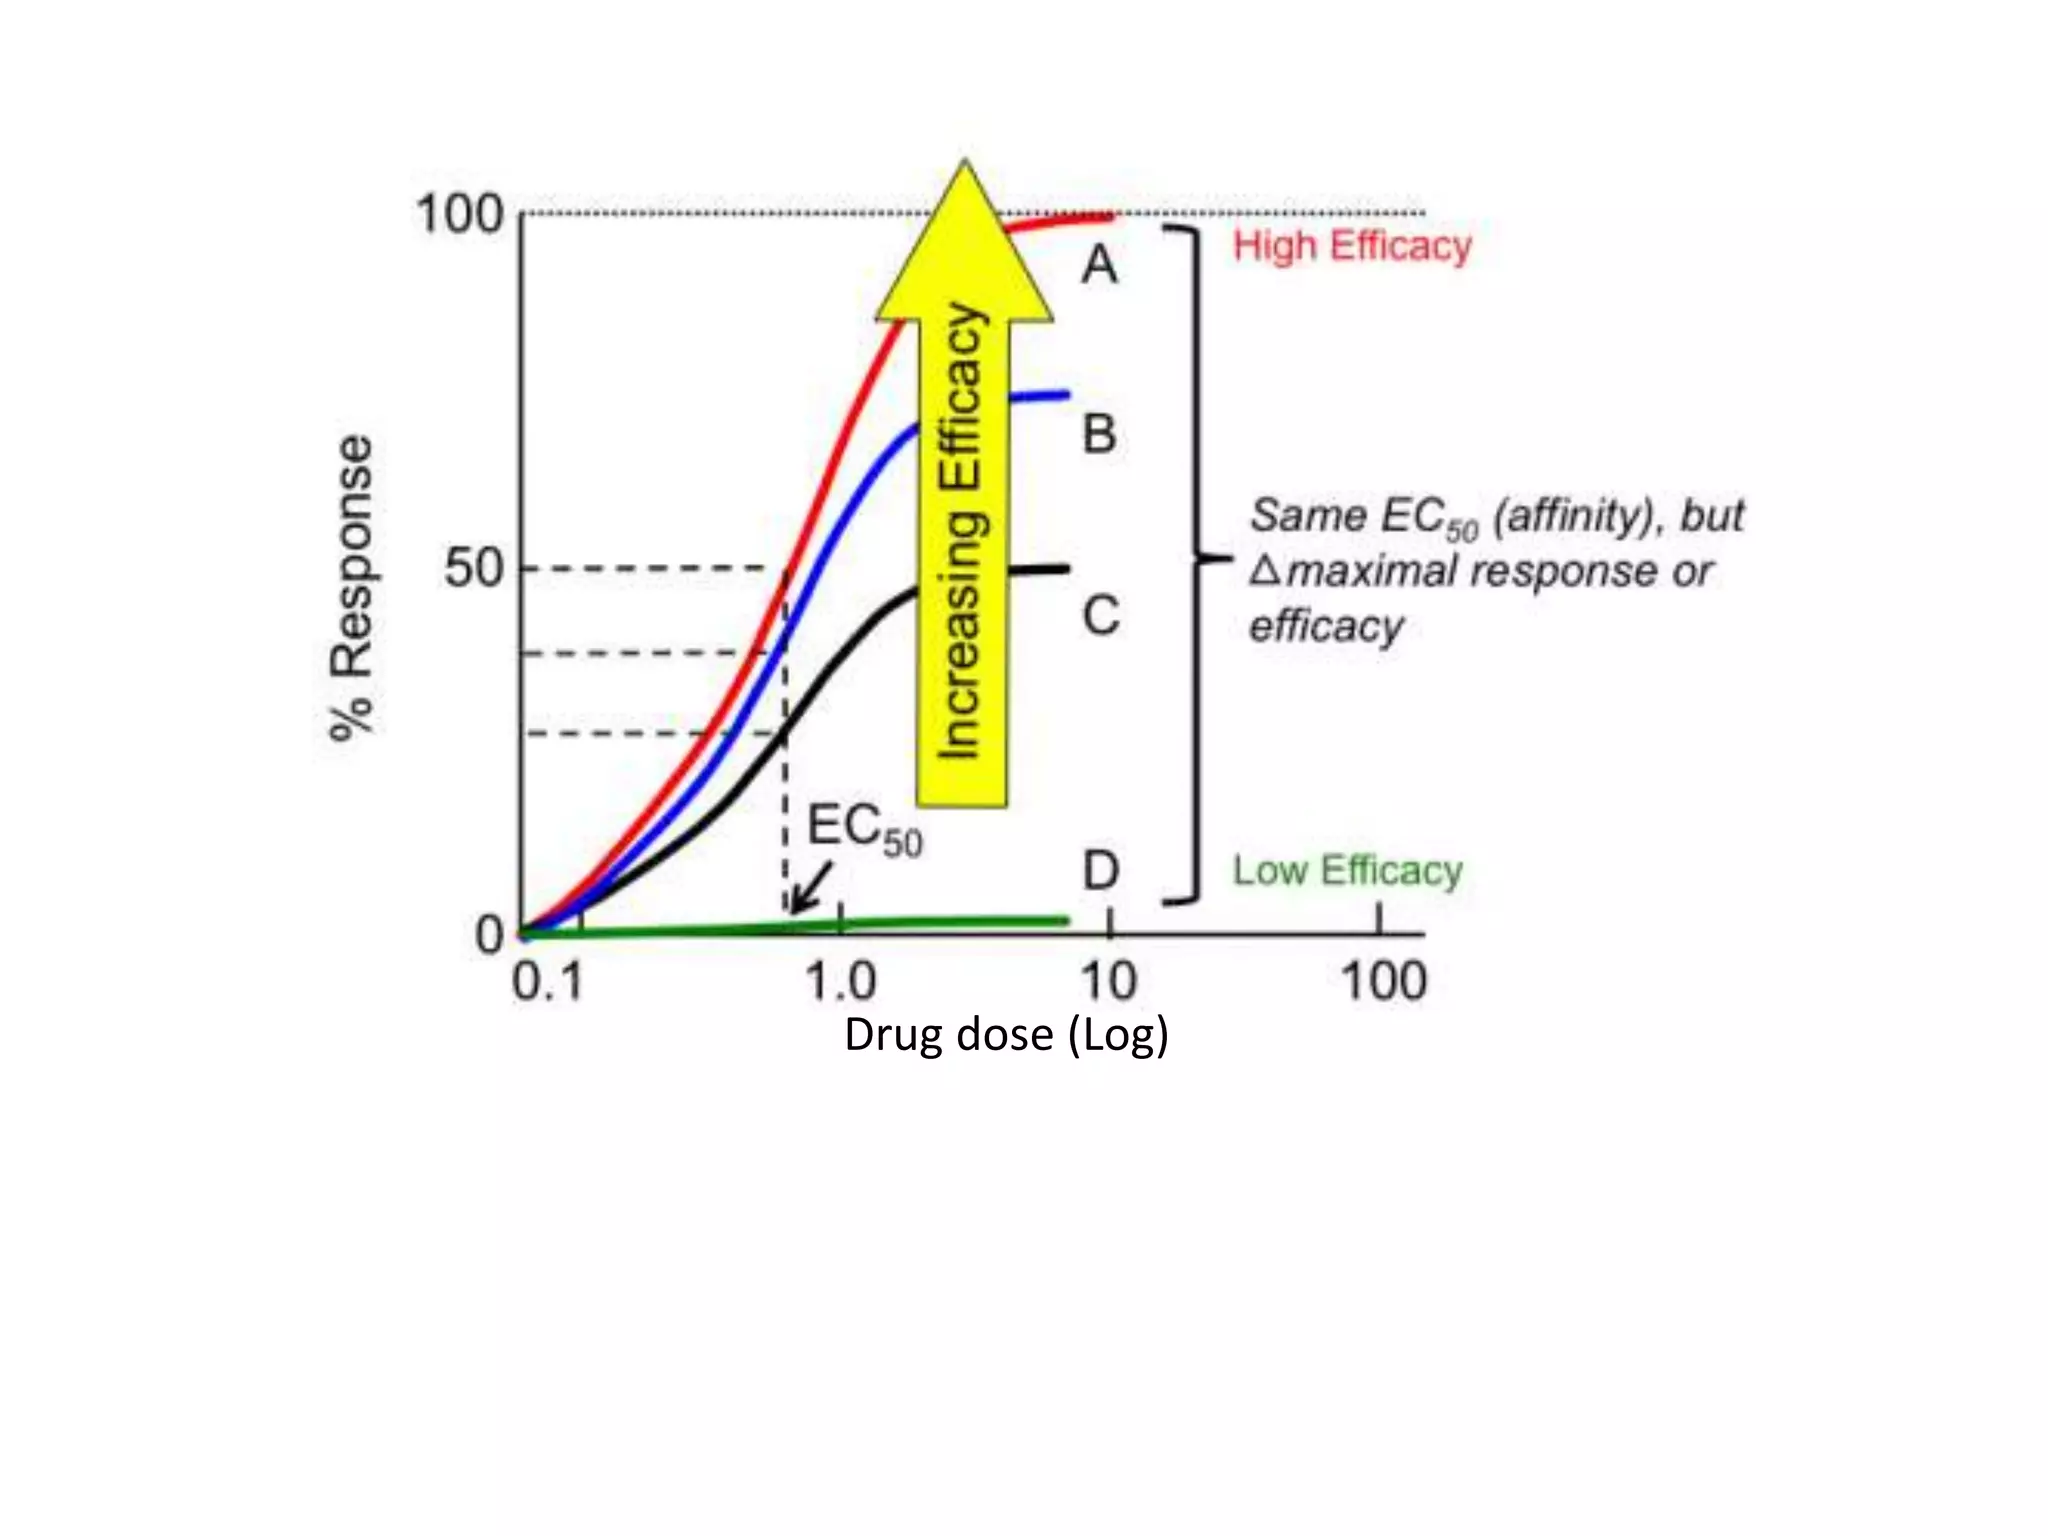
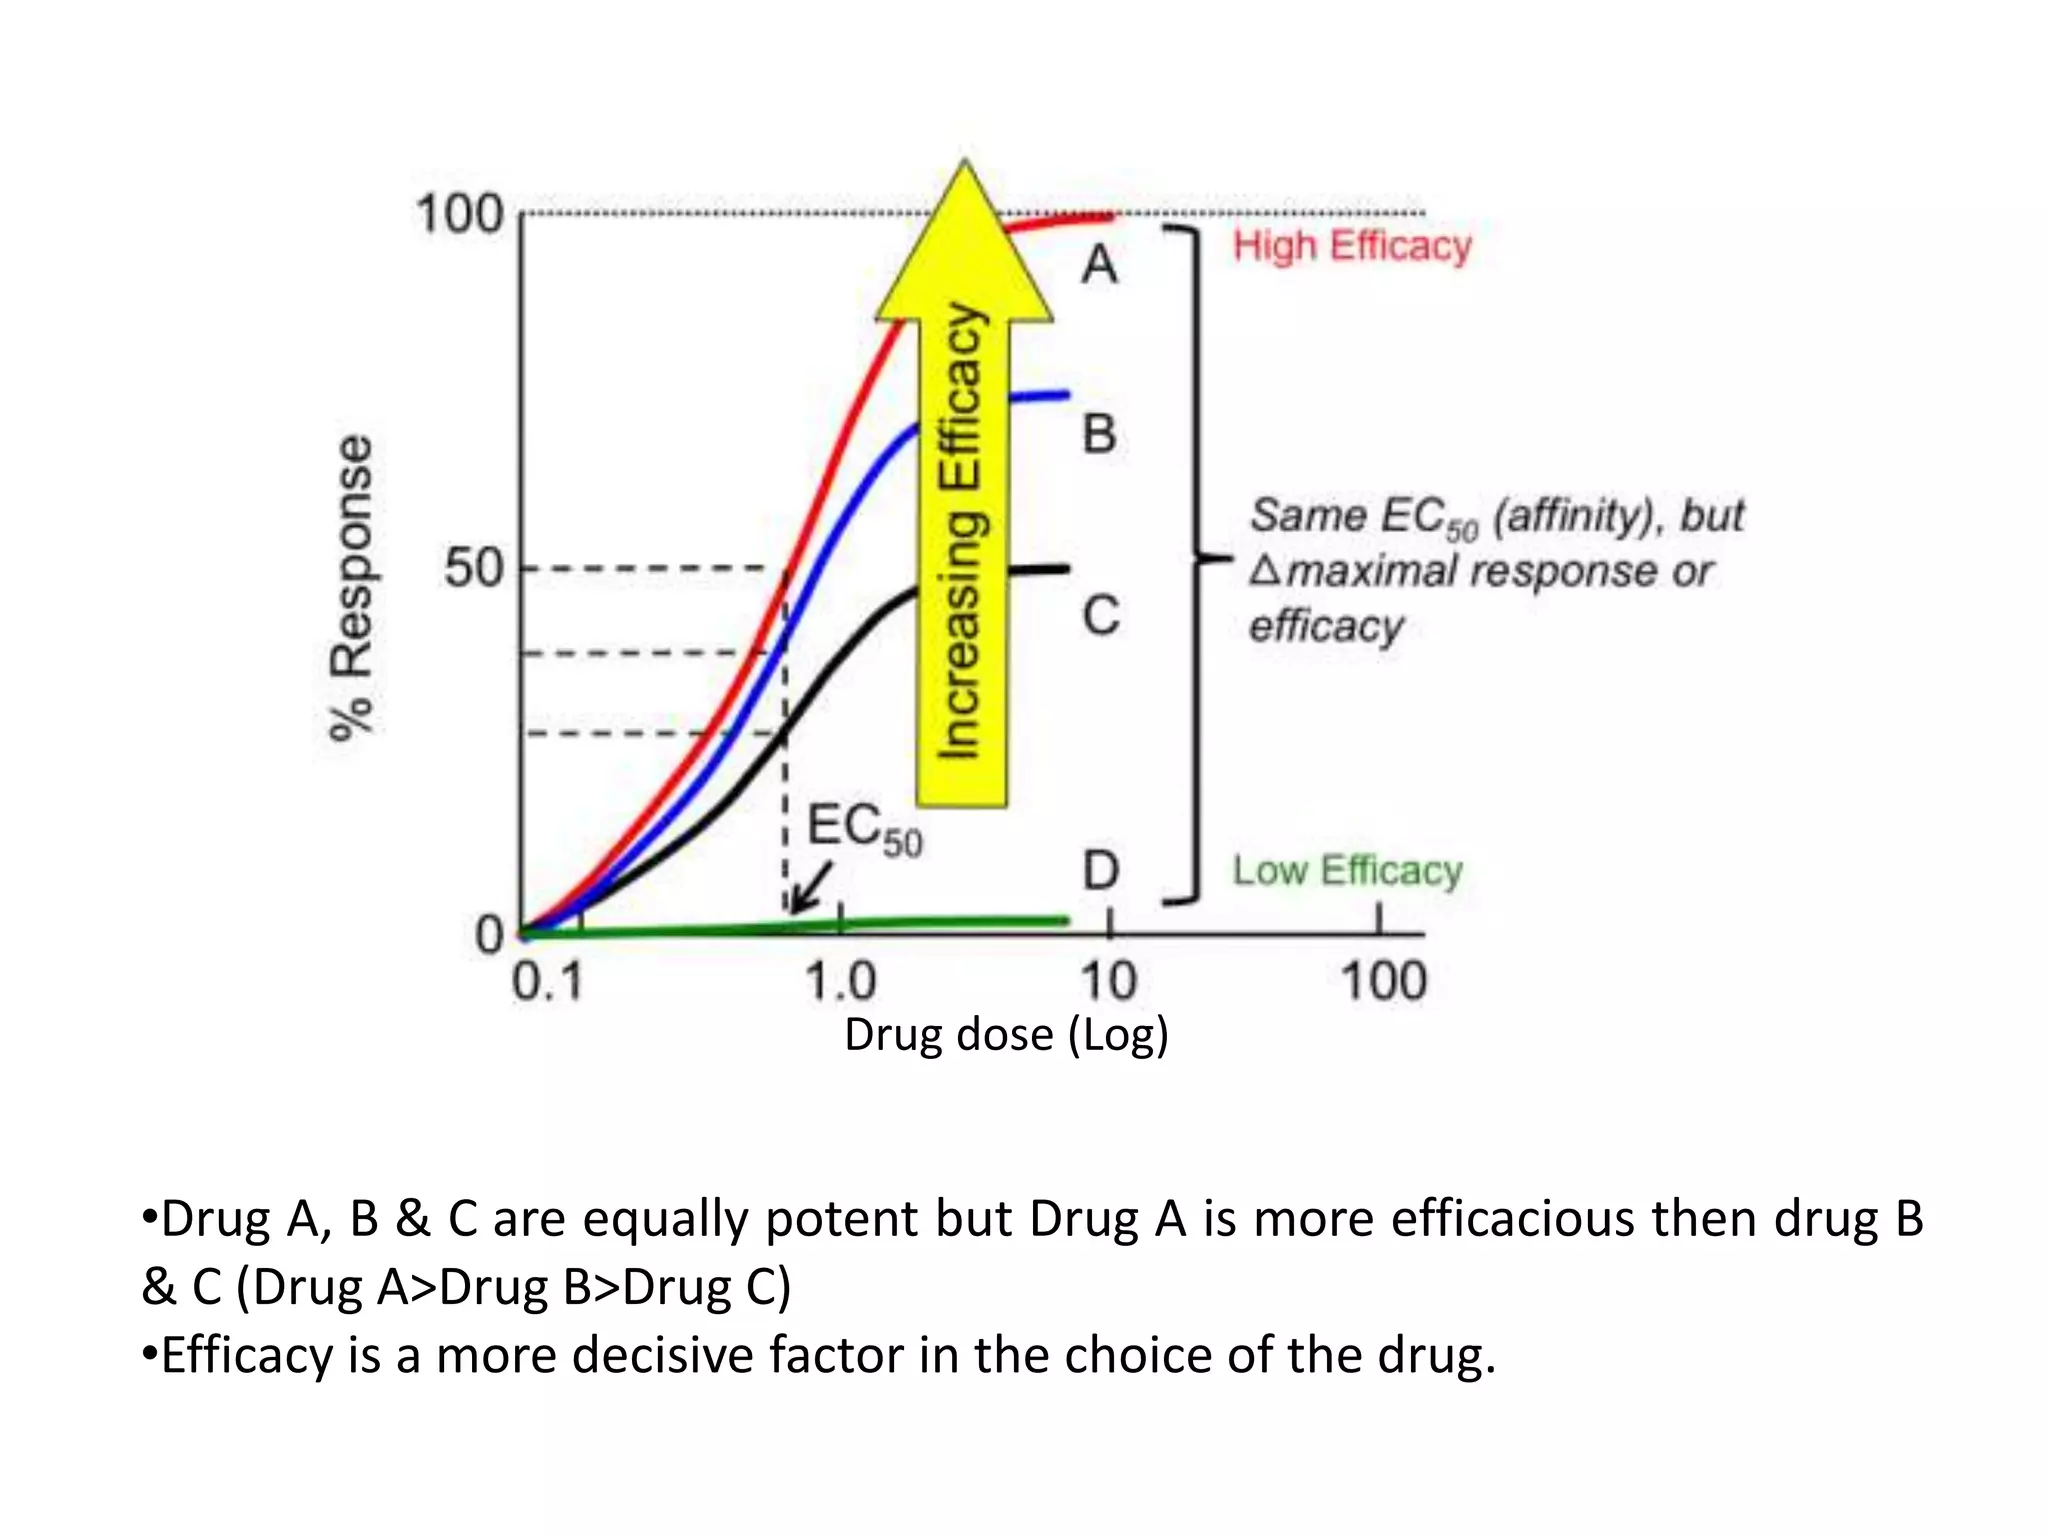
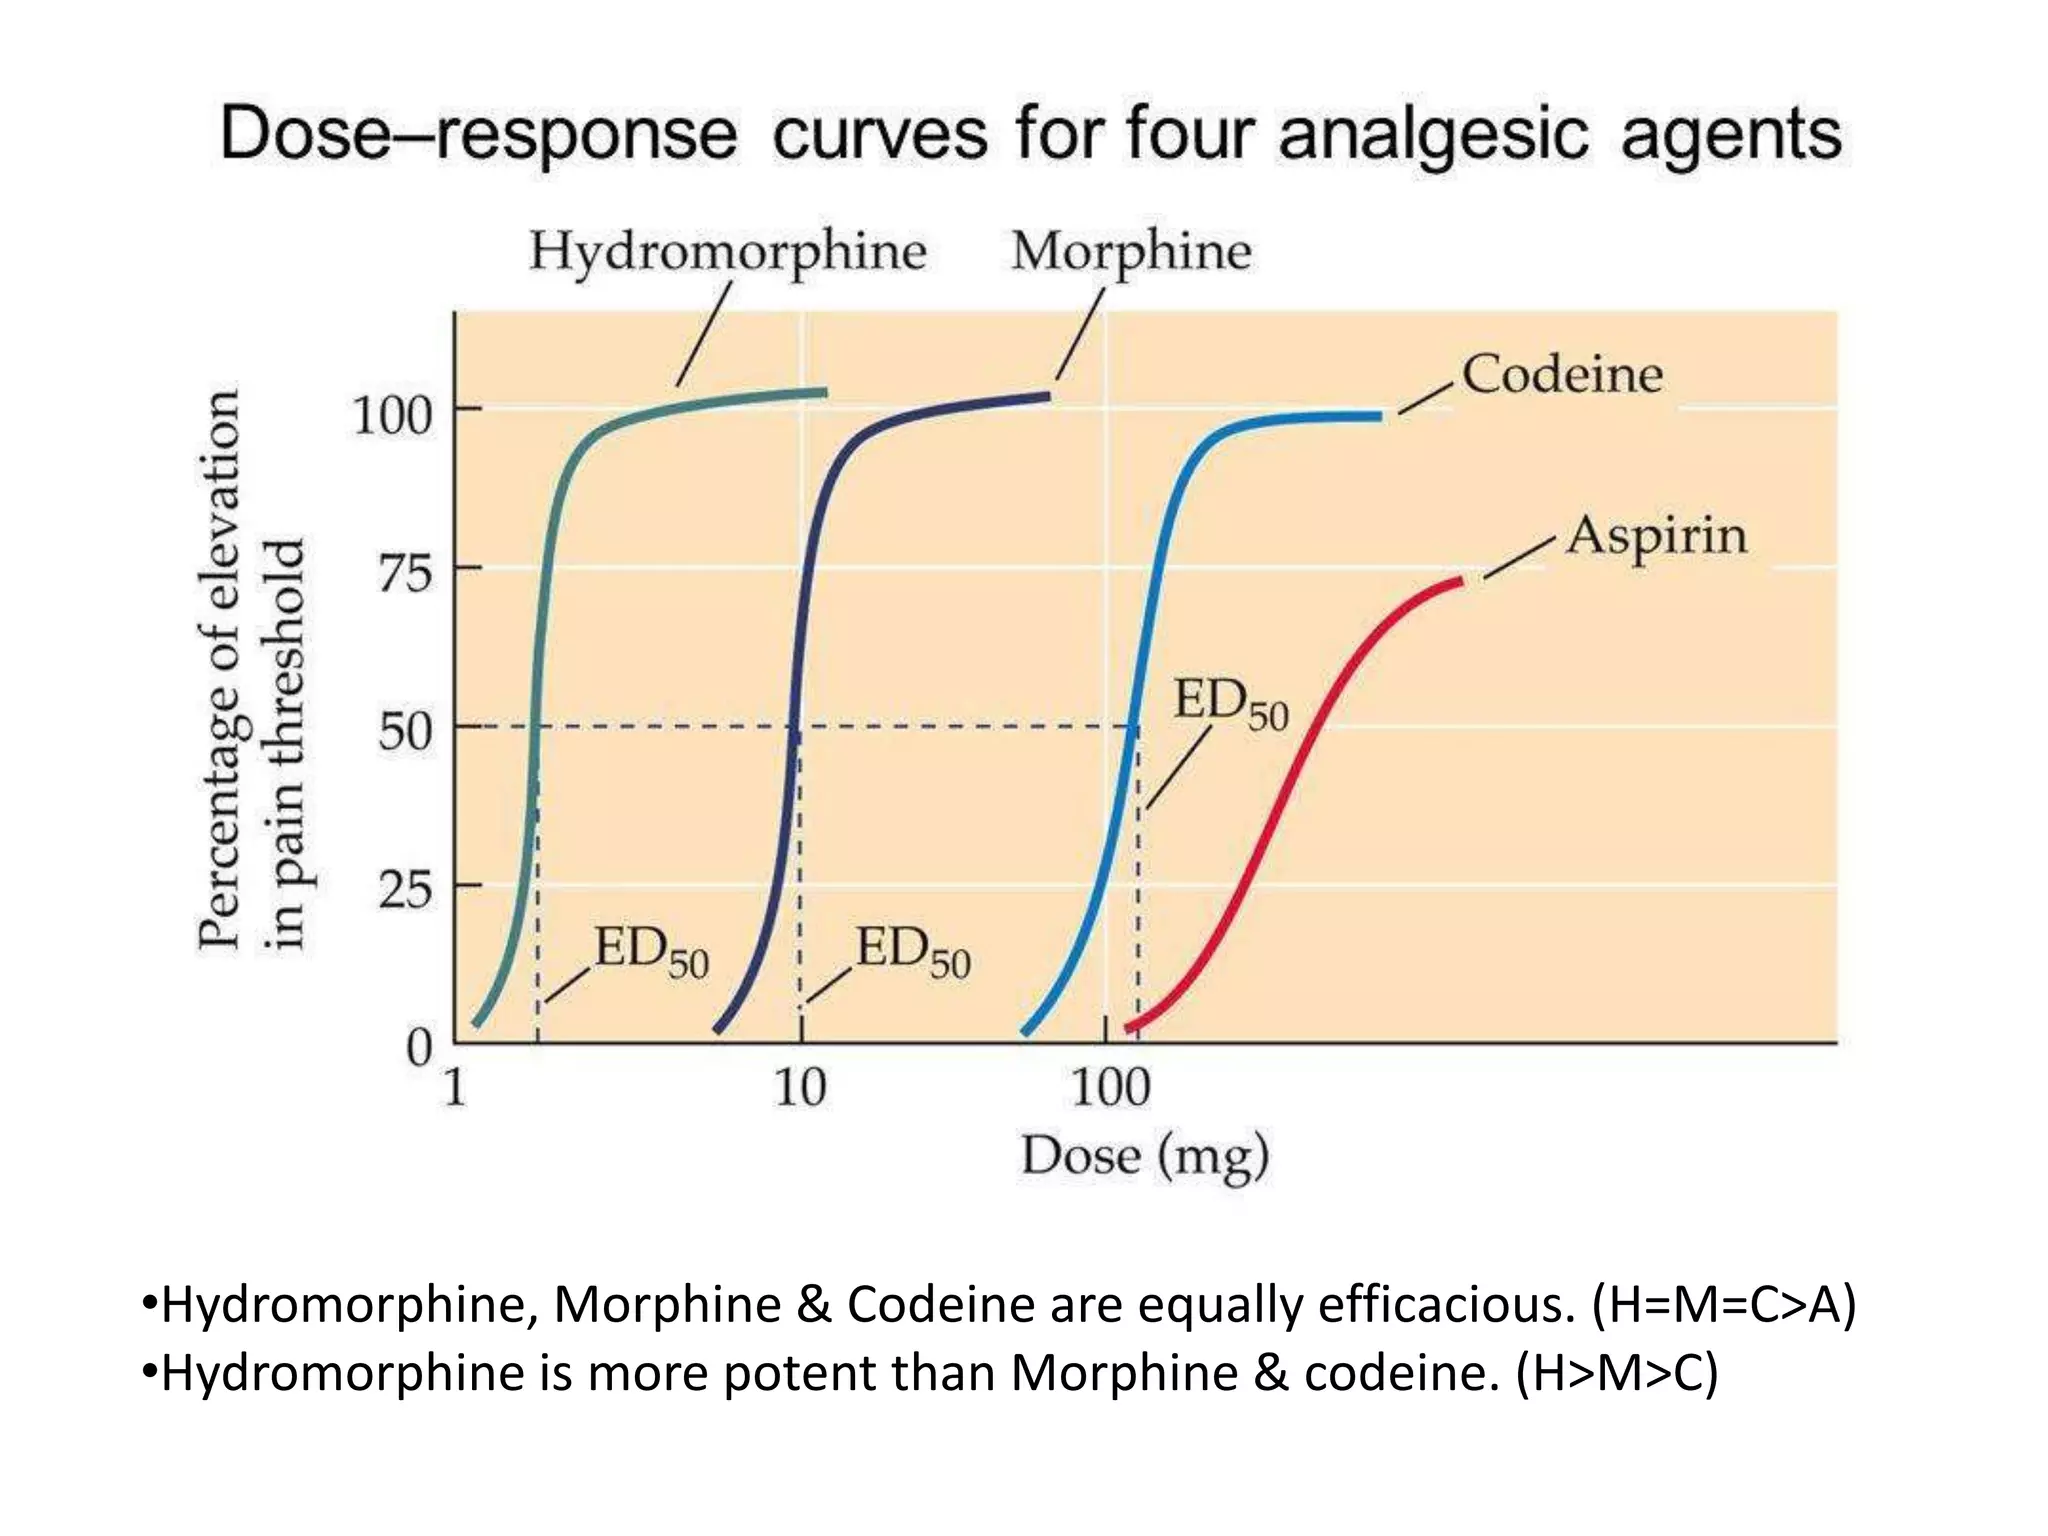
Advantages of log dose response curves and their application in comparing drug efficacy.
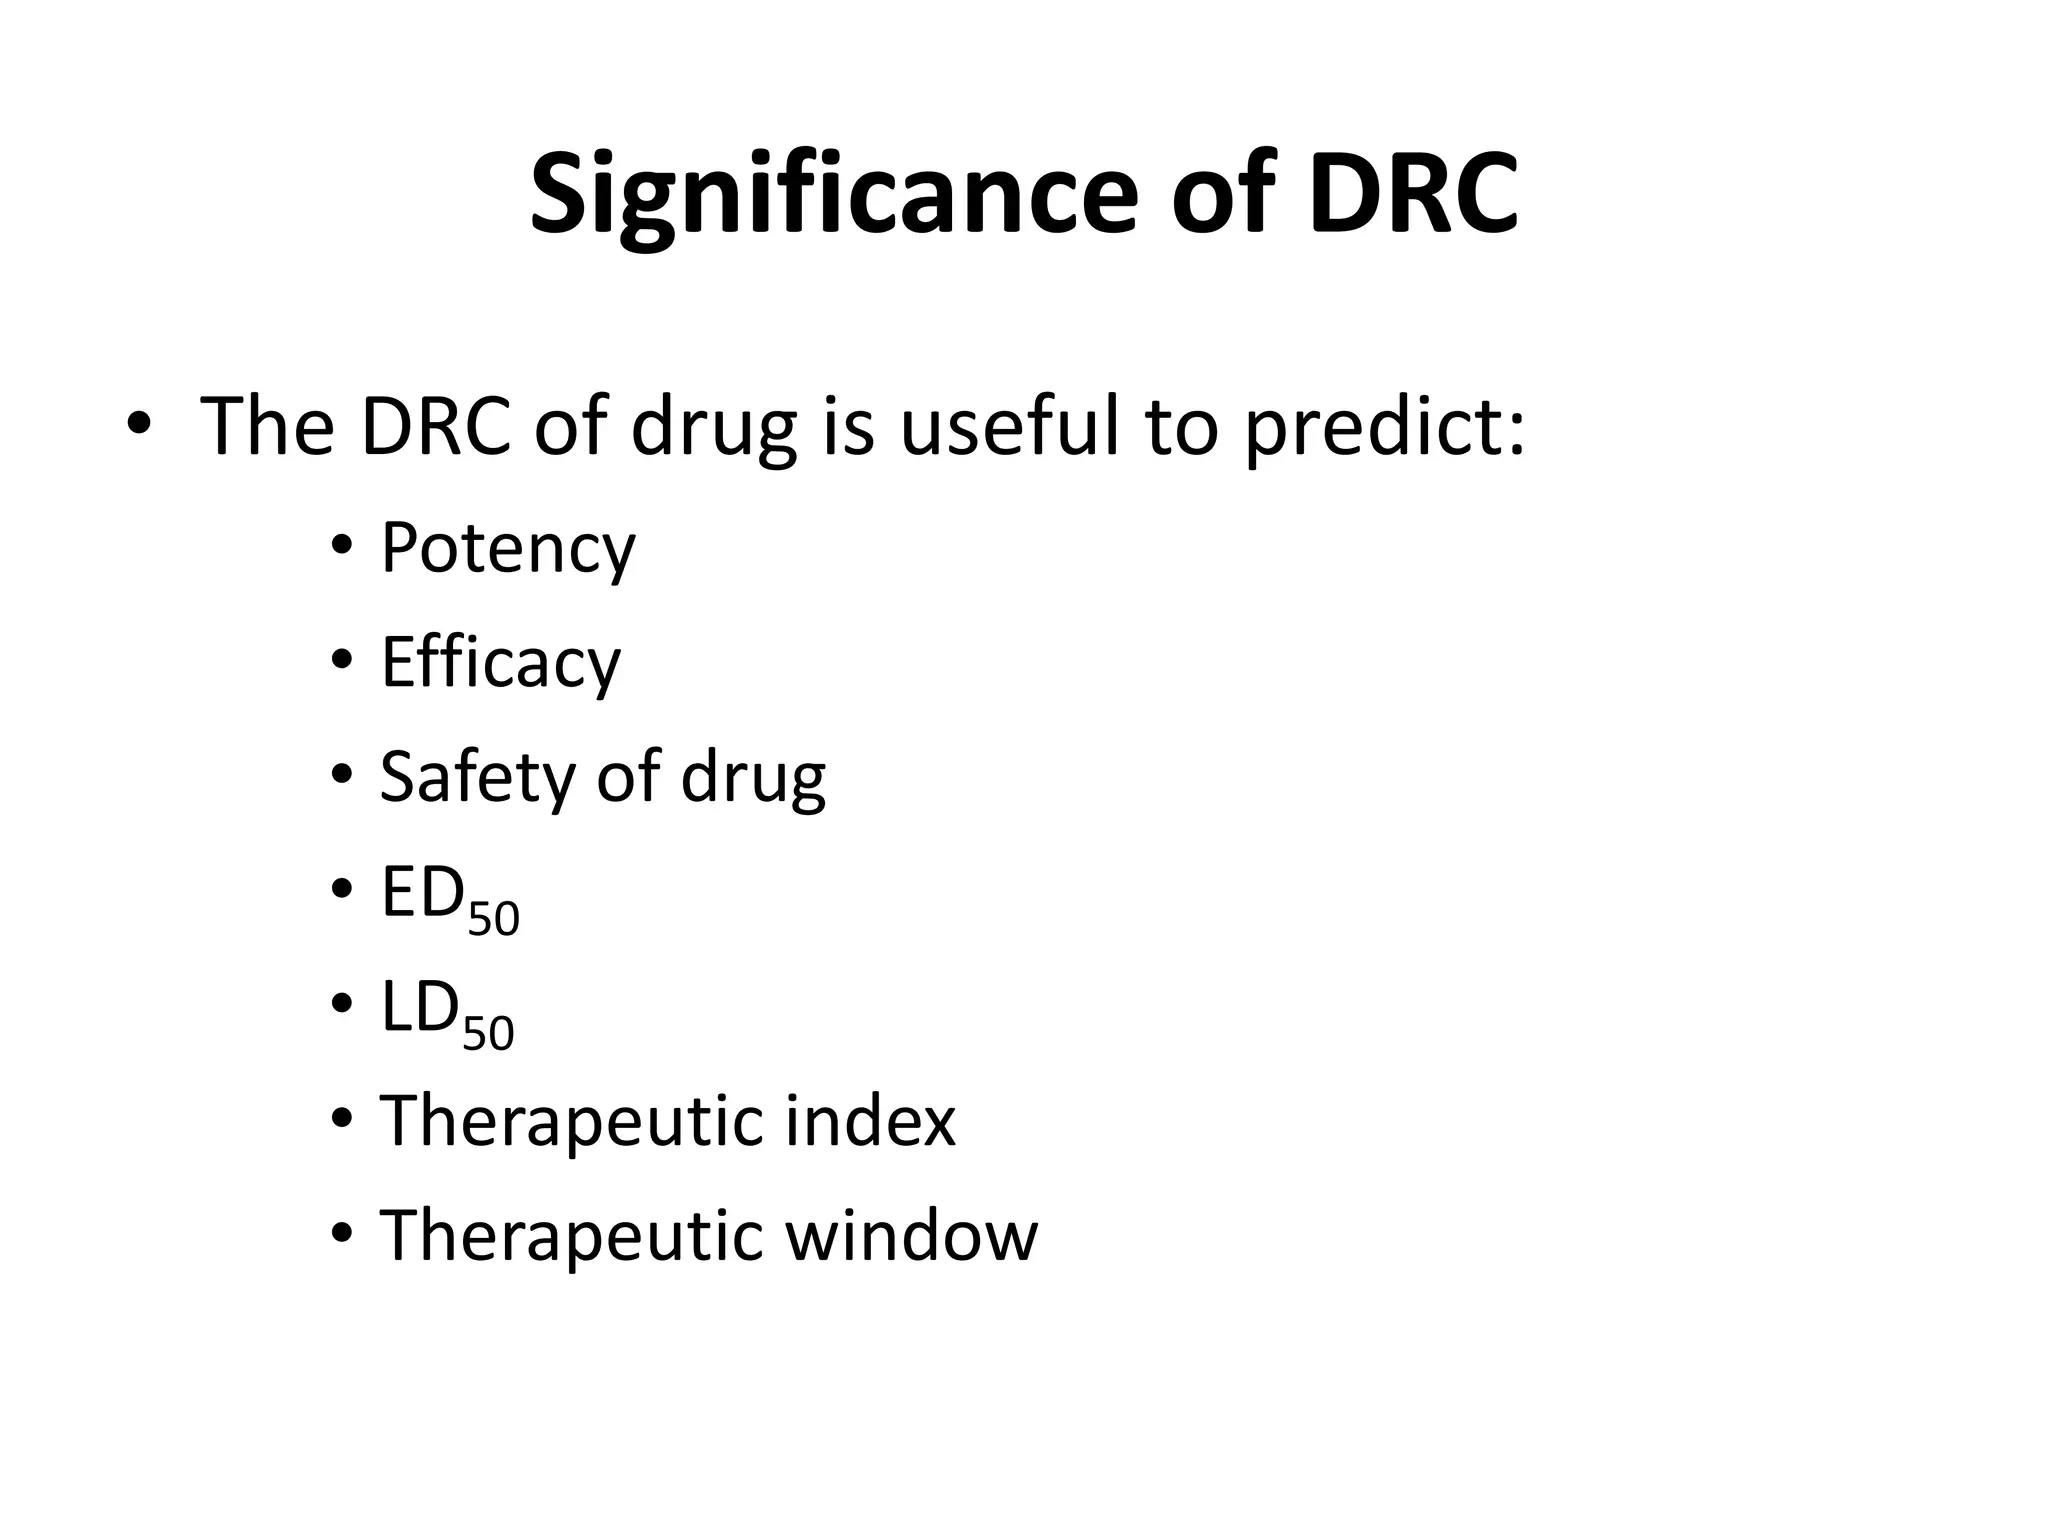
Use of DRC to predict drug potency, safety, and effectiveness metrics like ED50 and LD50.
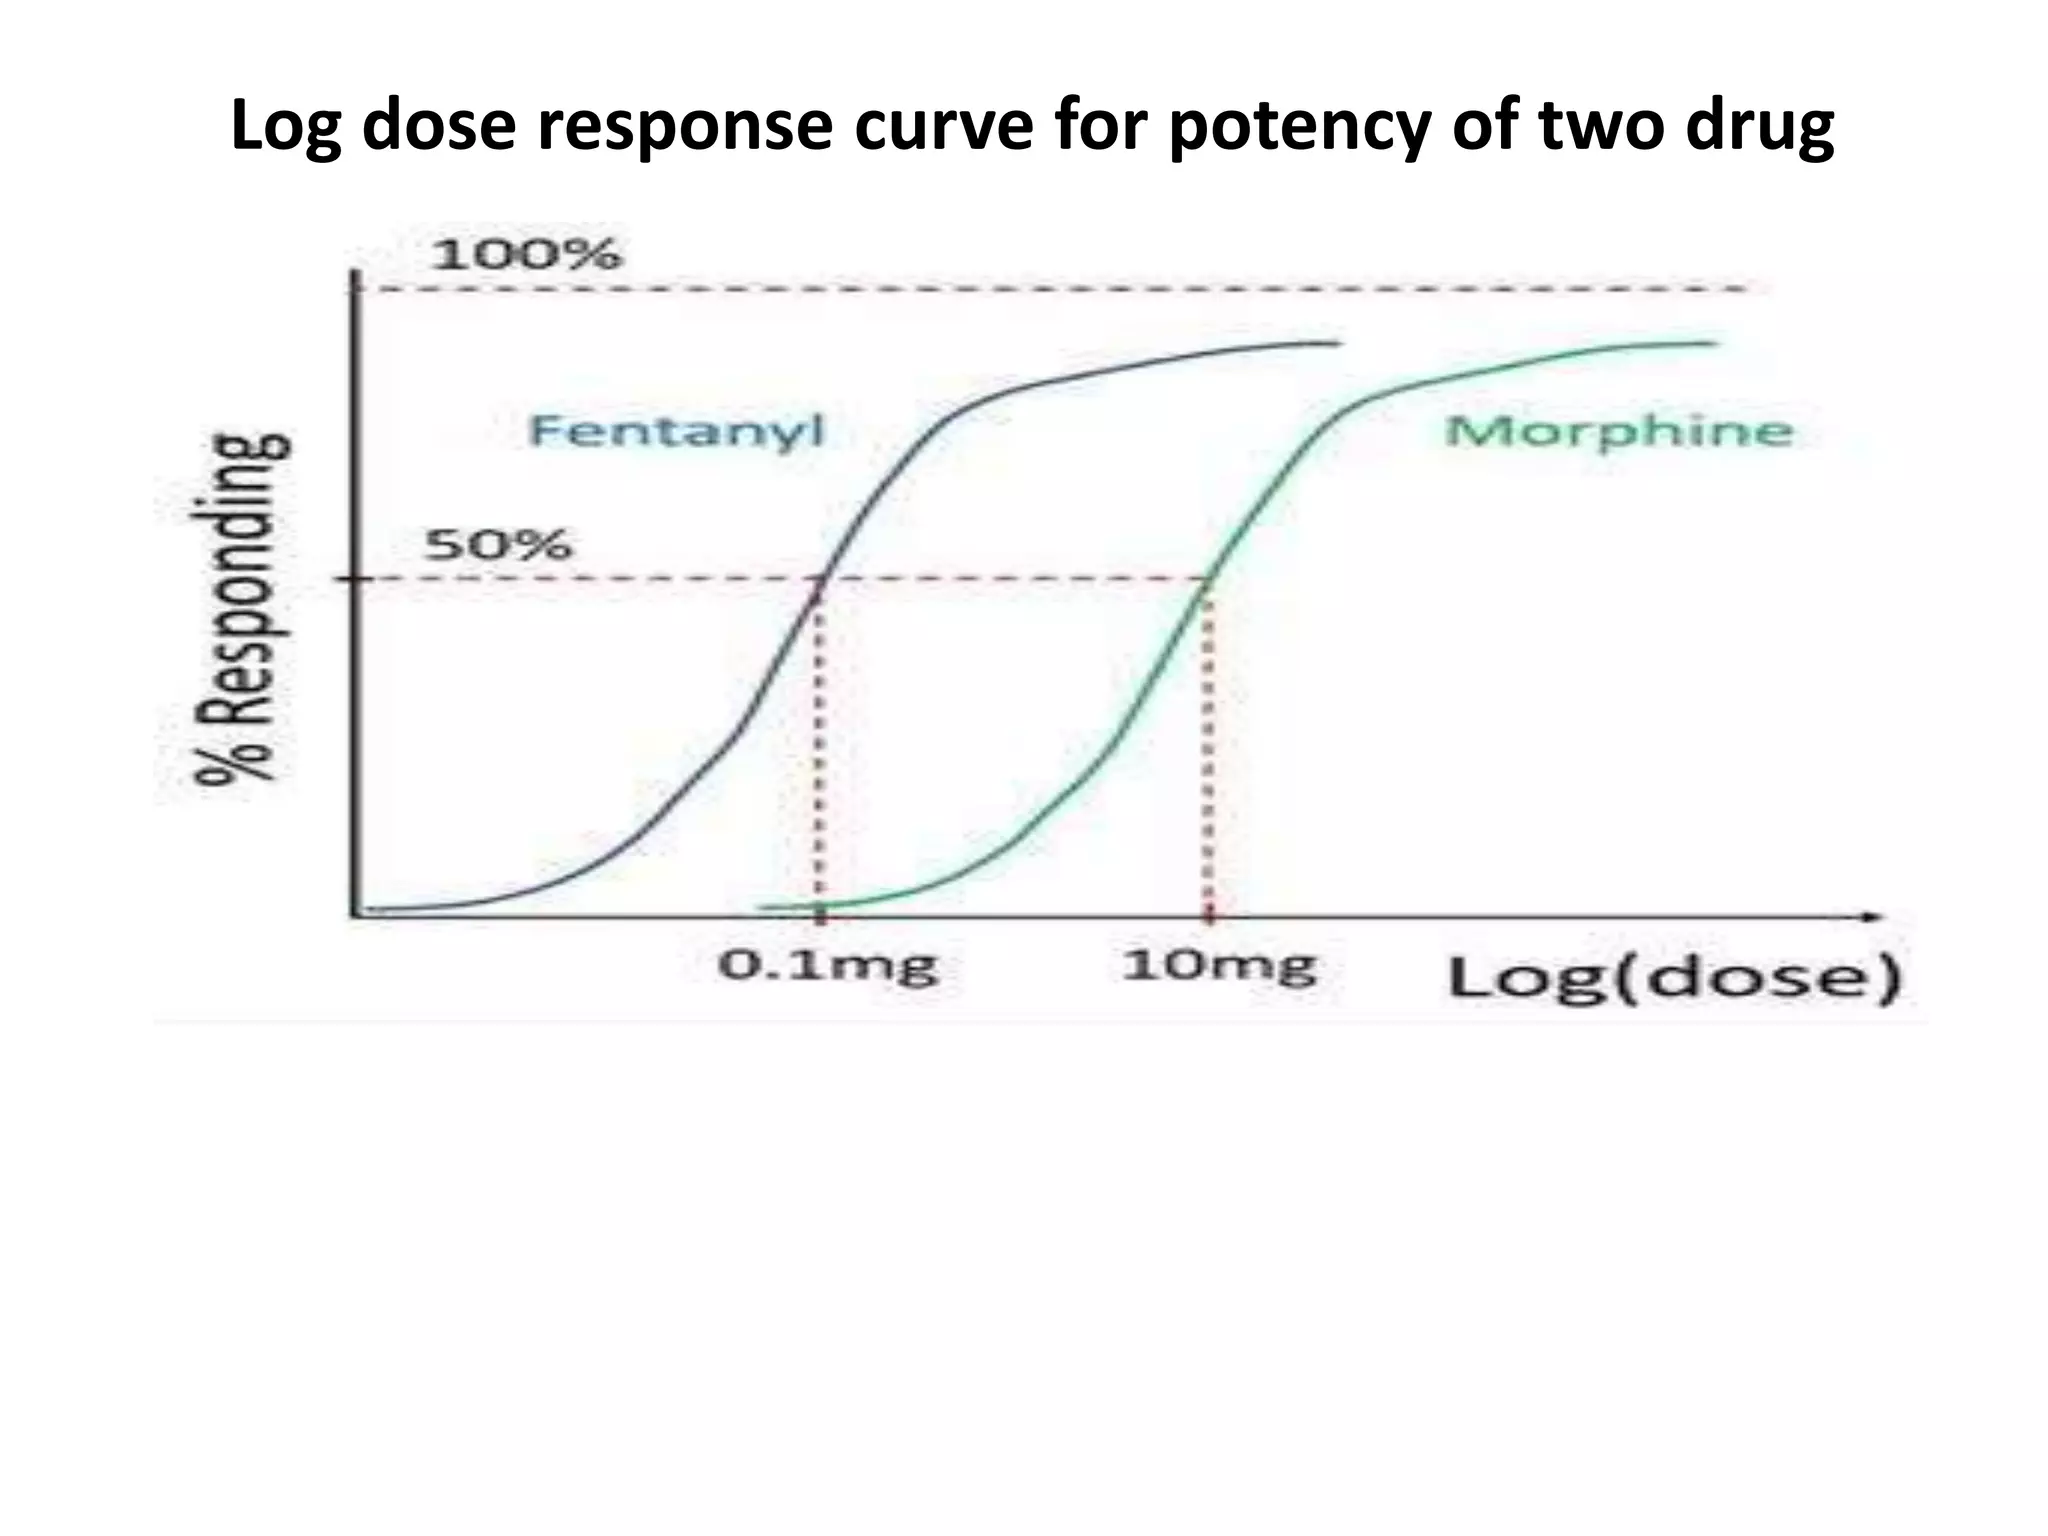
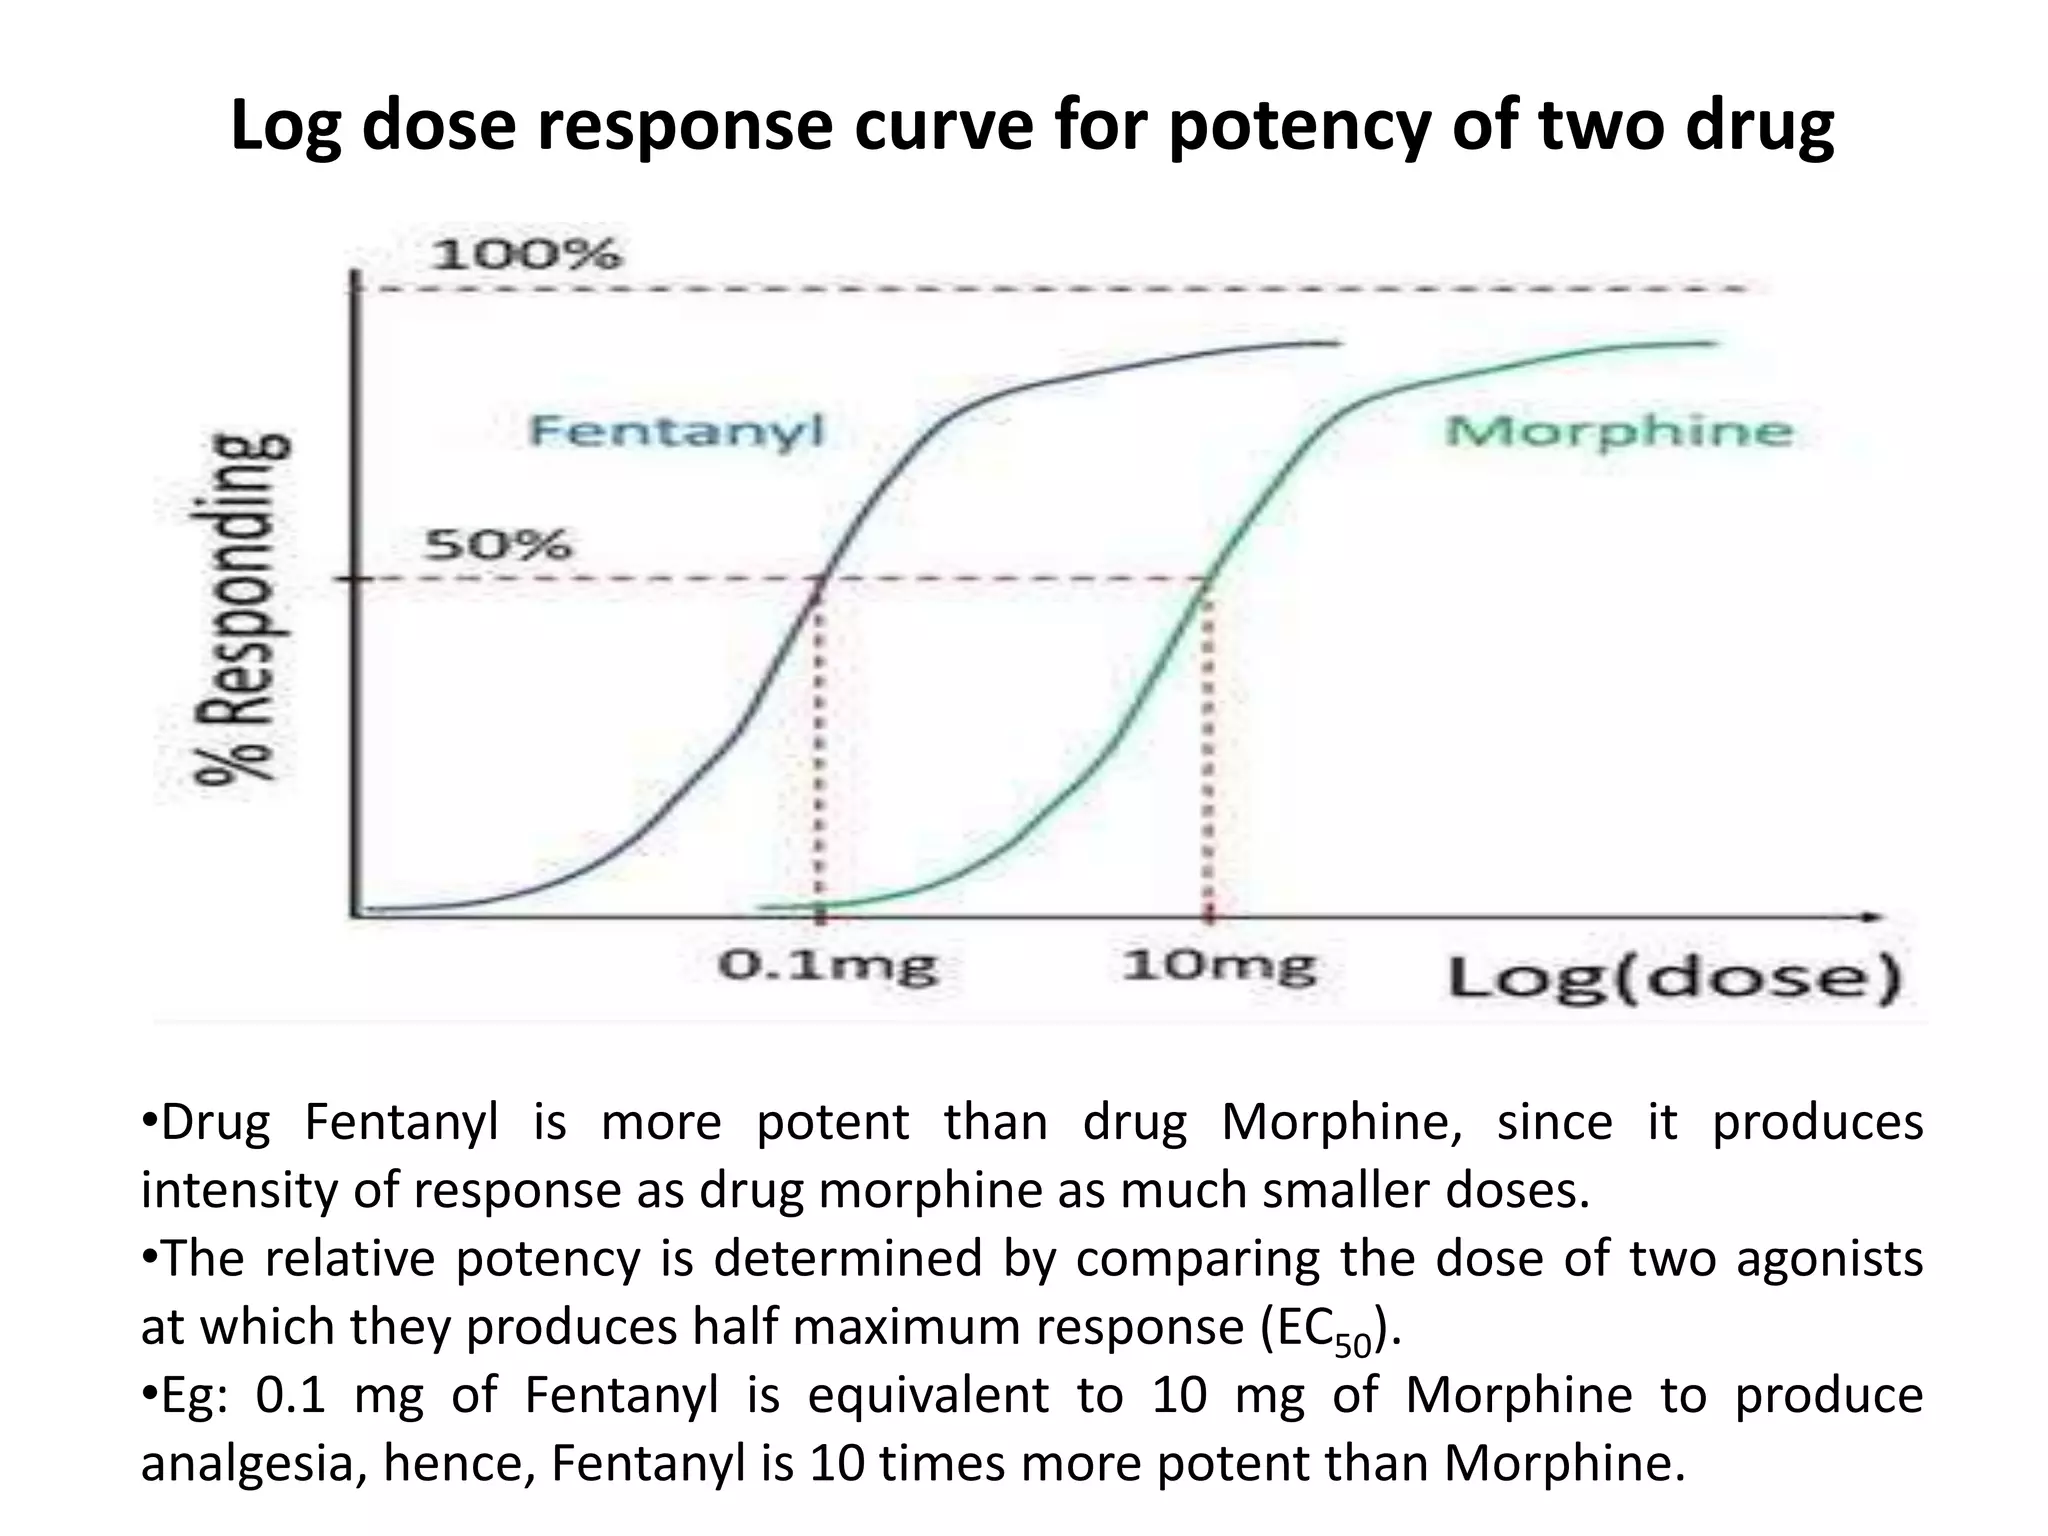
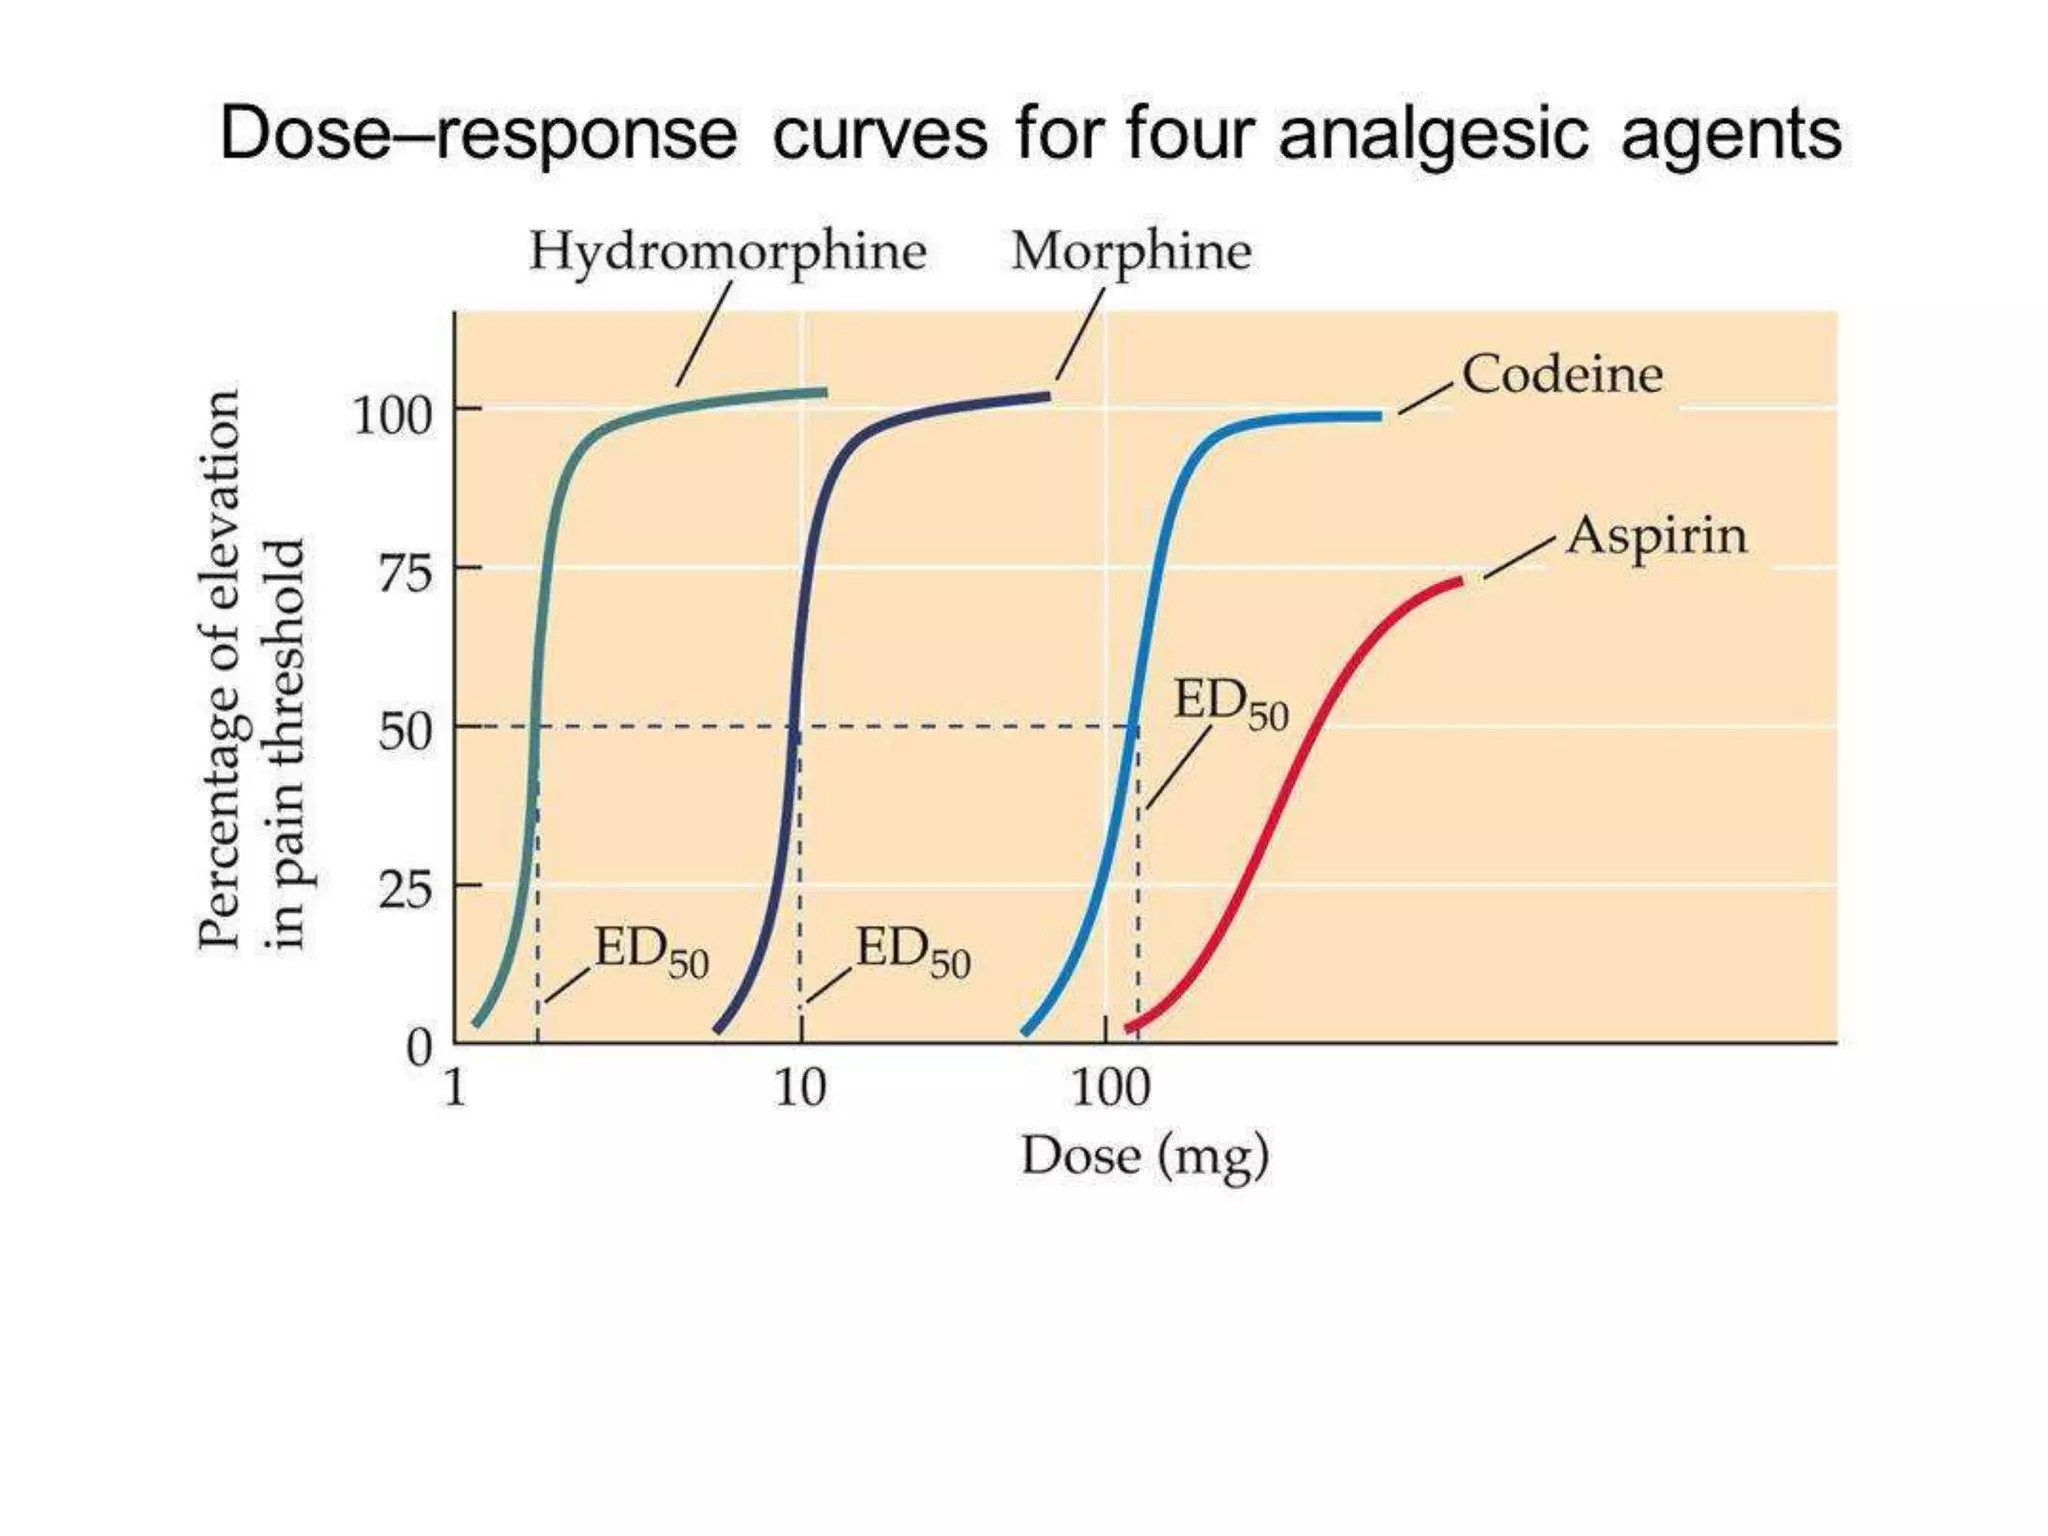
Example of potency comparison between Fentanyl and Morphine using their DRC.
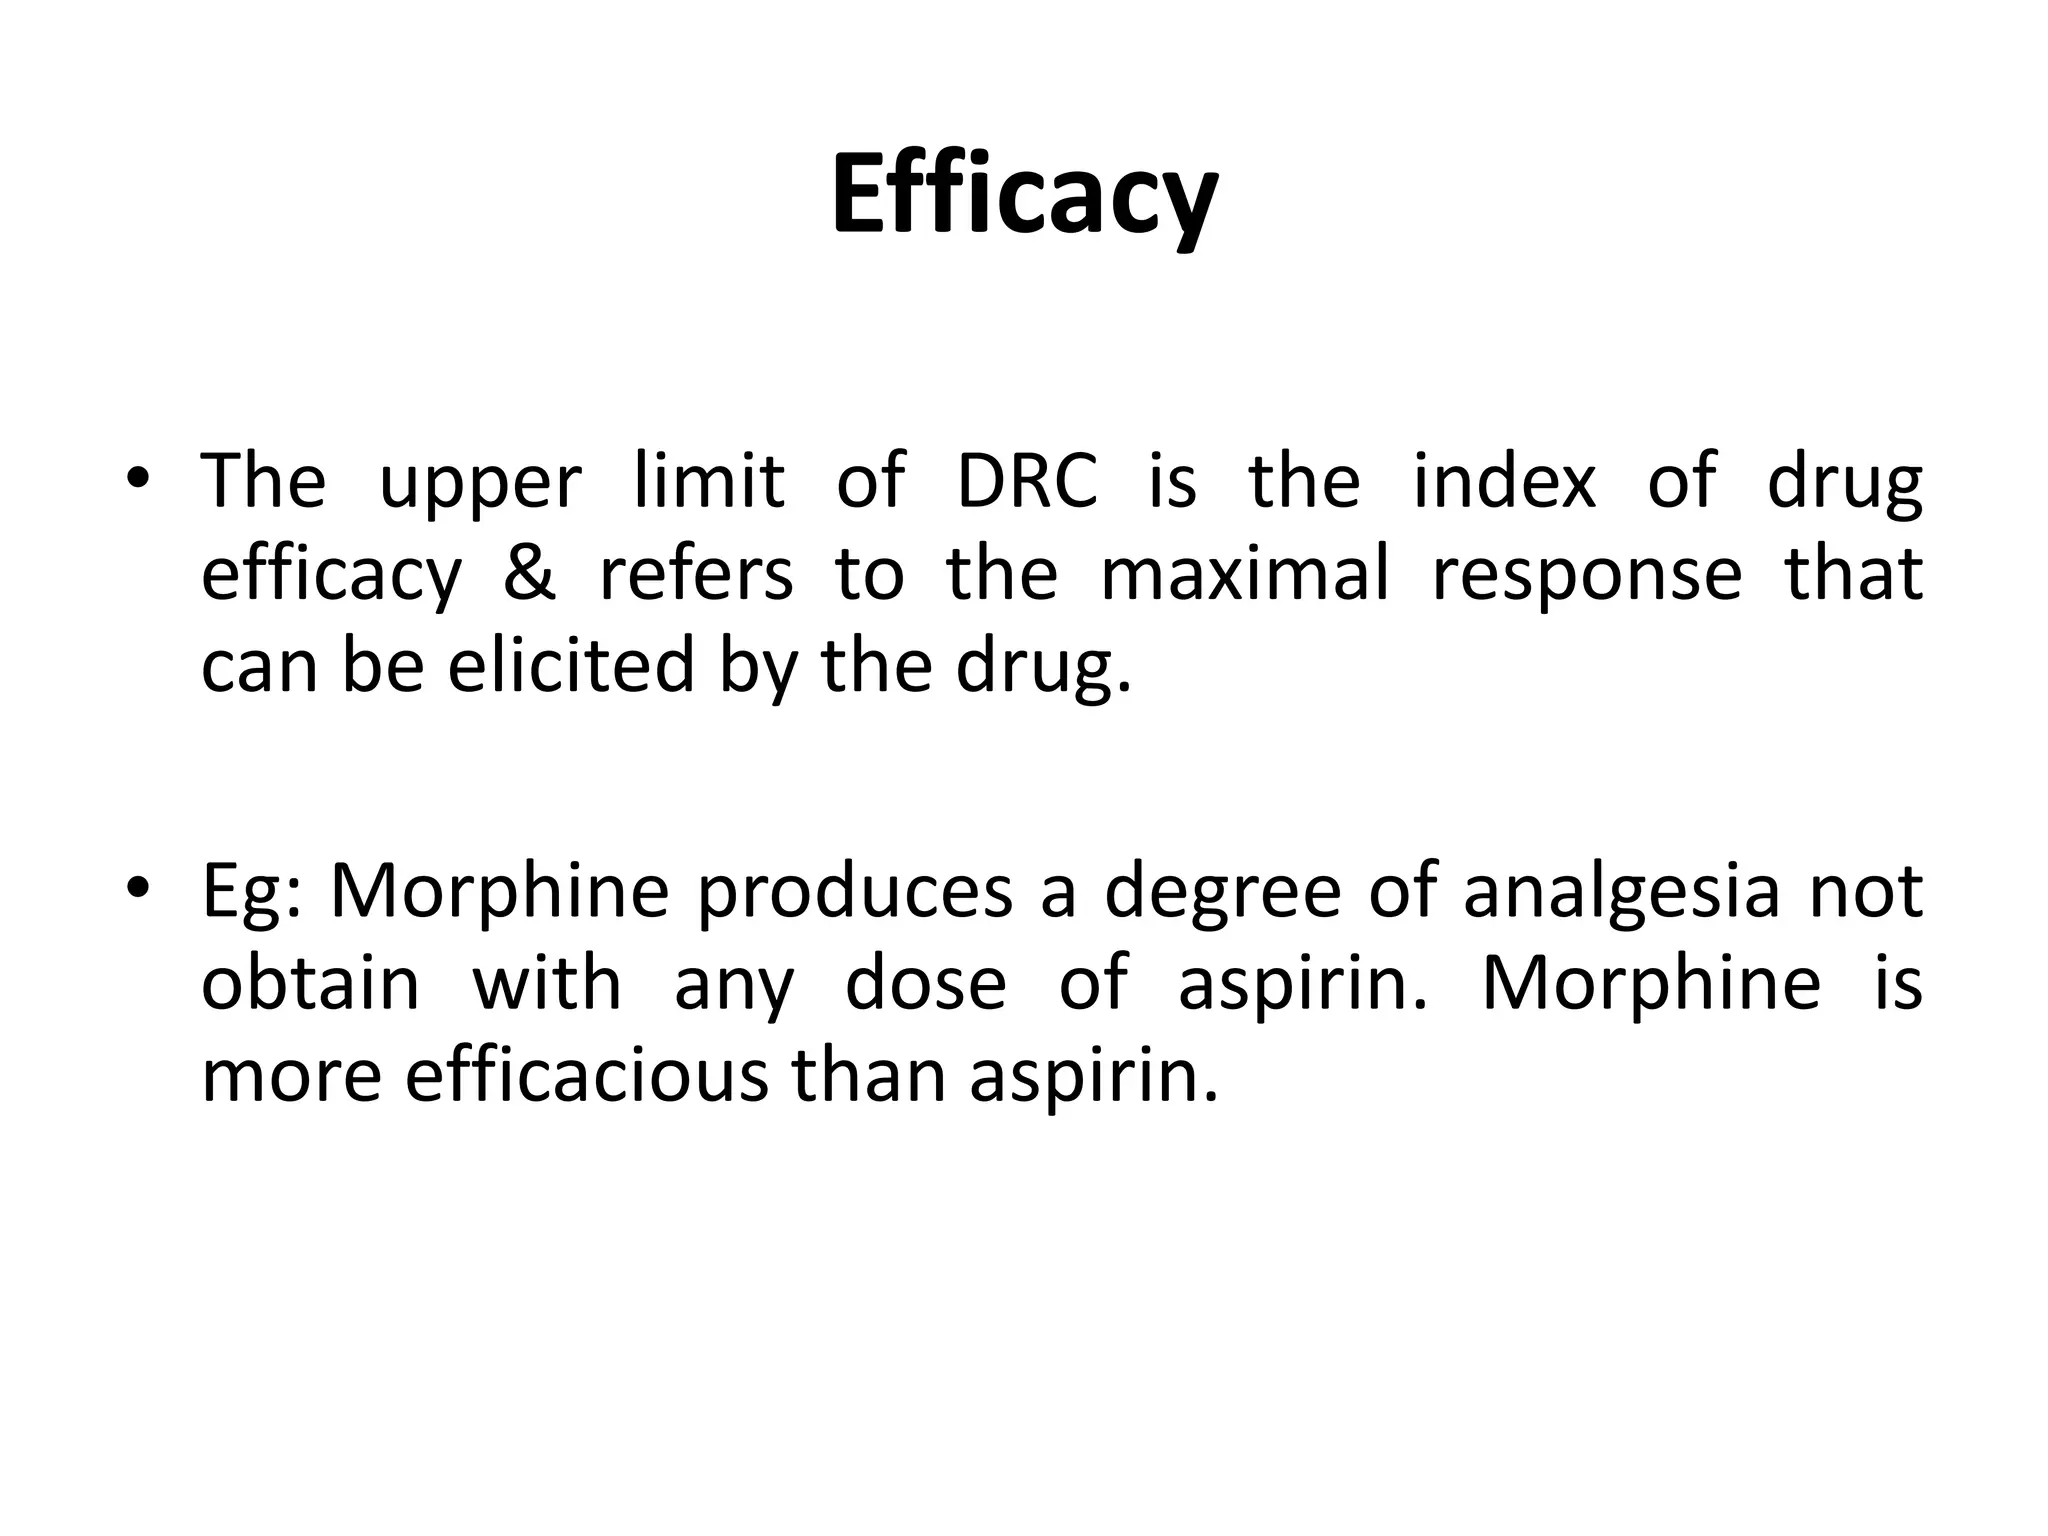
Discussion on drug efficacy, showing that Morphine offers more analgesia than Aspirin.
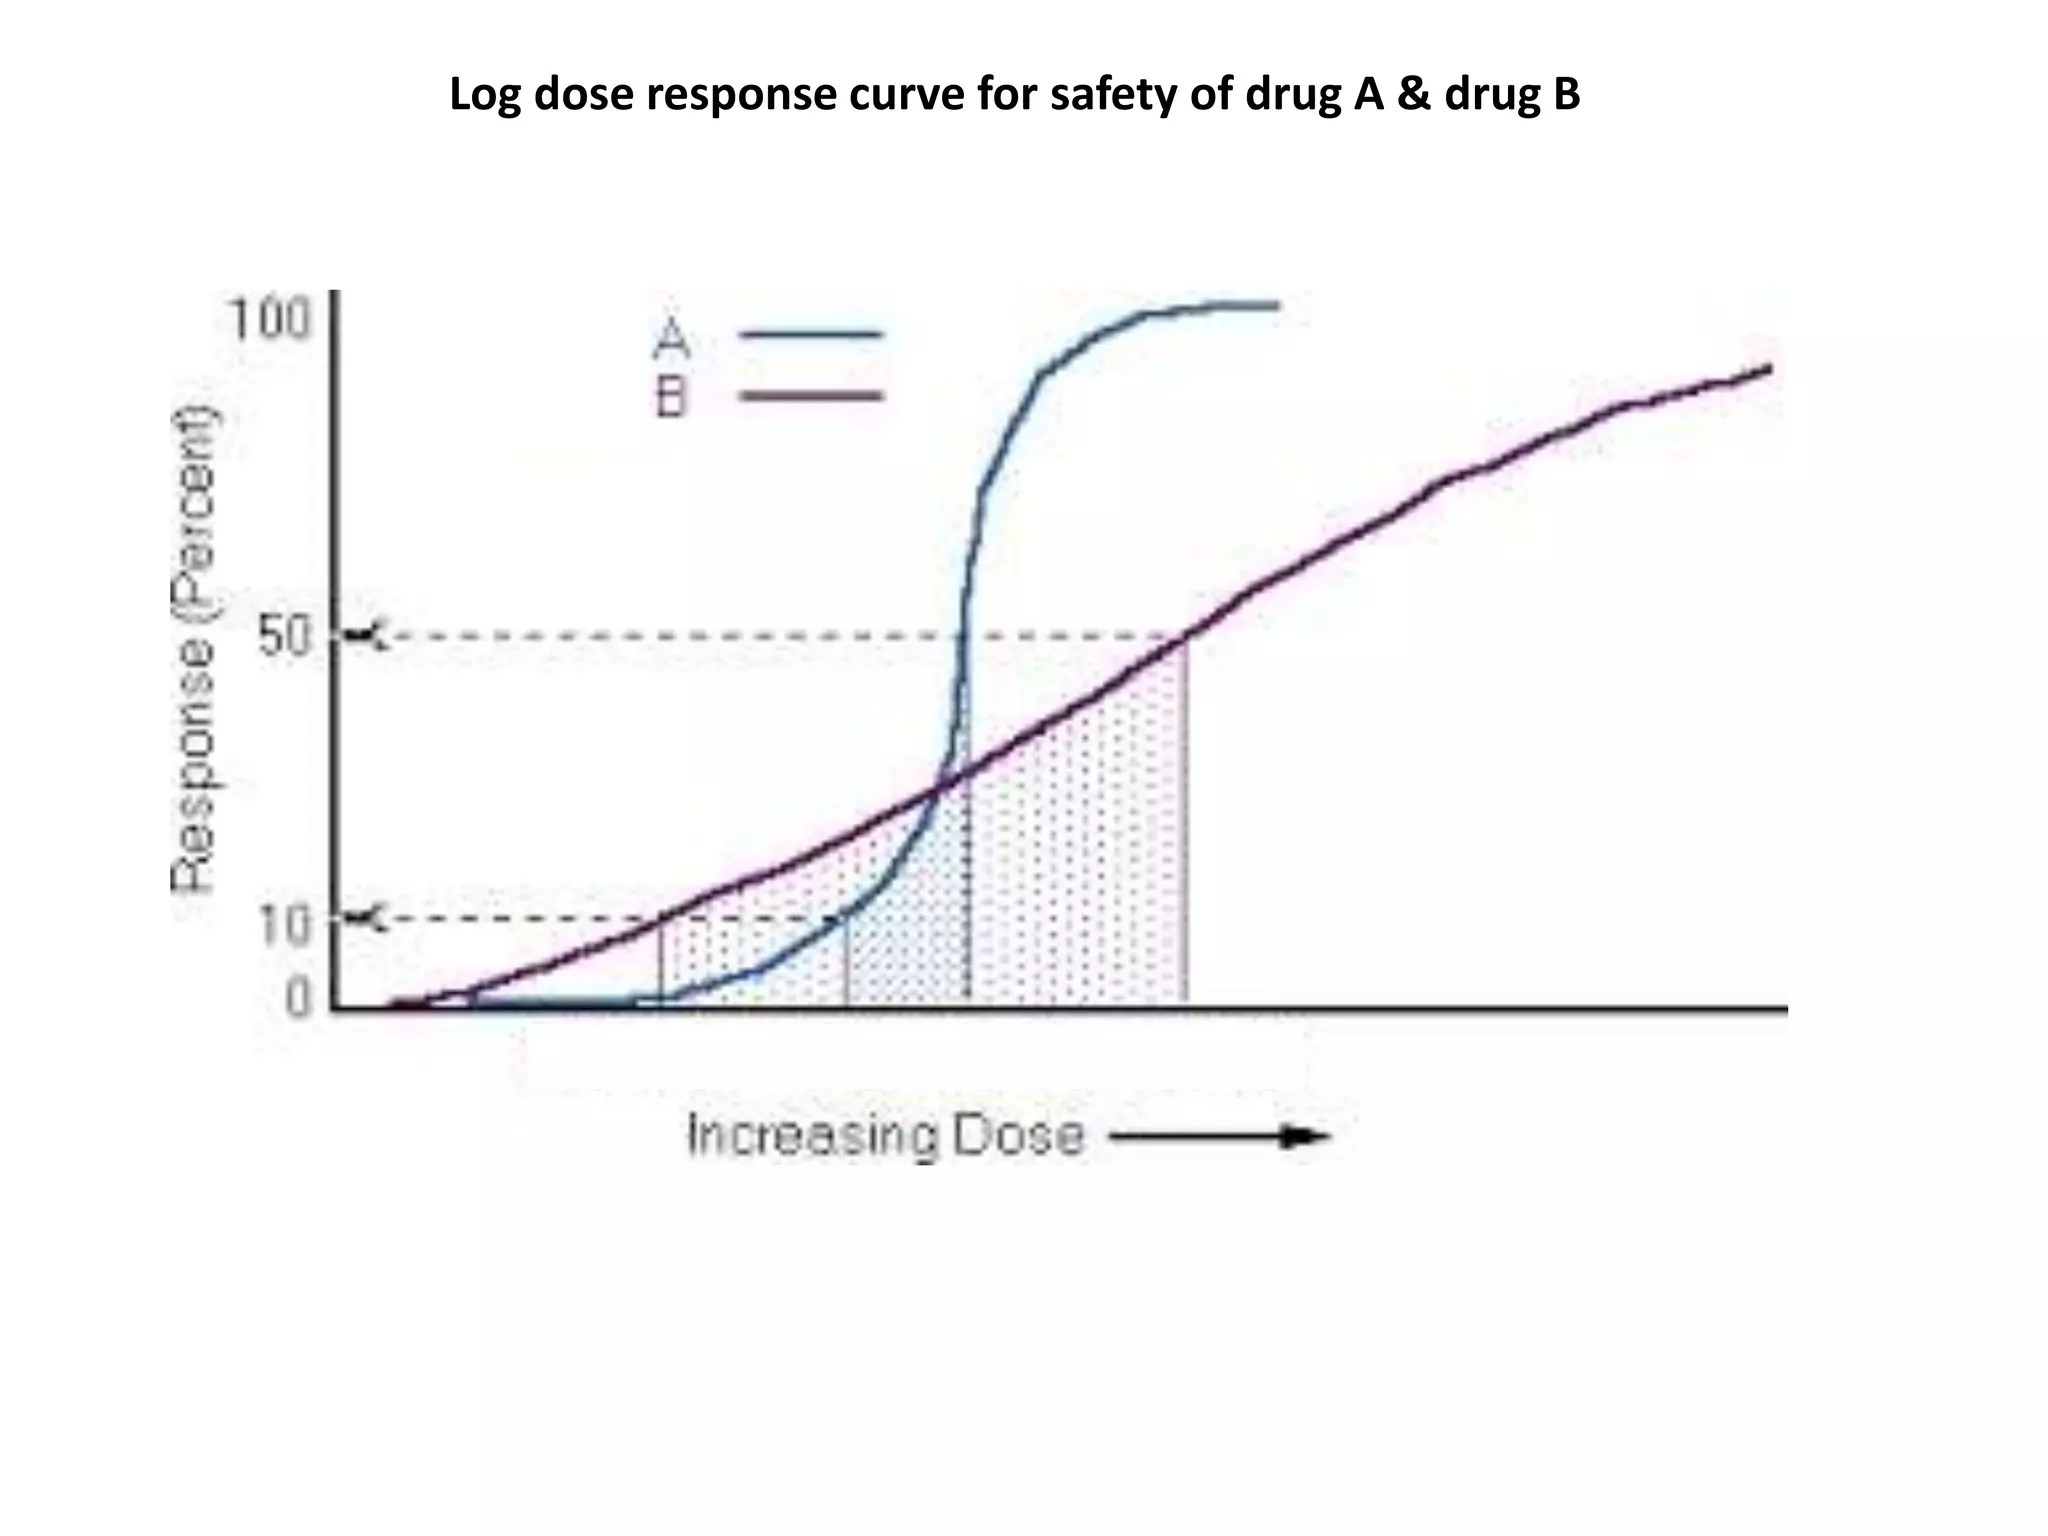
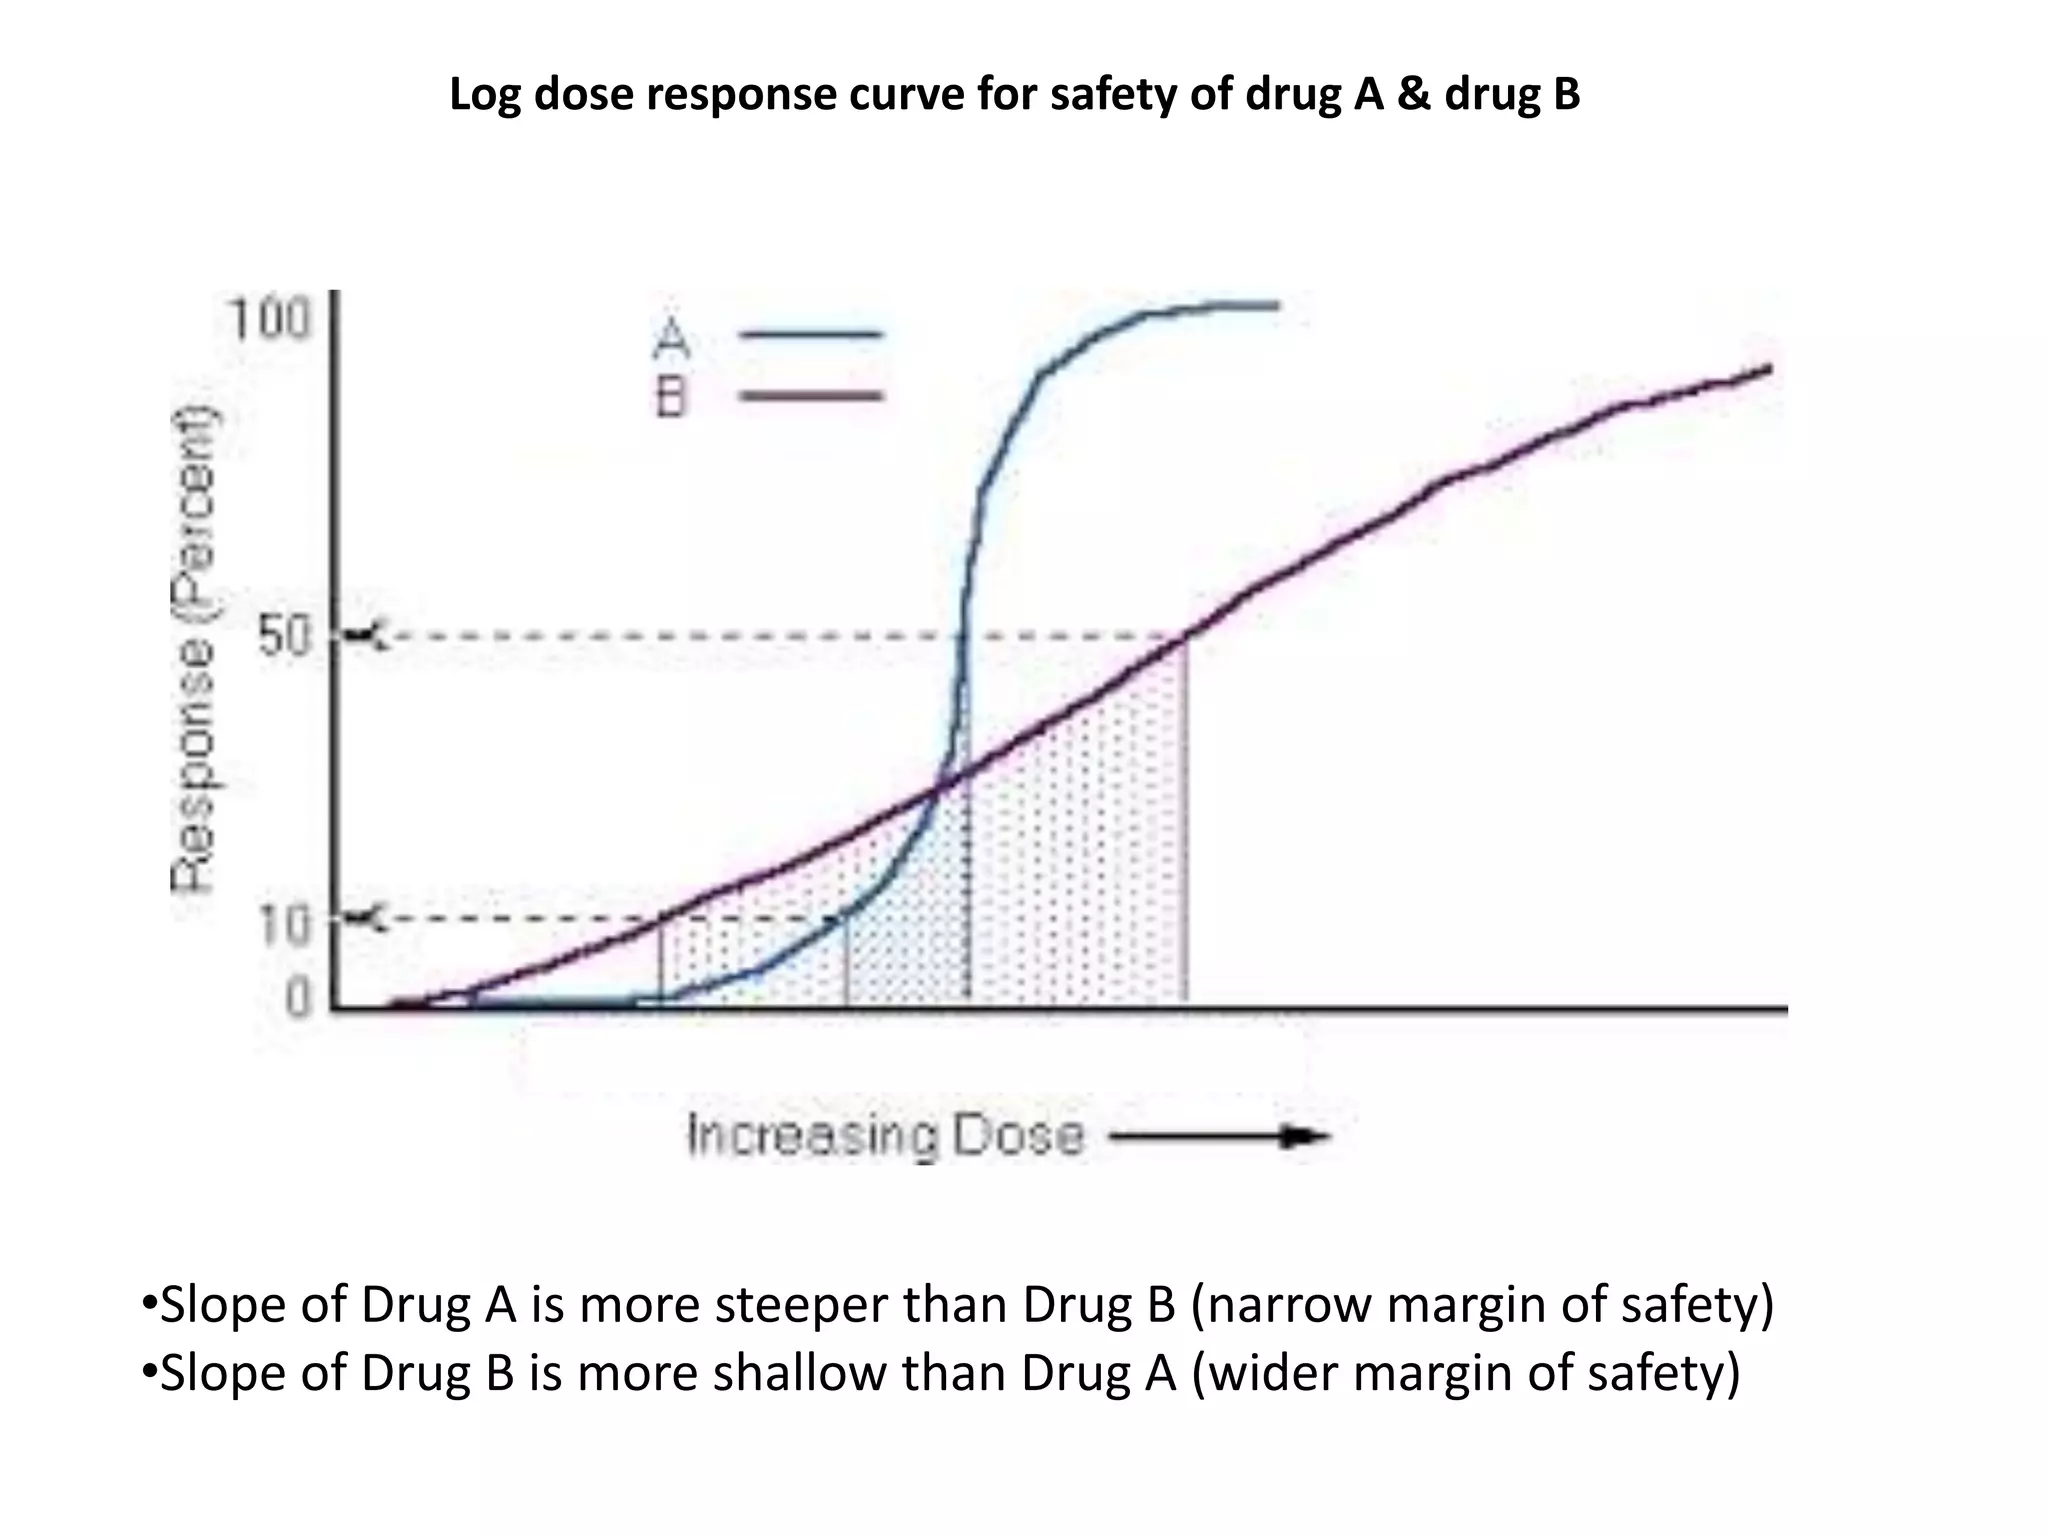
Slope of DRC in assessing drug safety and implications of steep vs. shallow slopes.
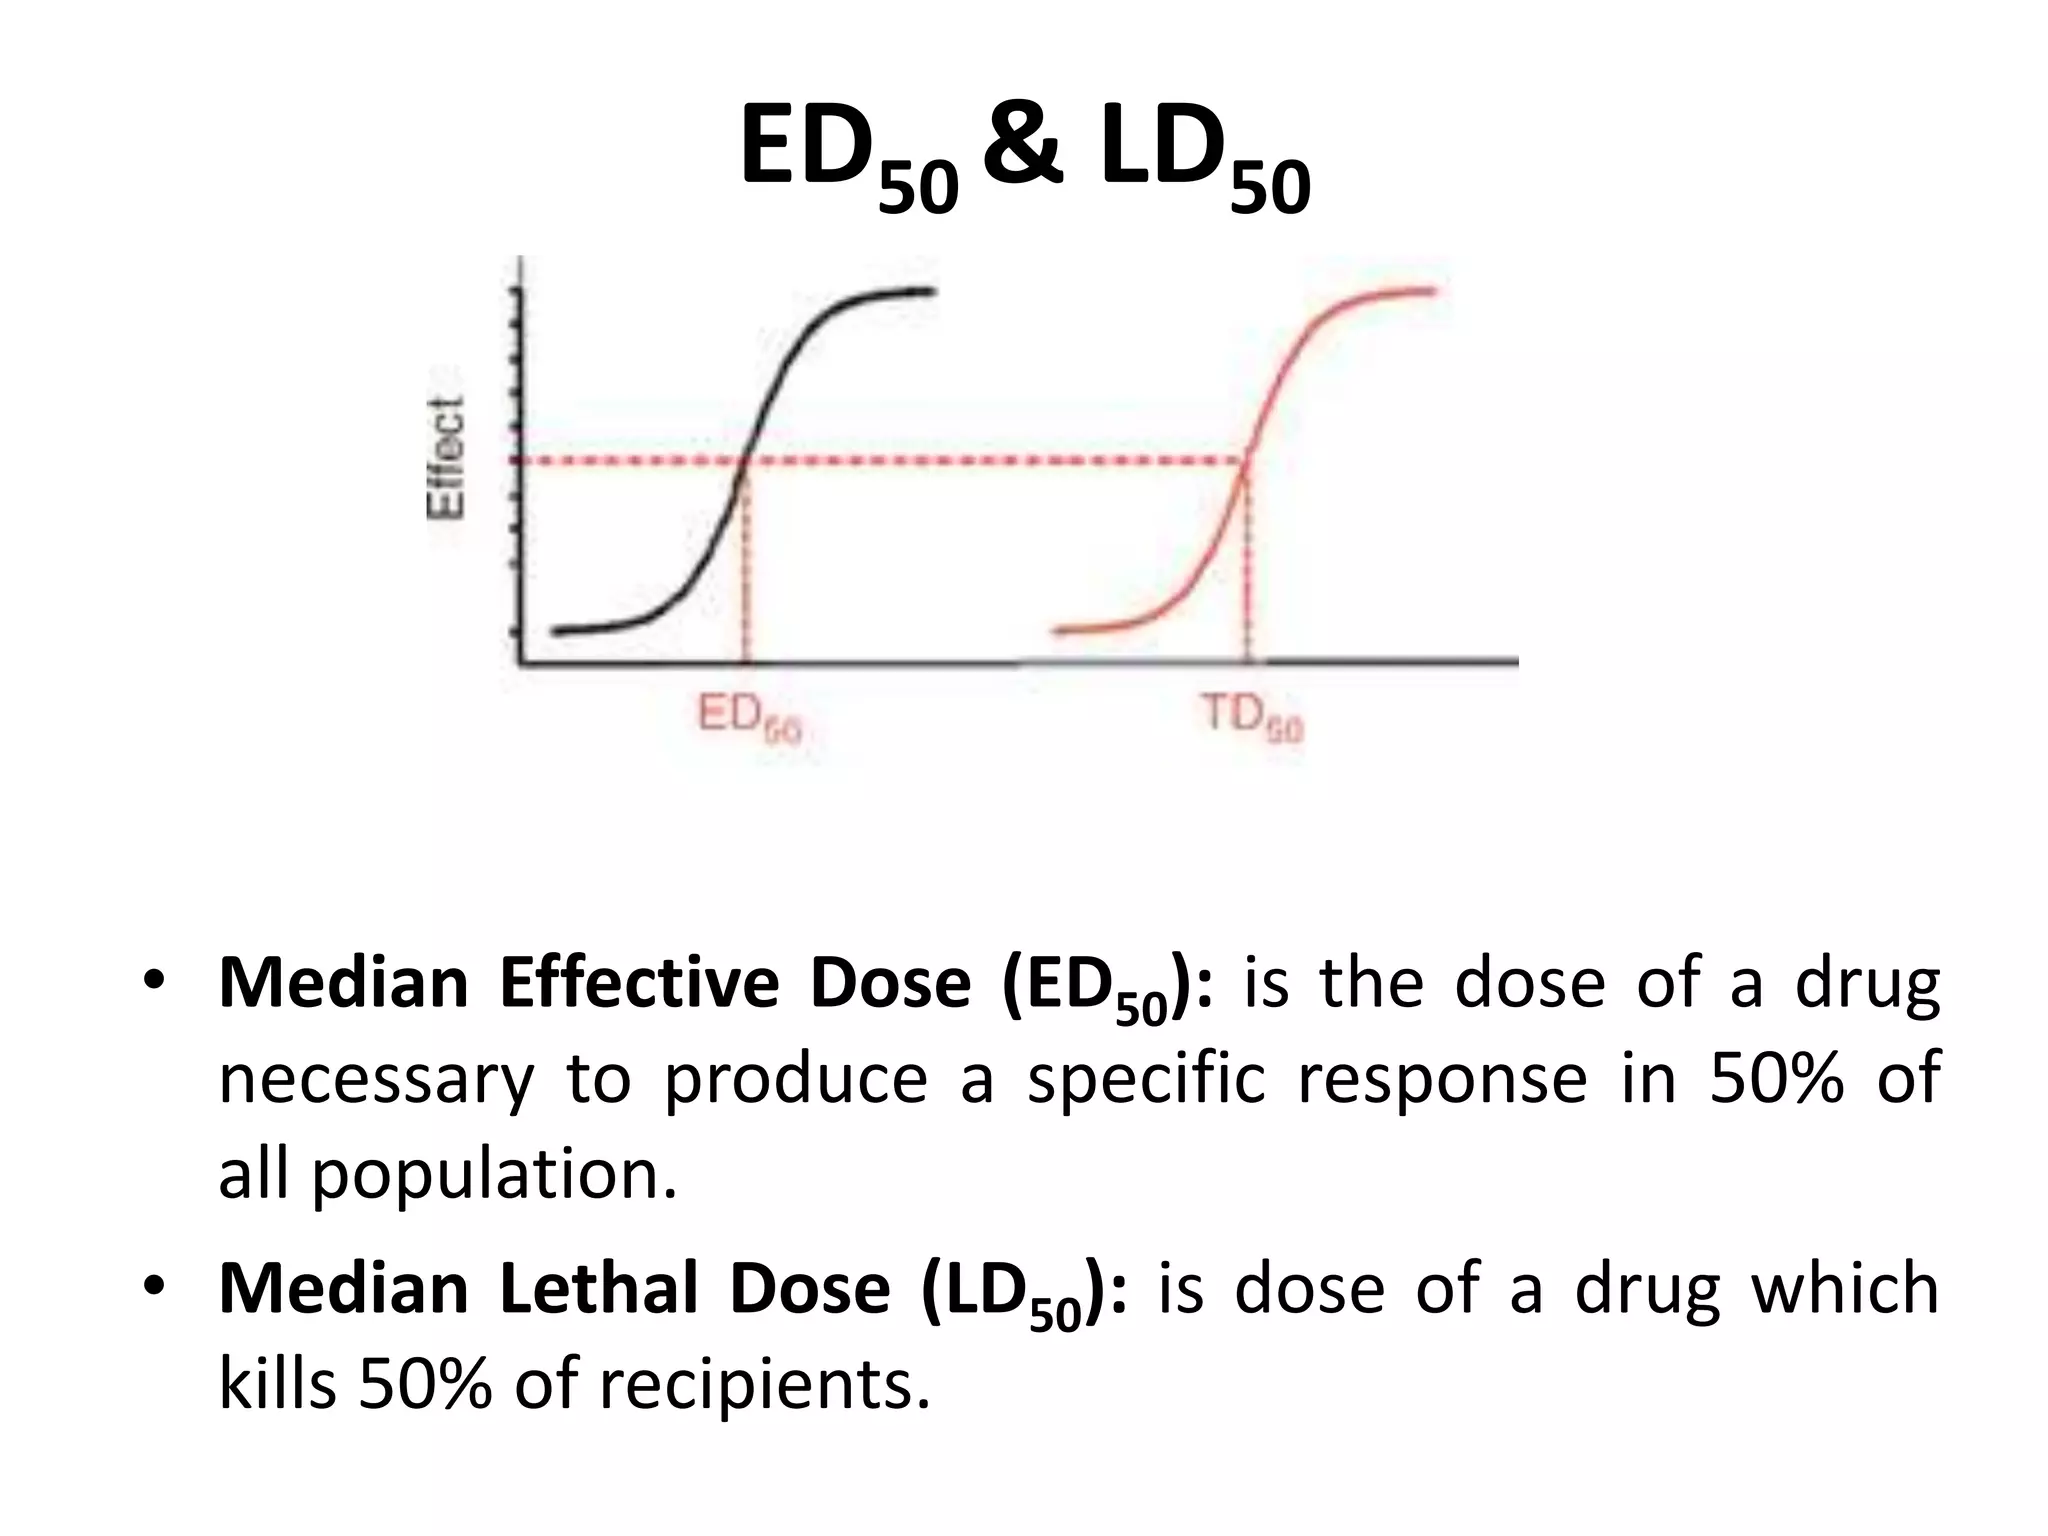
Definition of ED50 and LD50, their calculation and relevance in drug safety.
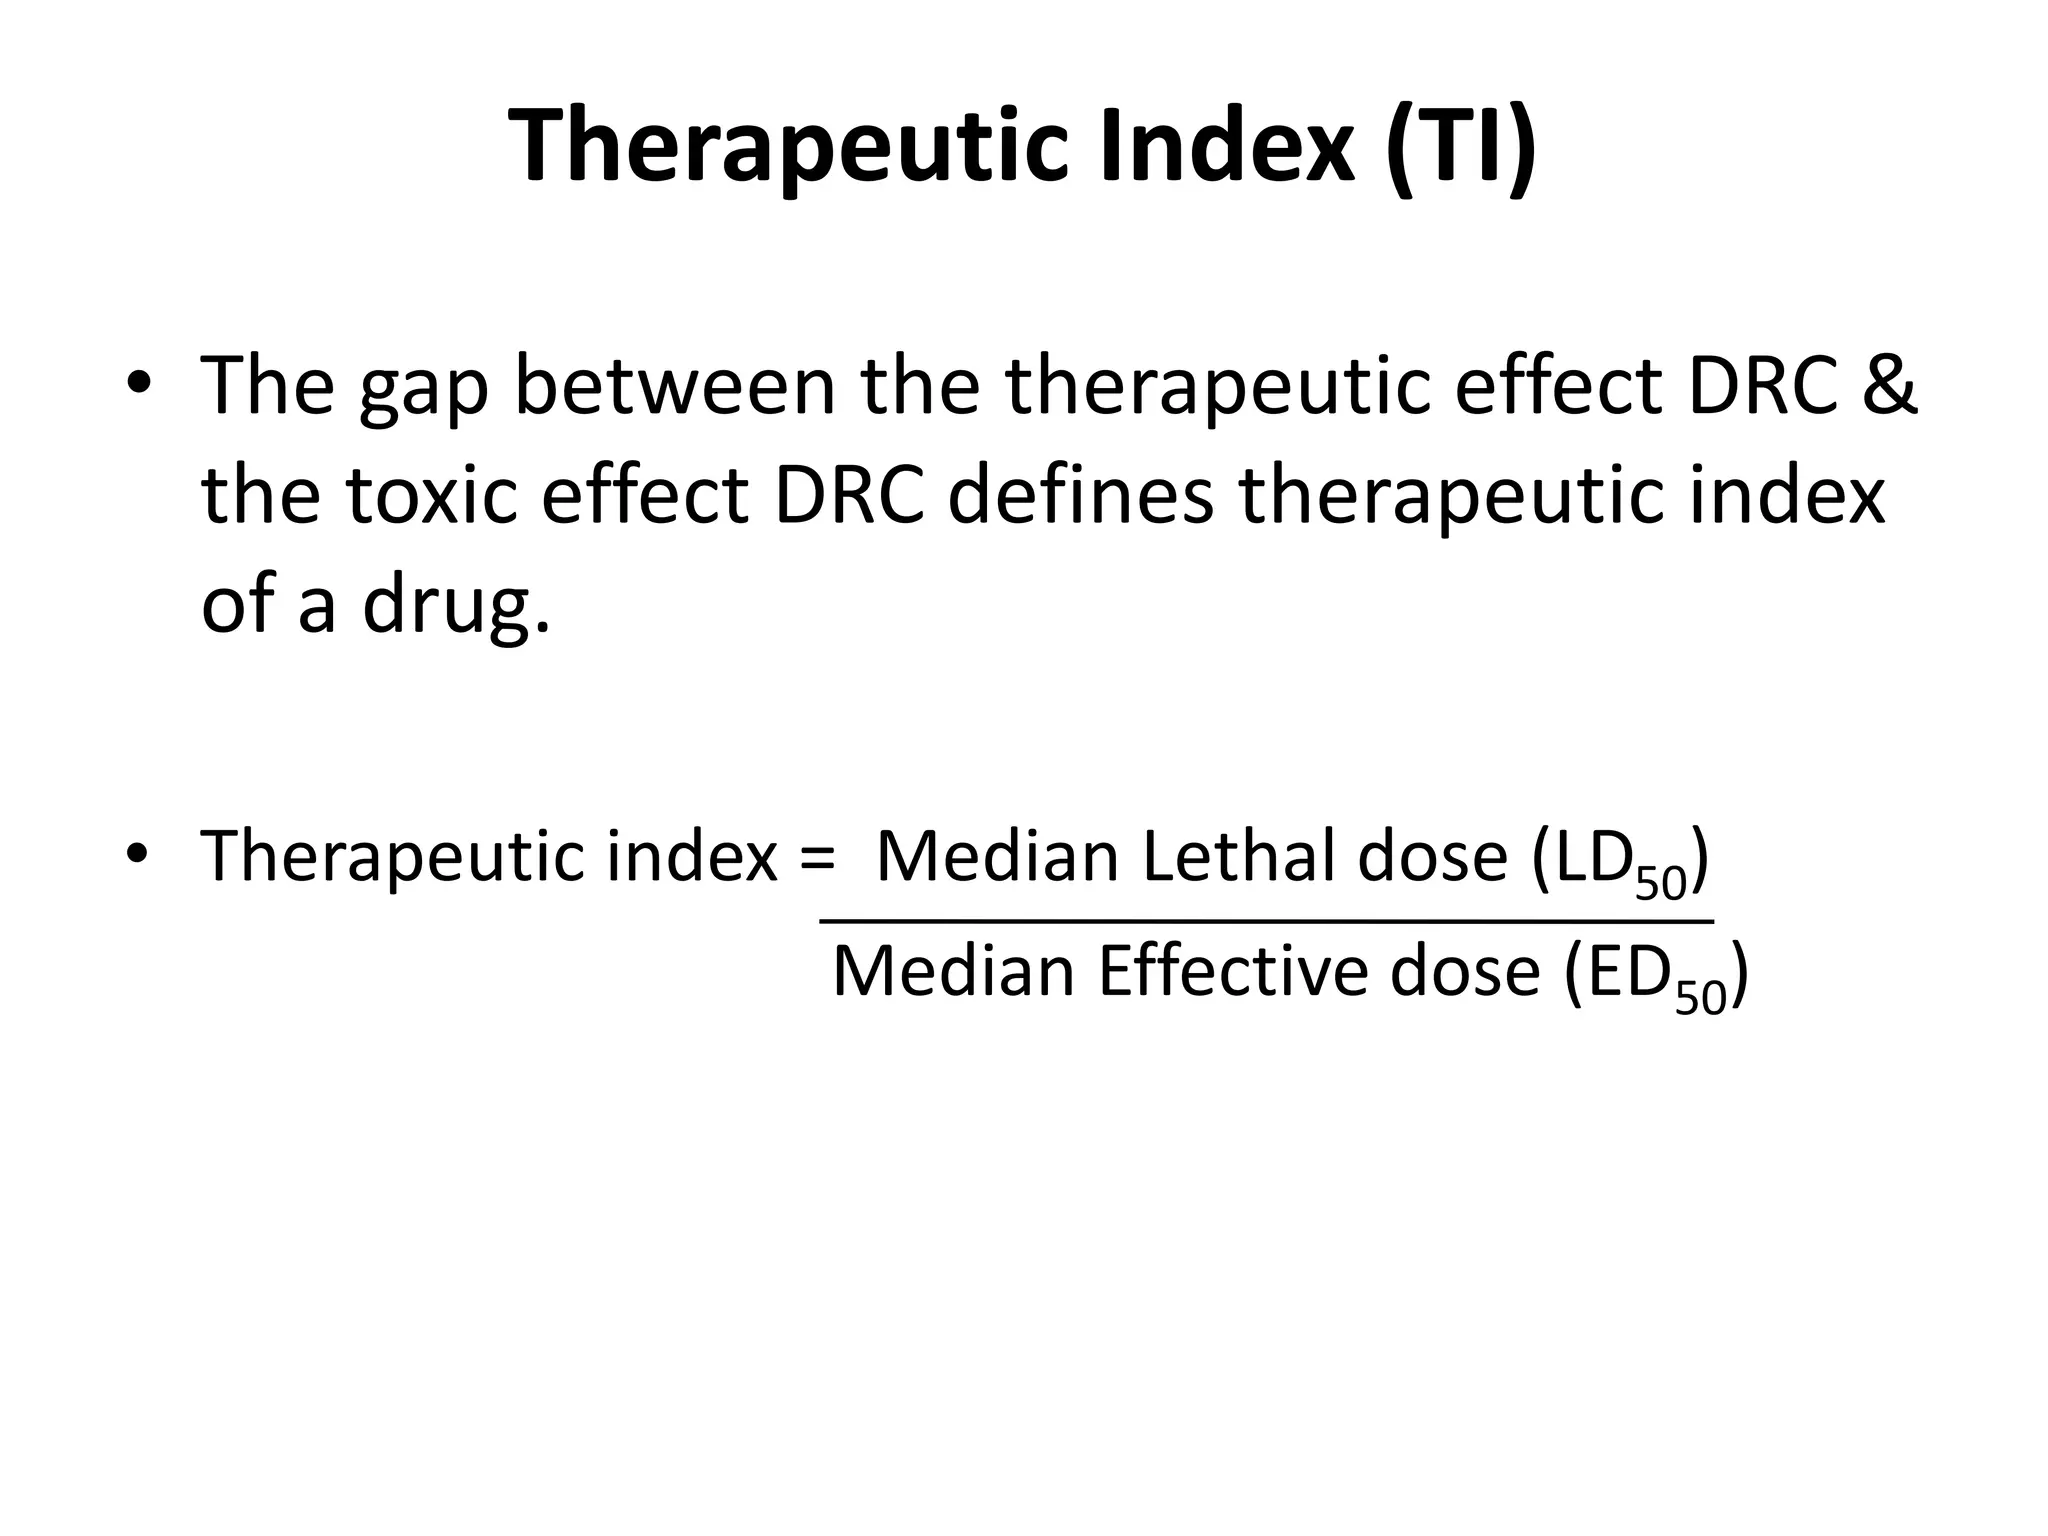
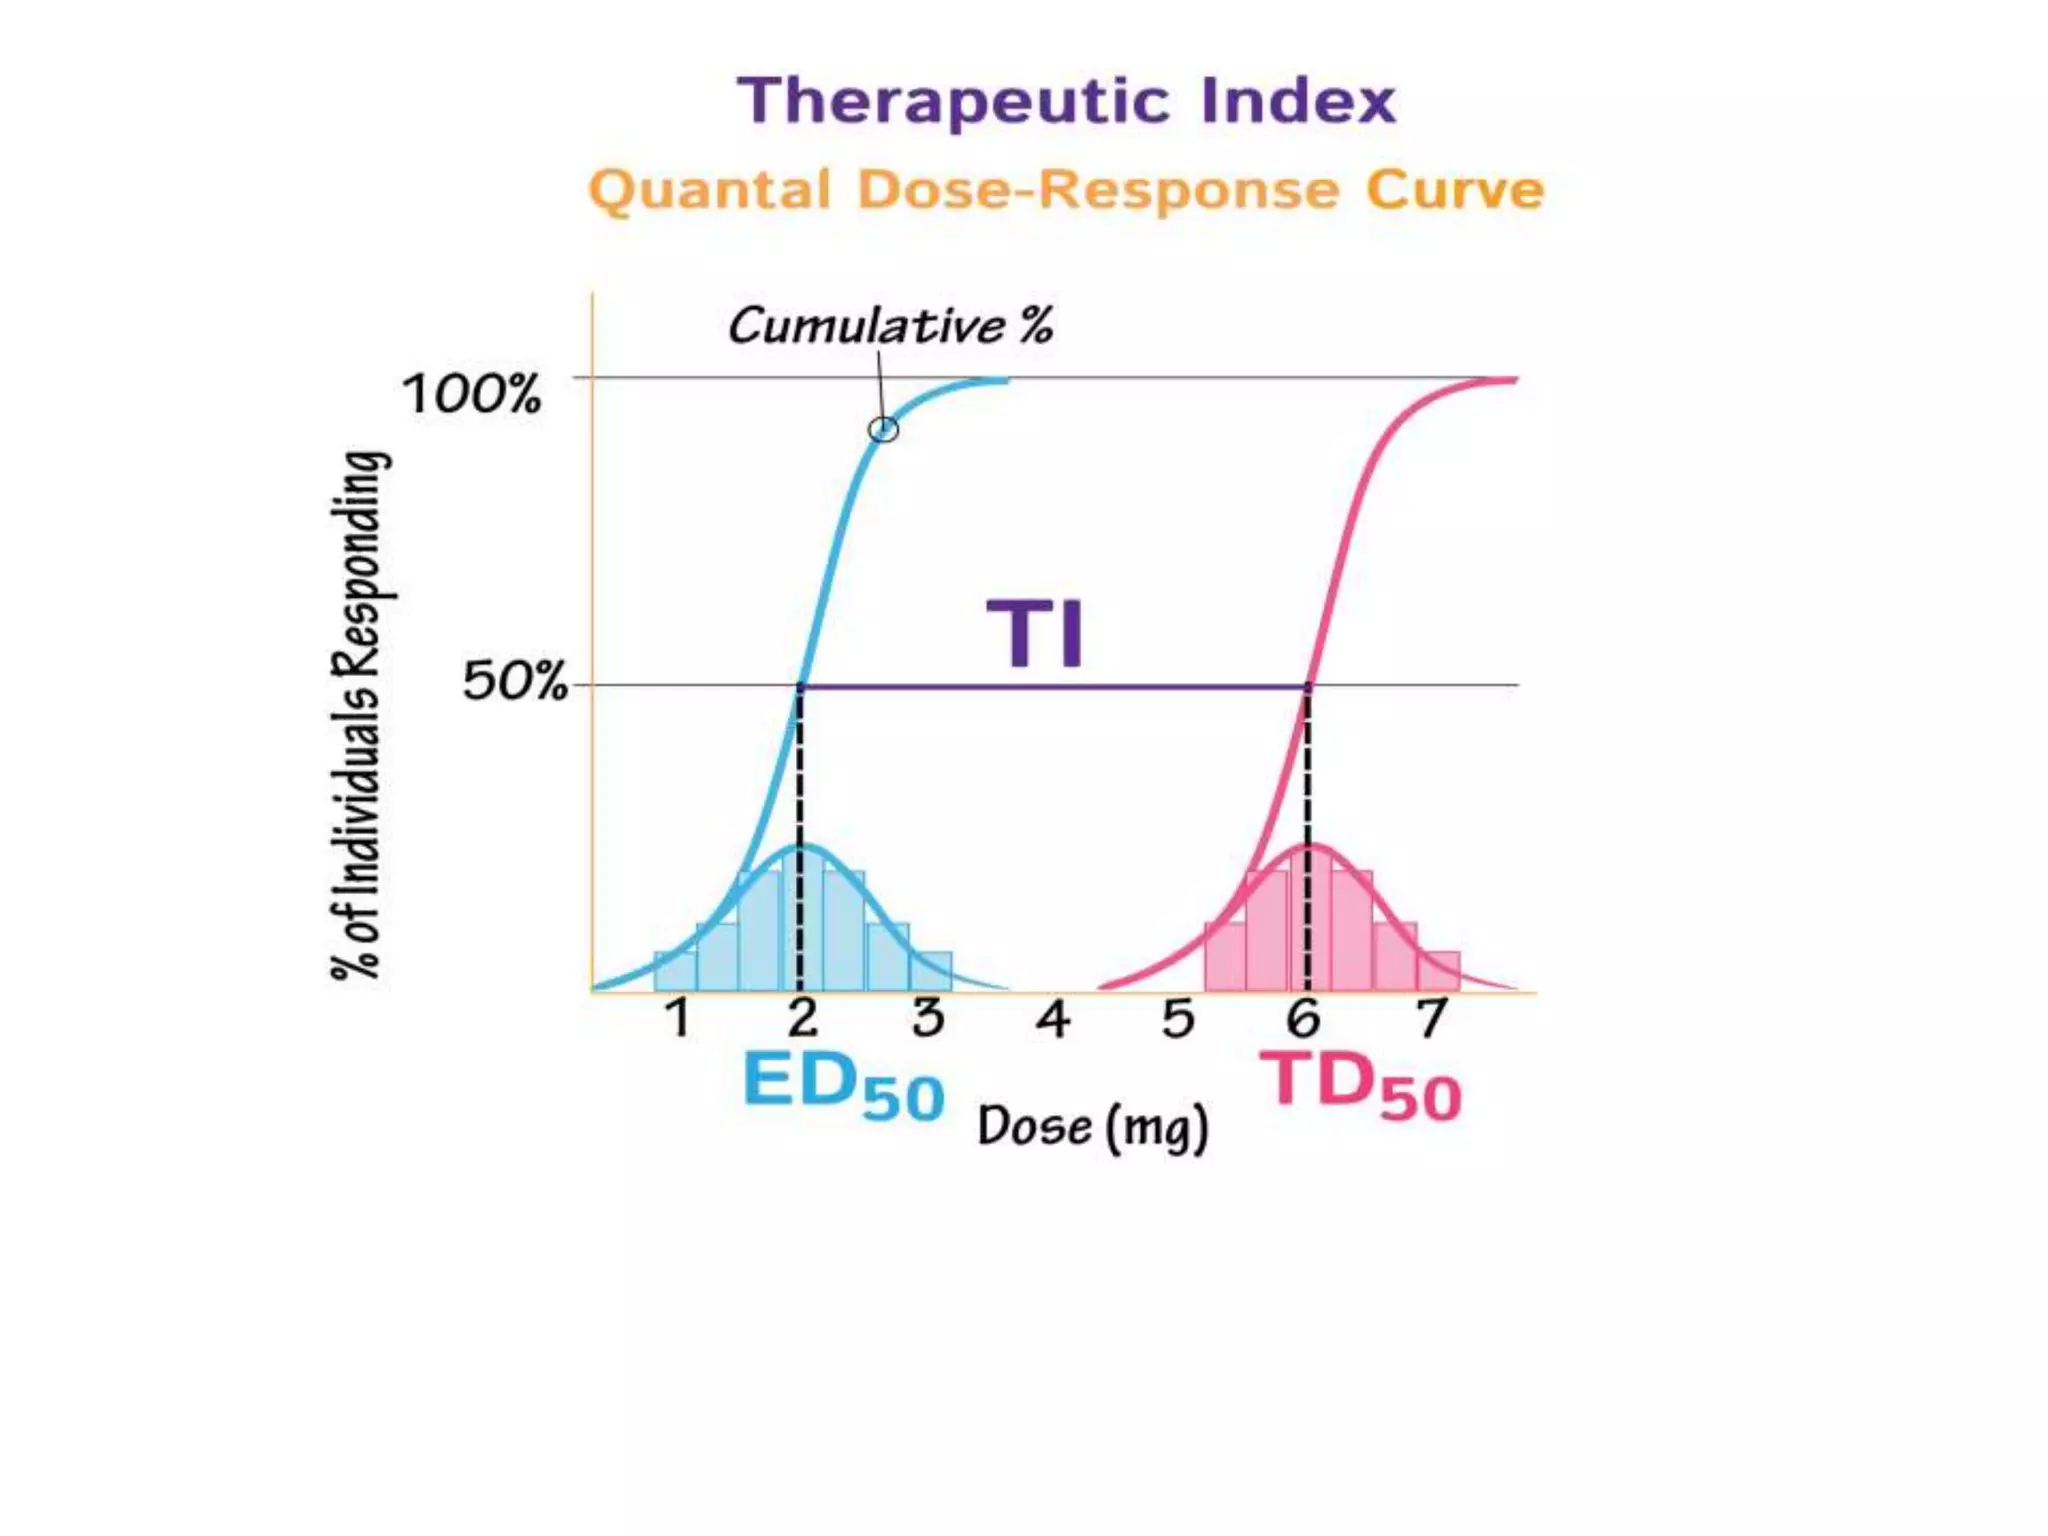
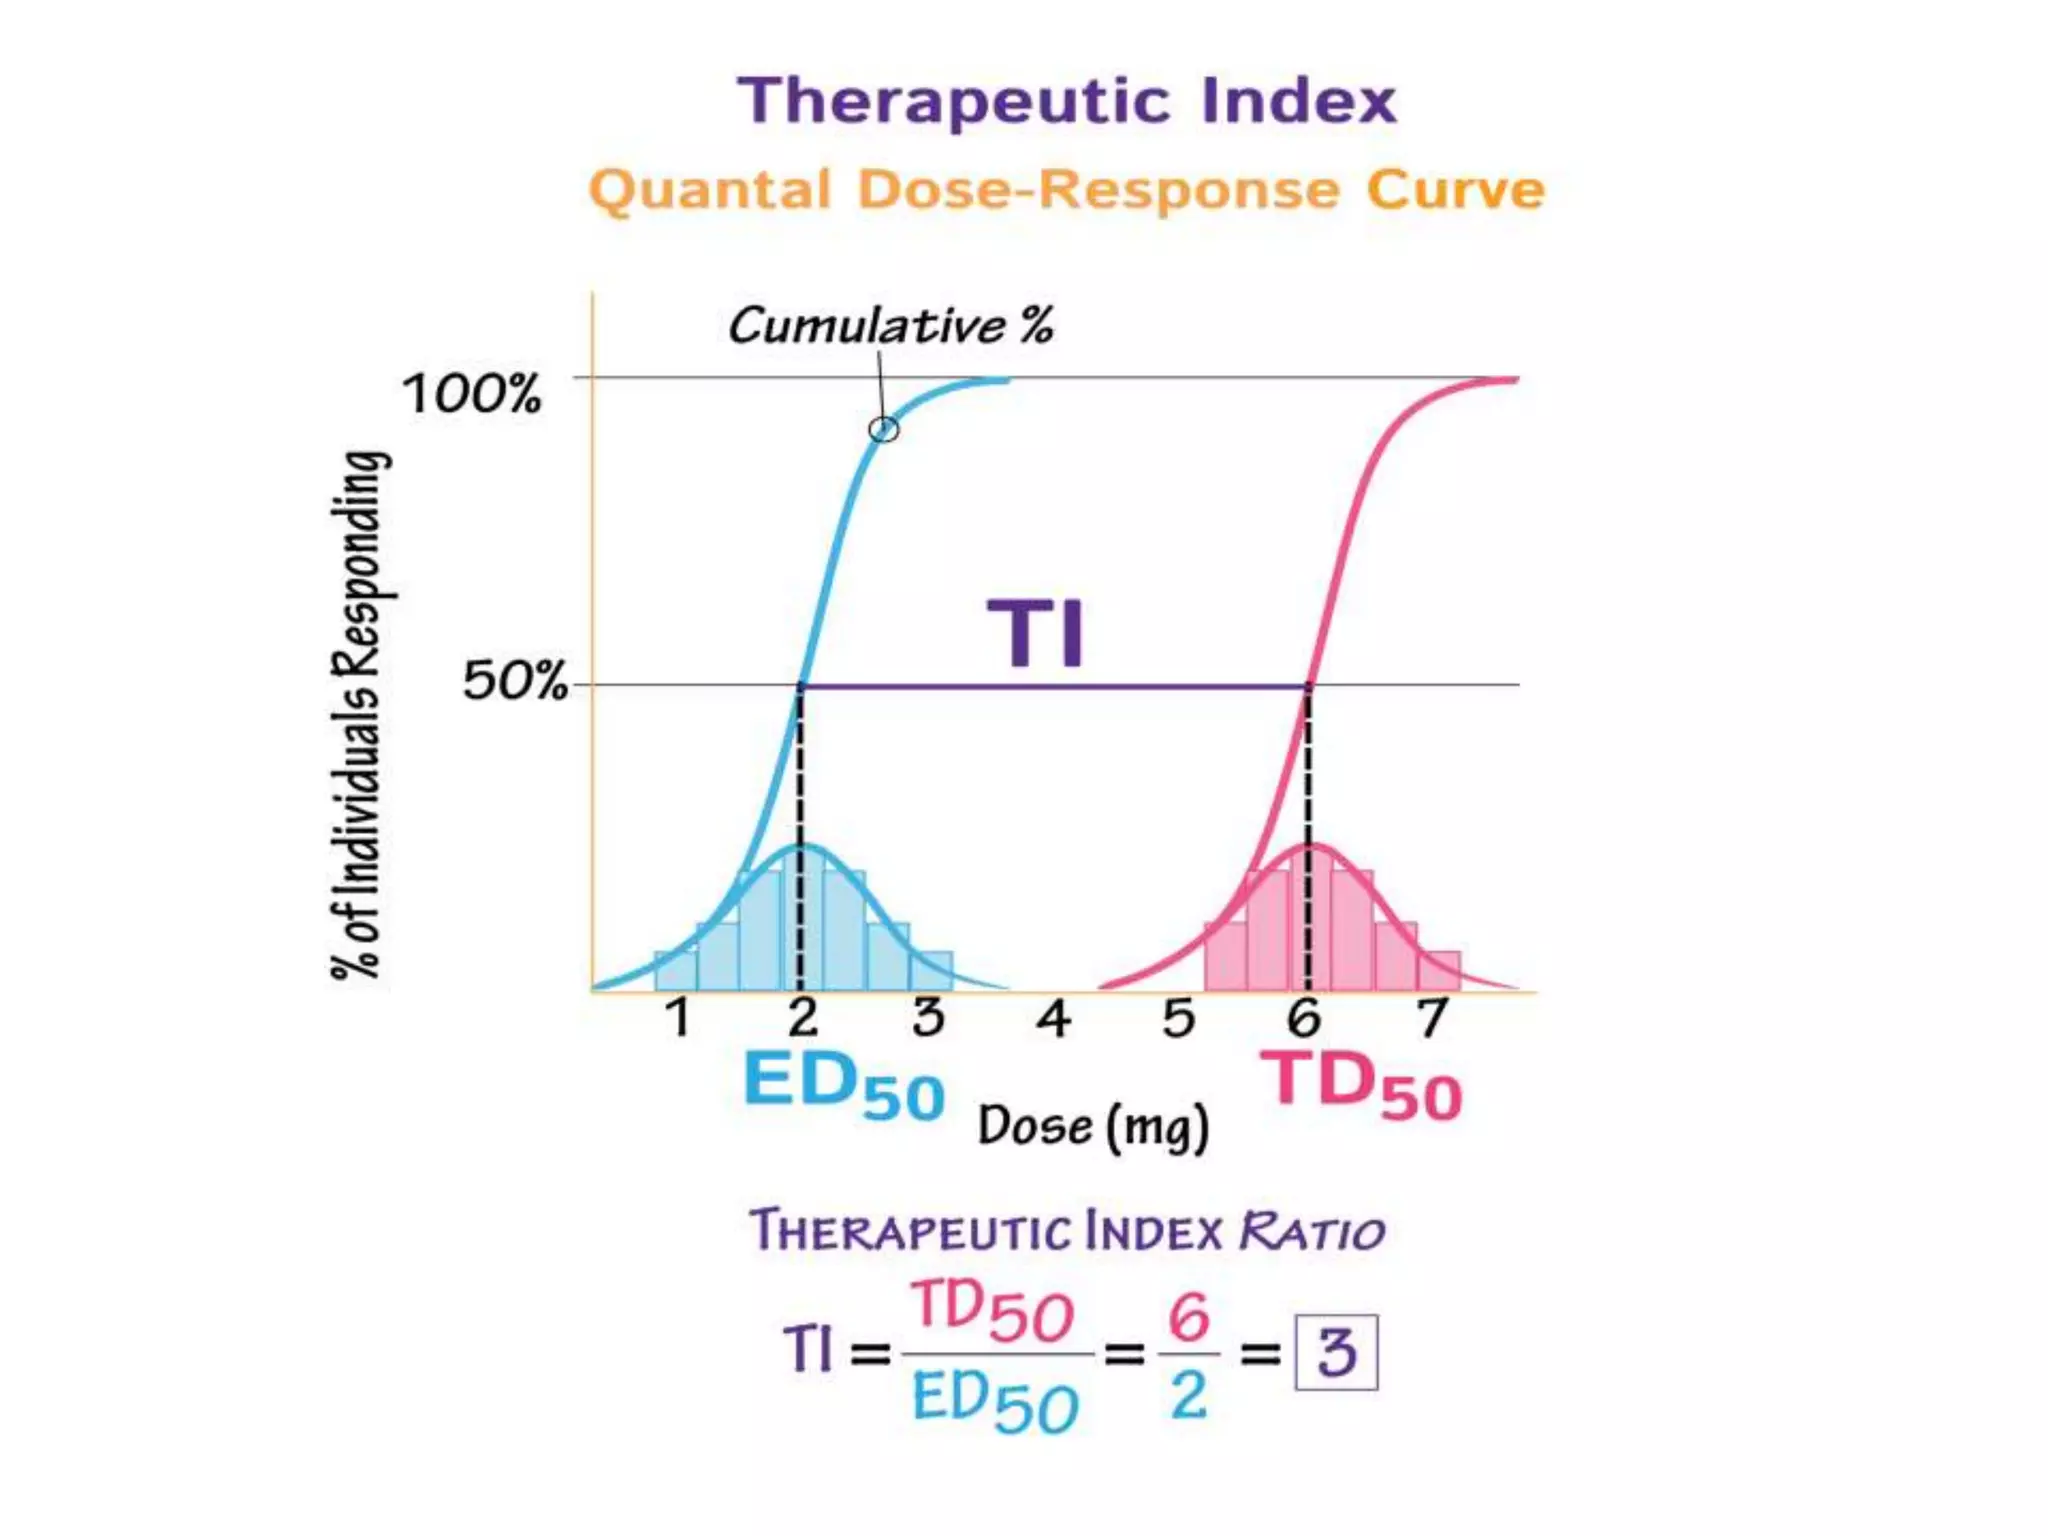
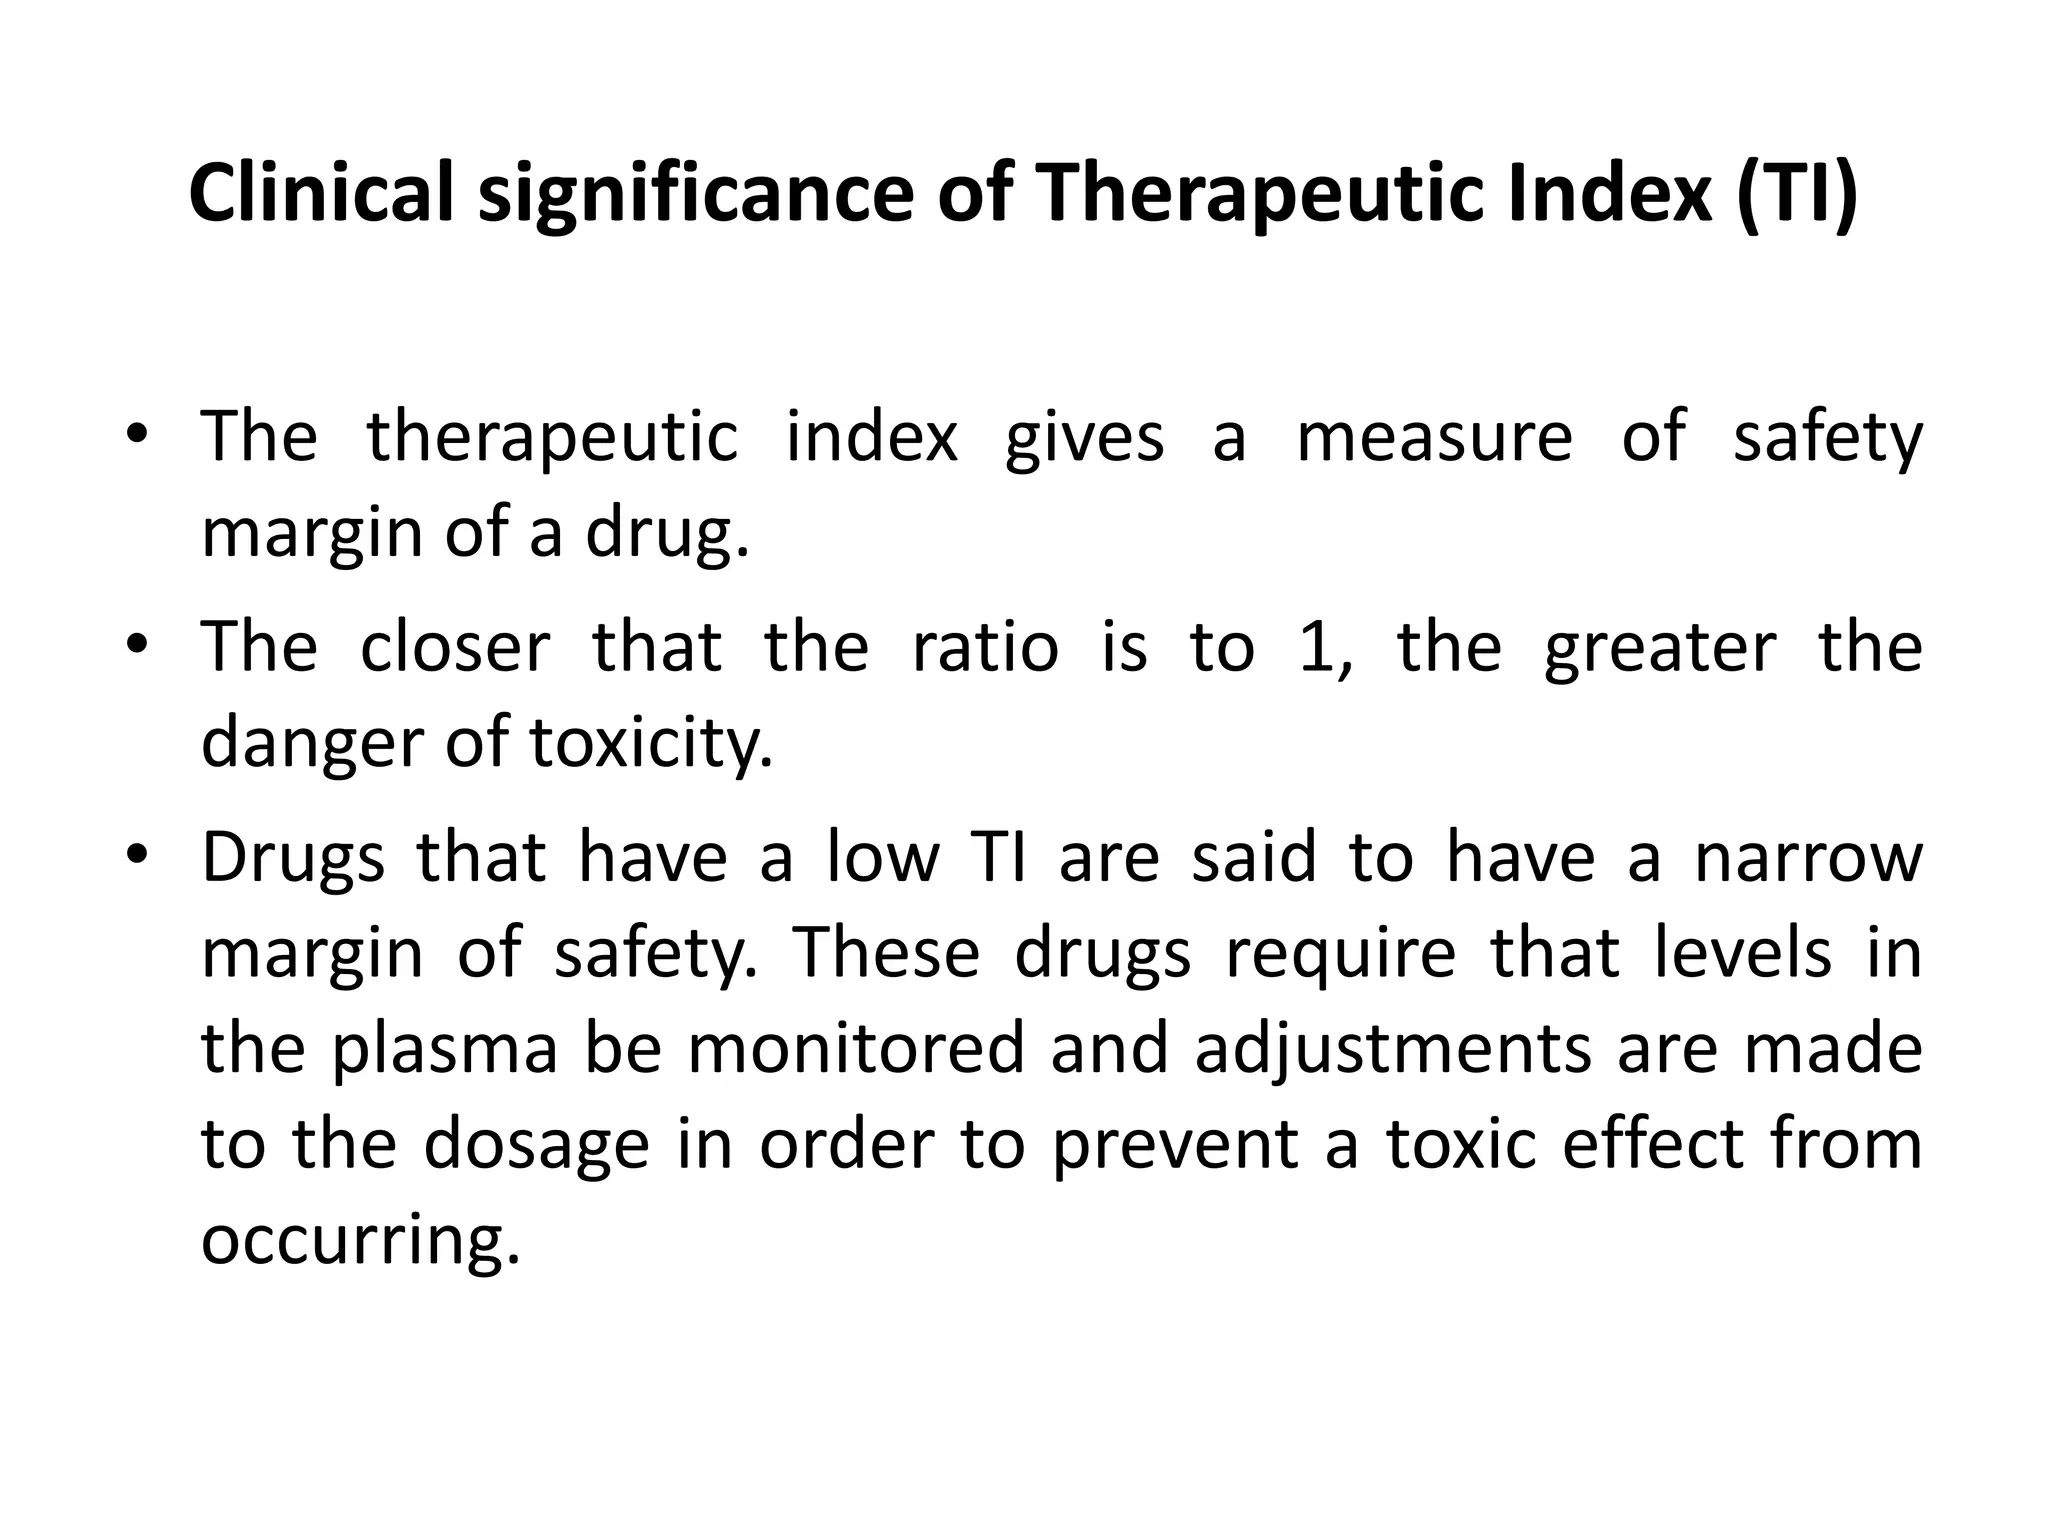
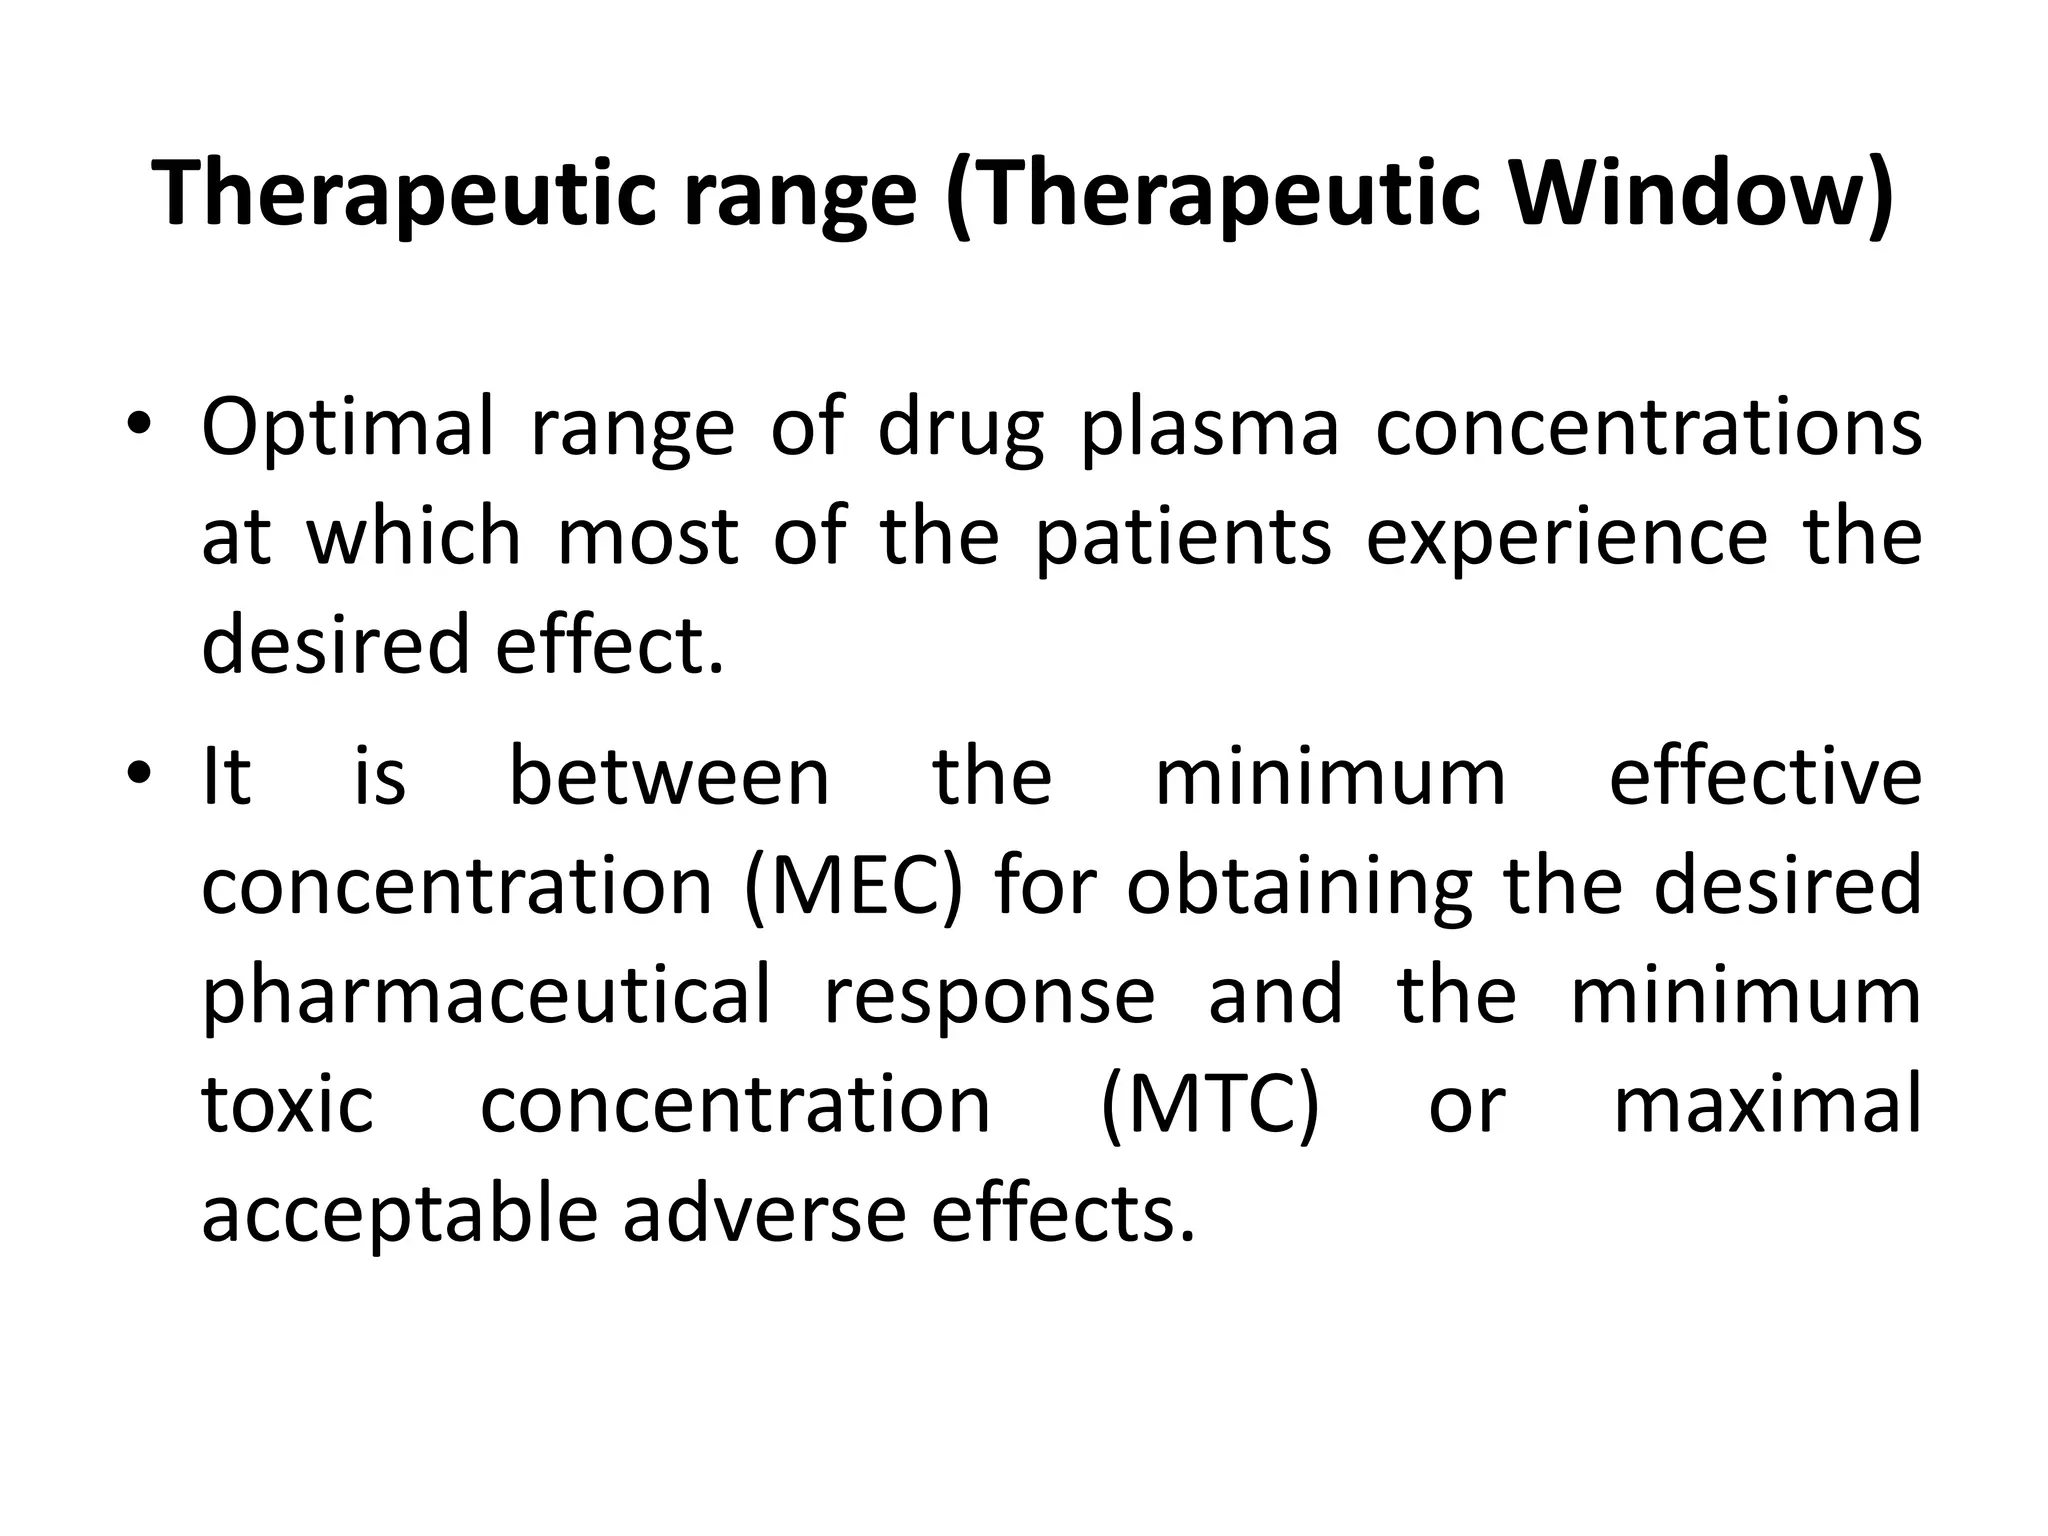
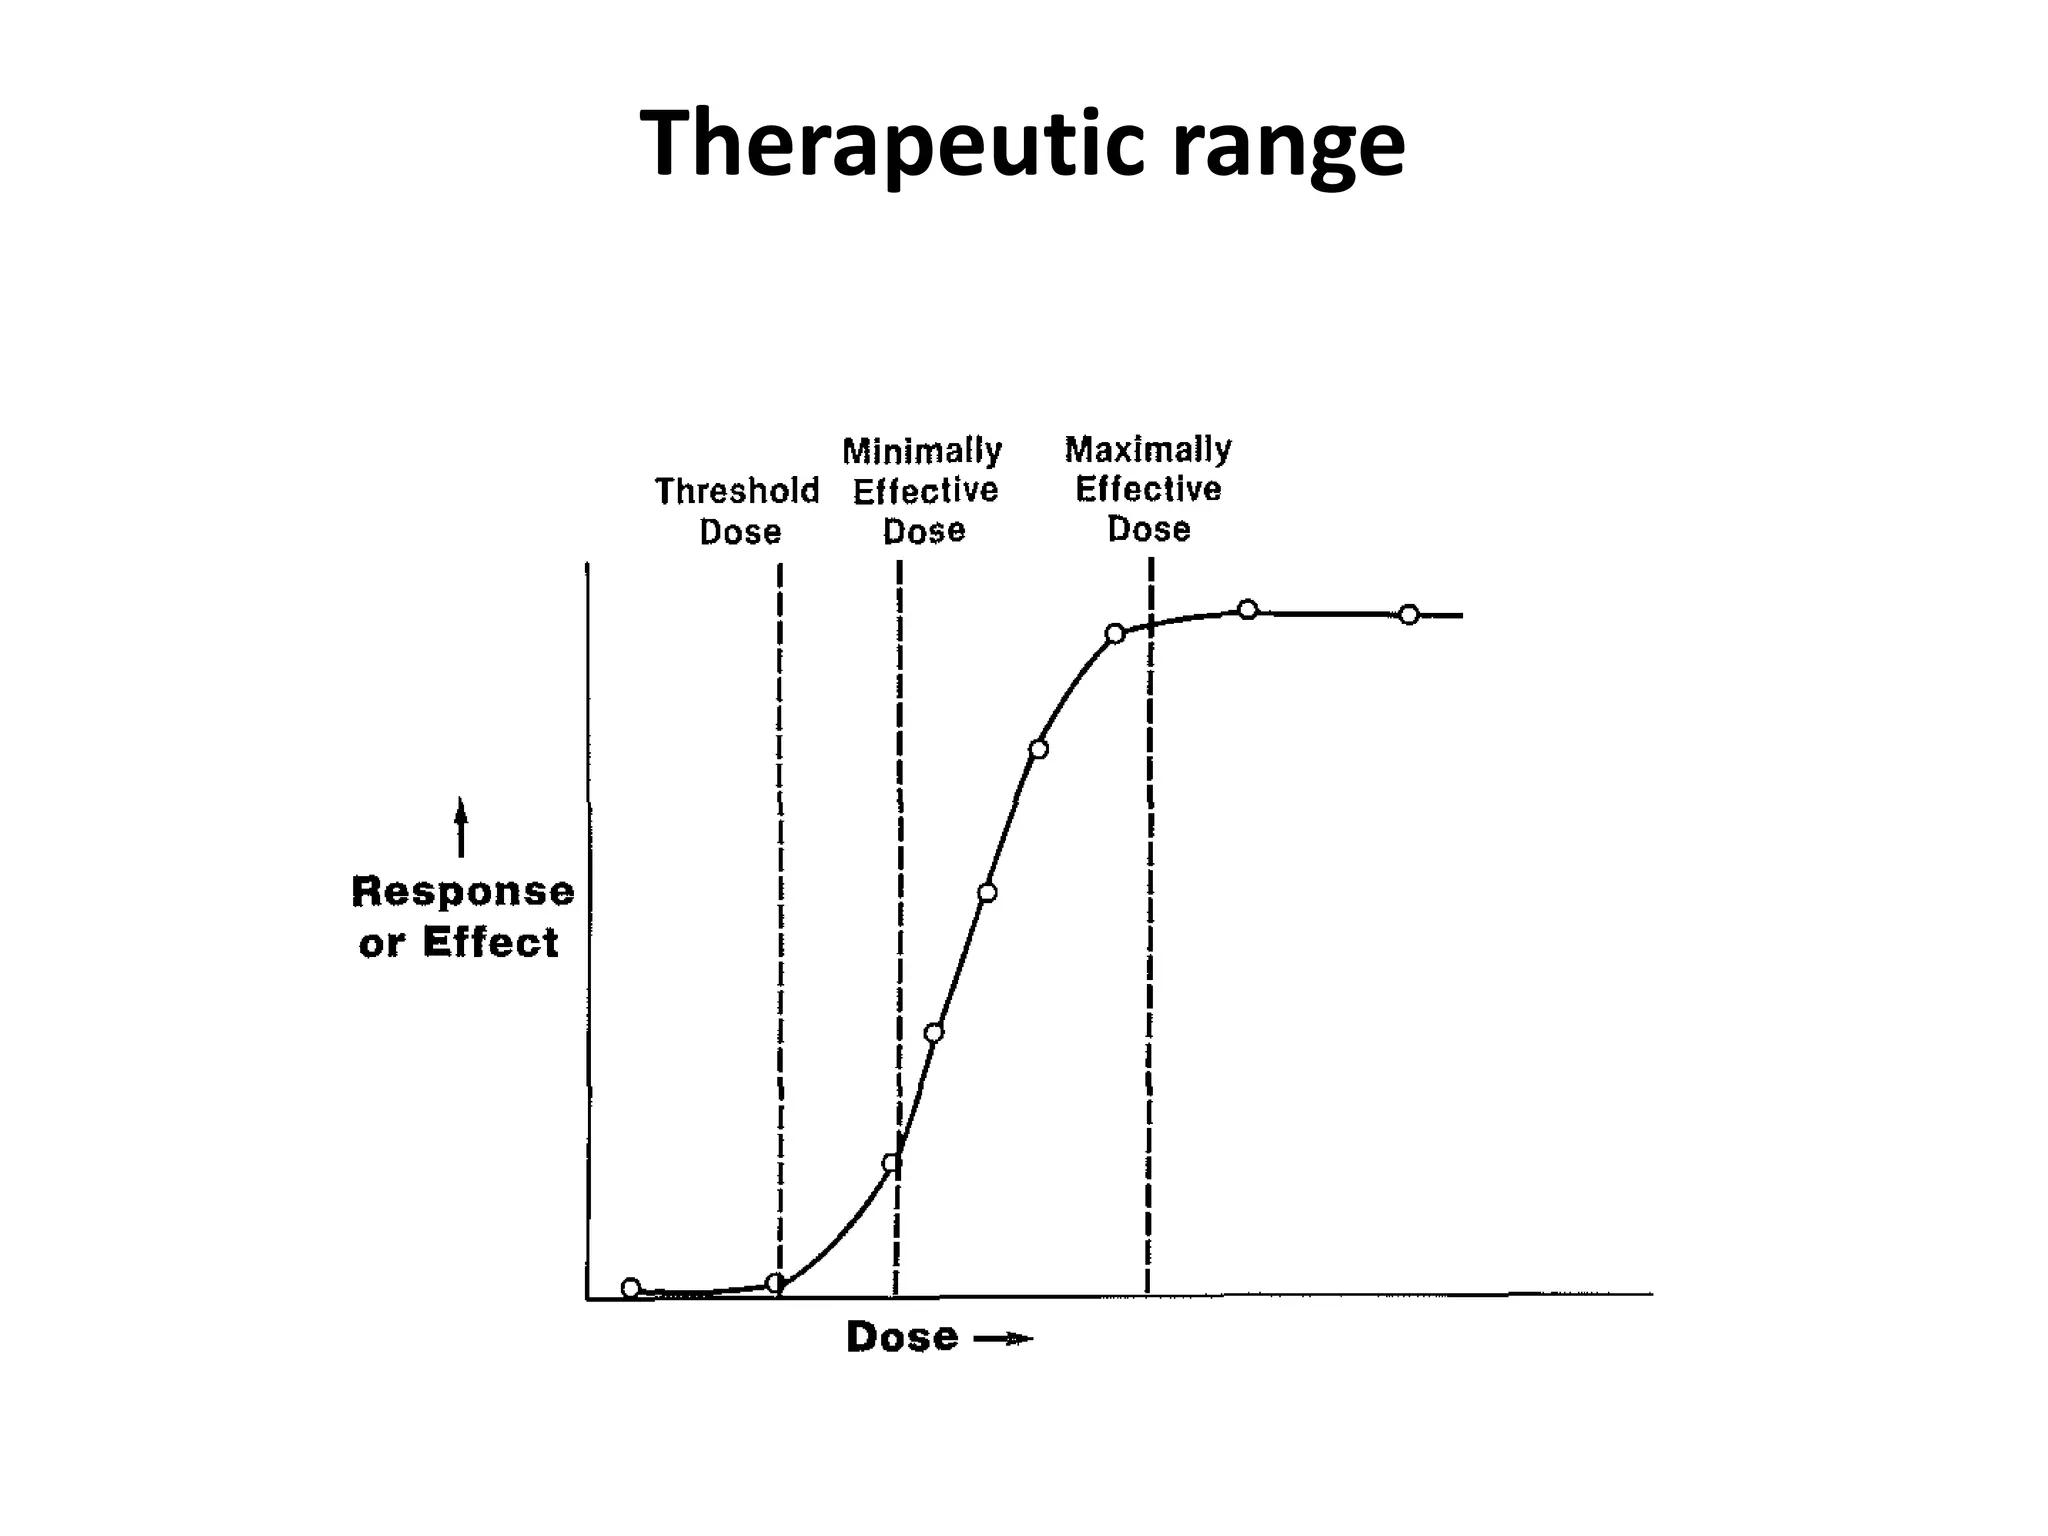
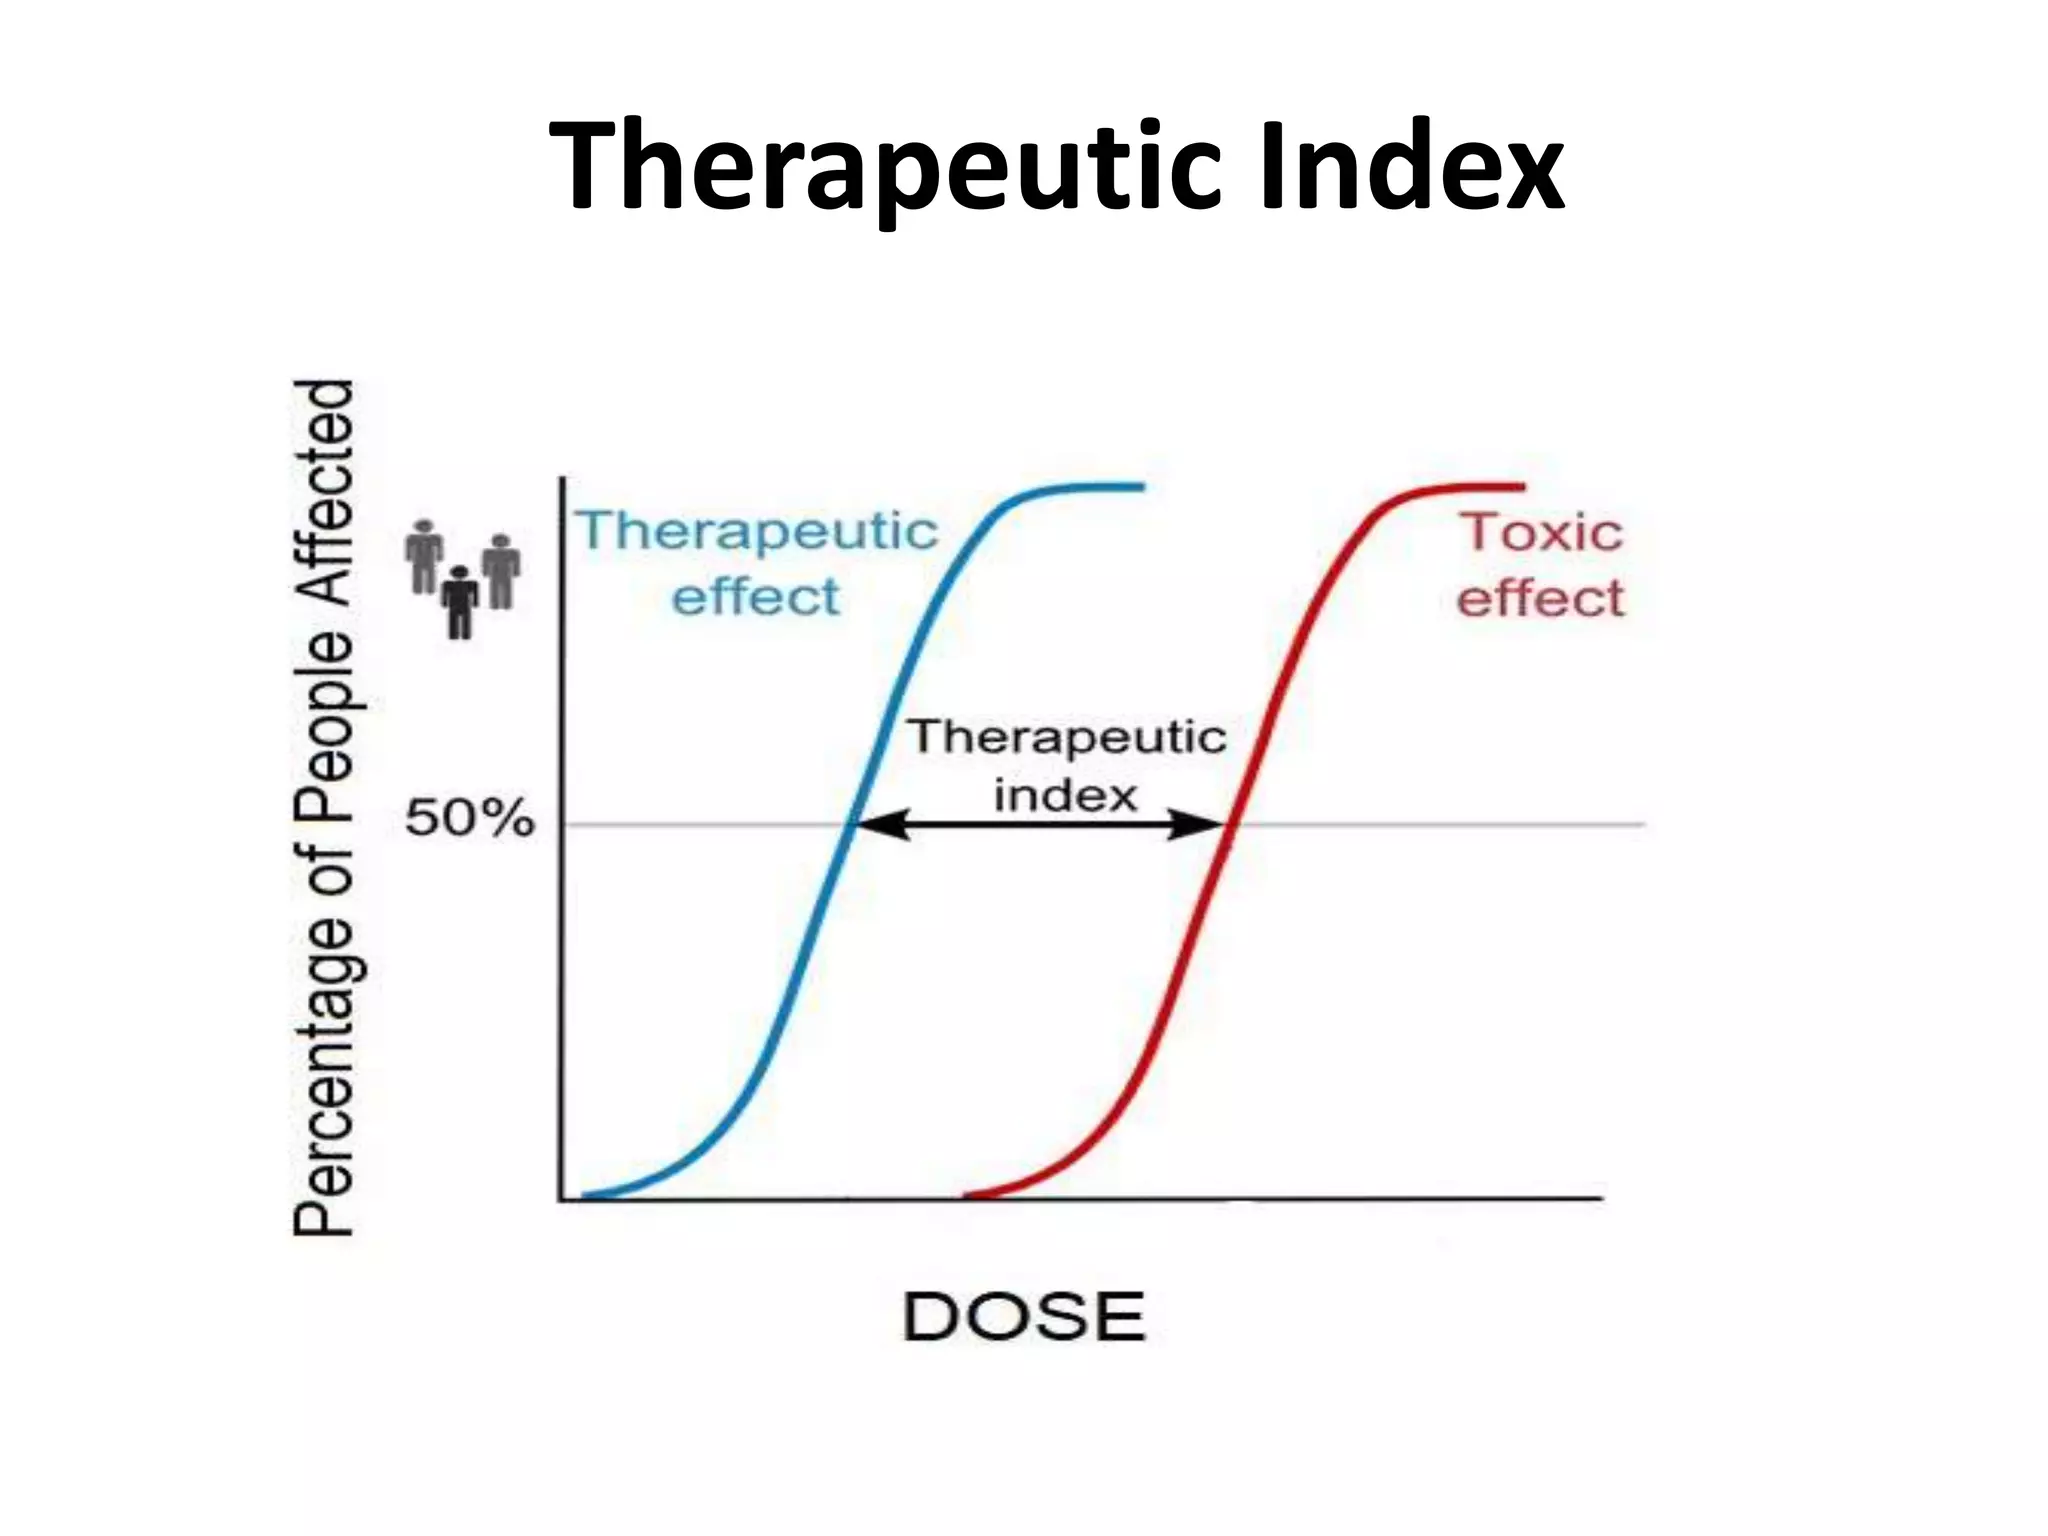
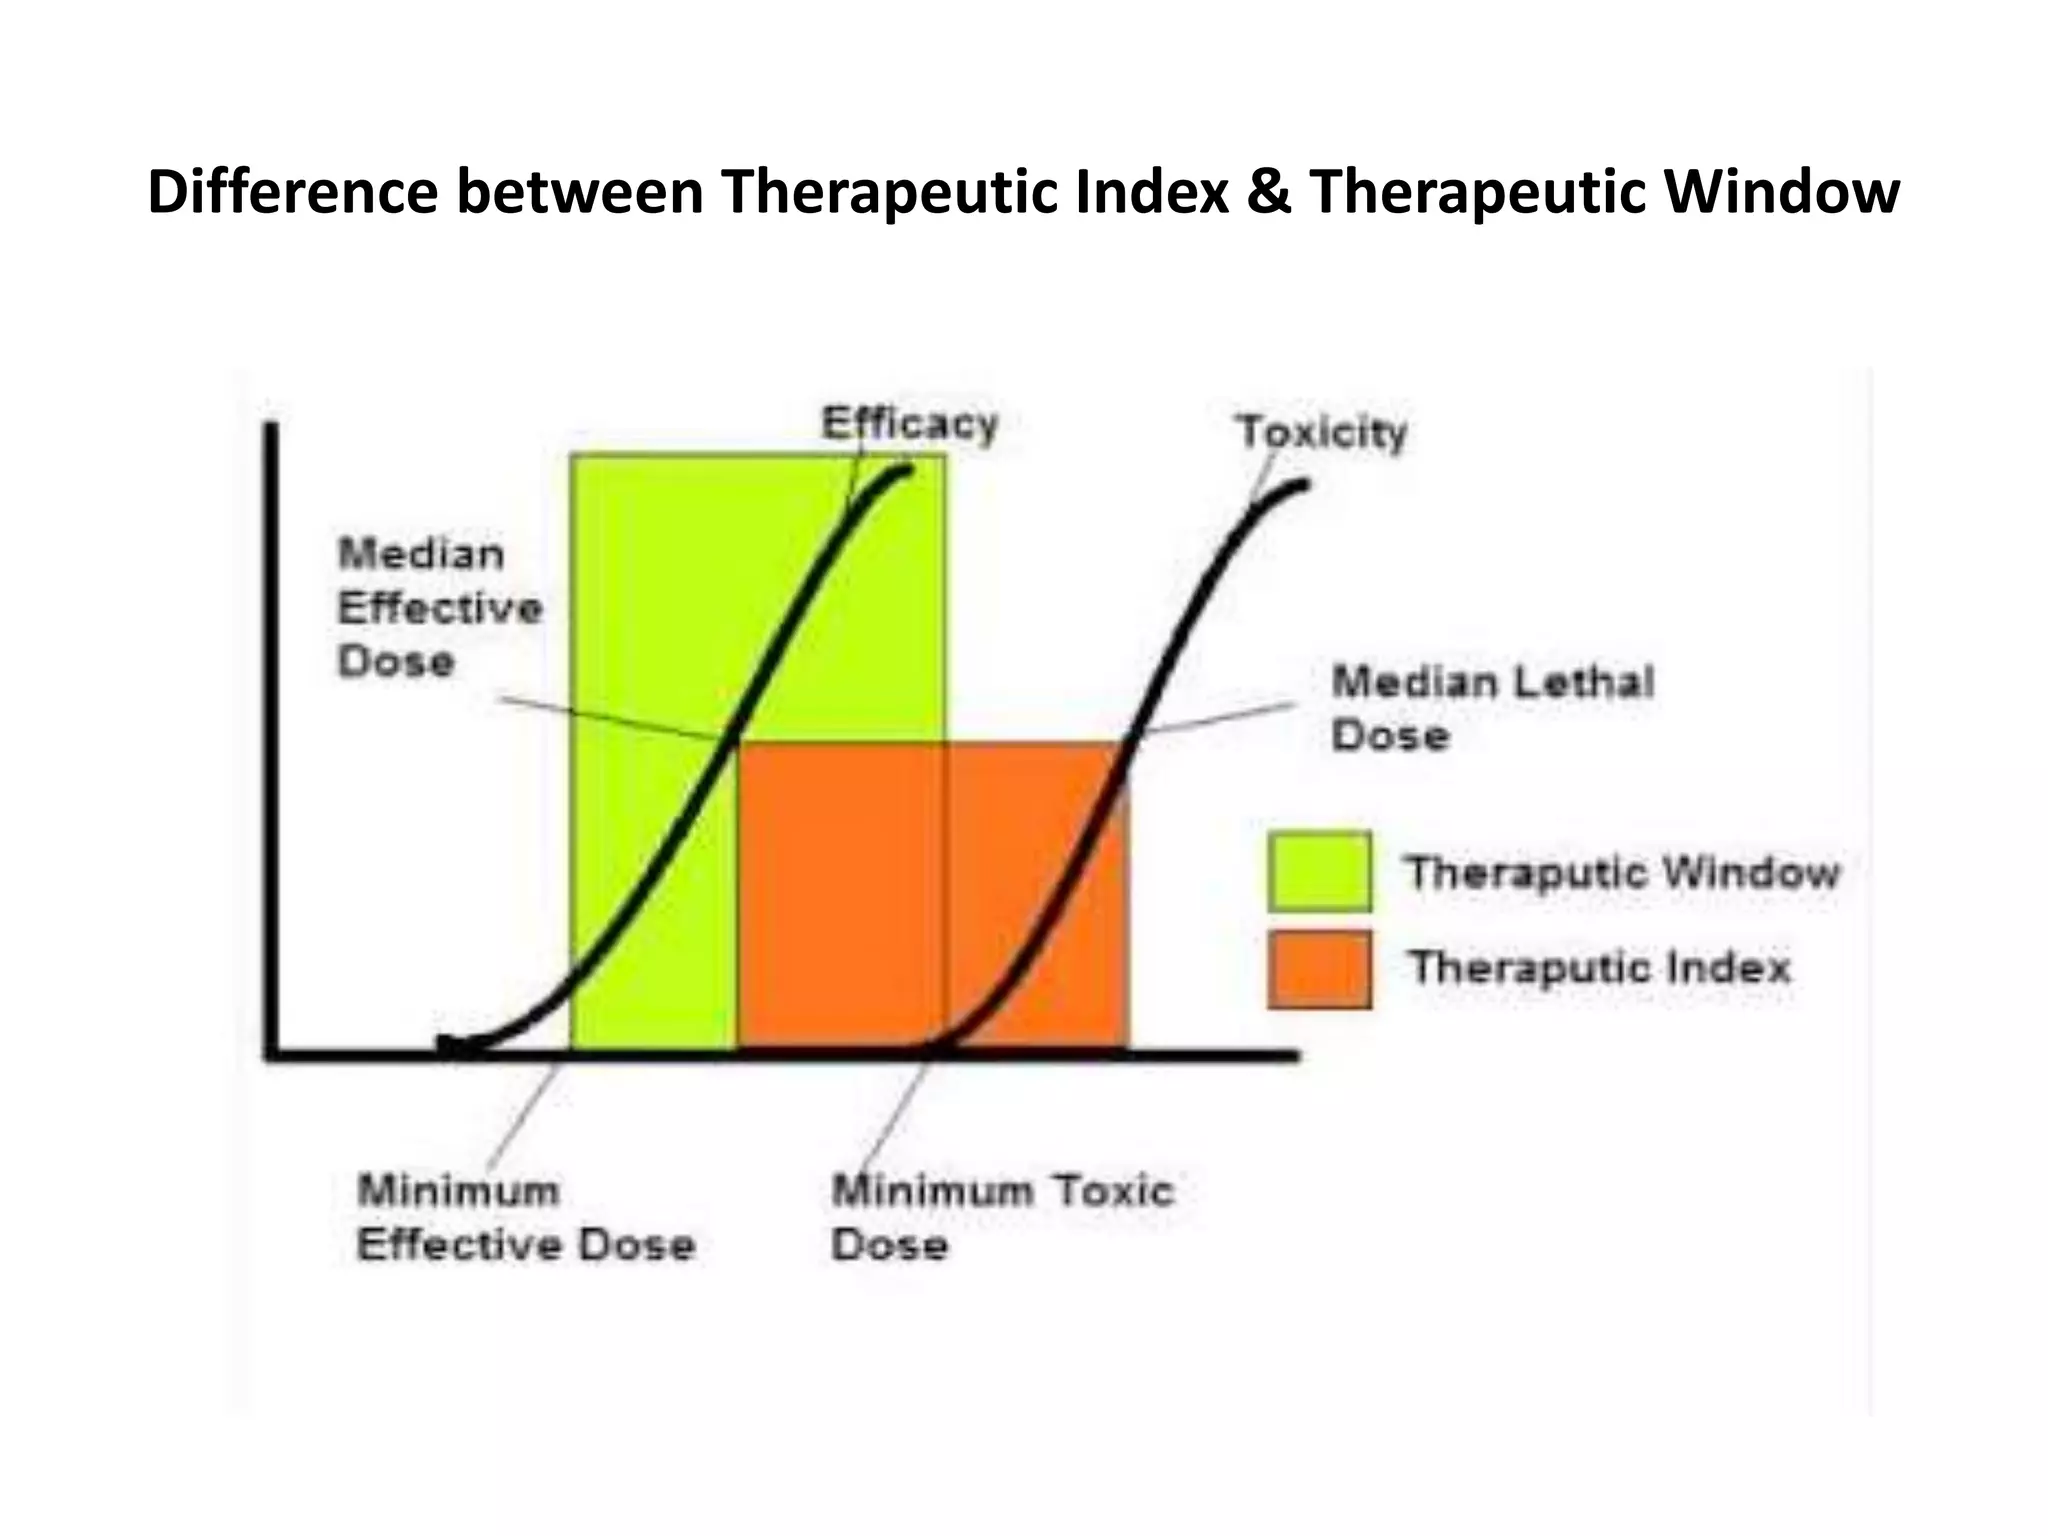
The importance of therapeutic index as a safety margin and distinction from therapeutic window.
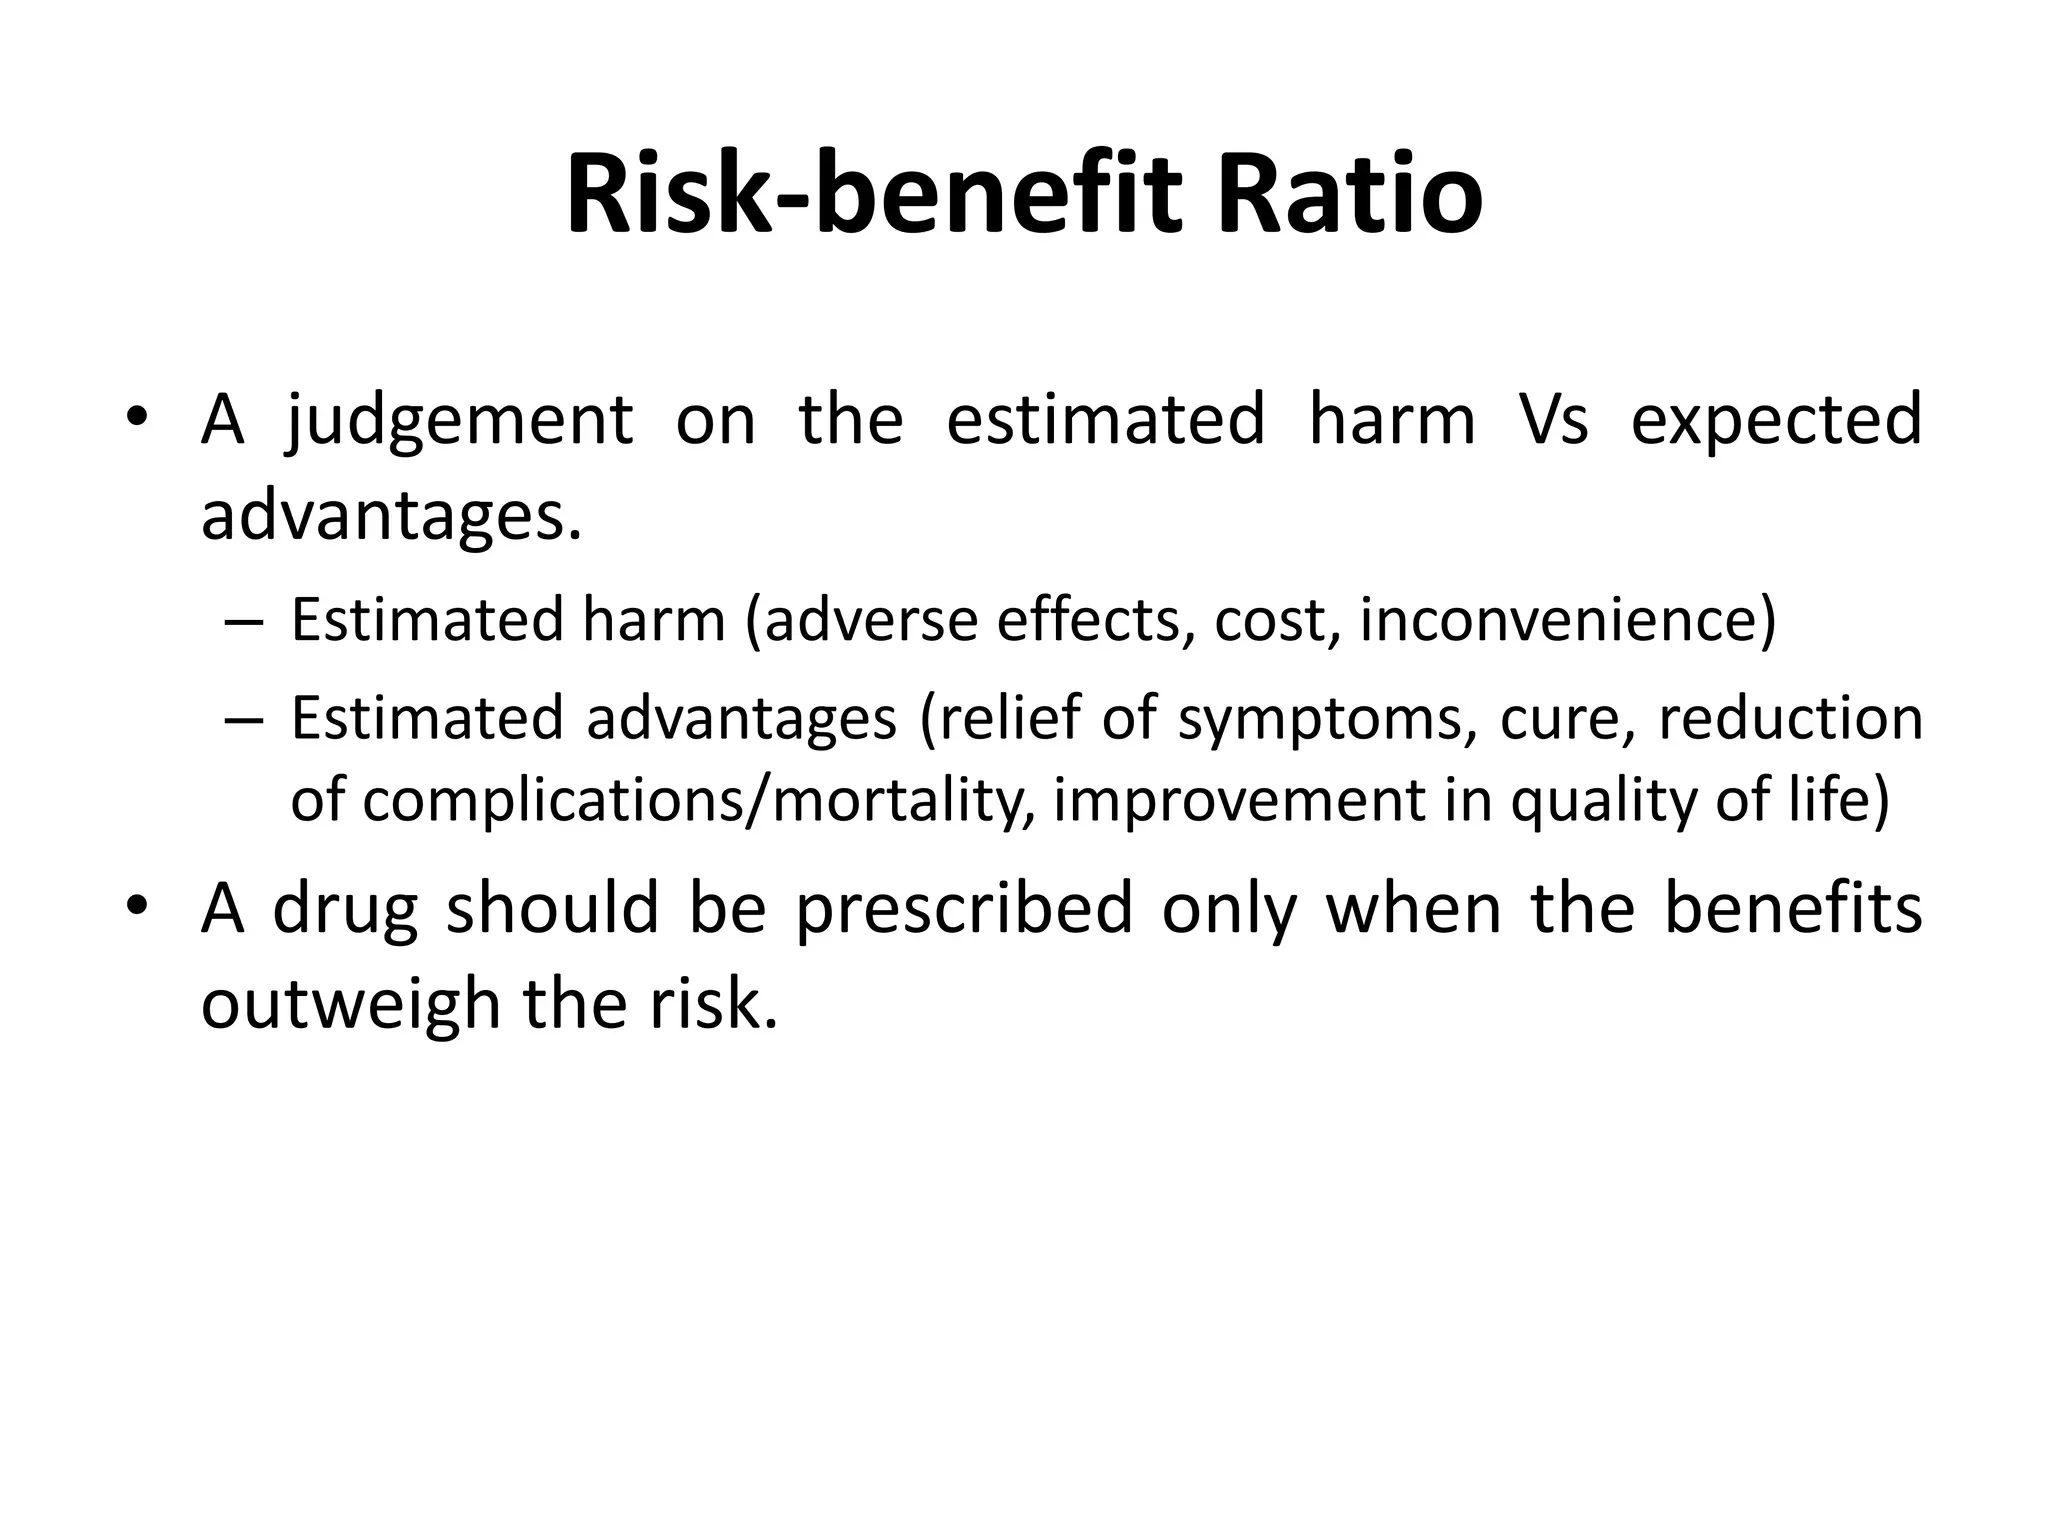
Assessment of risks versus expected therapeutic benefits in drug prescription.
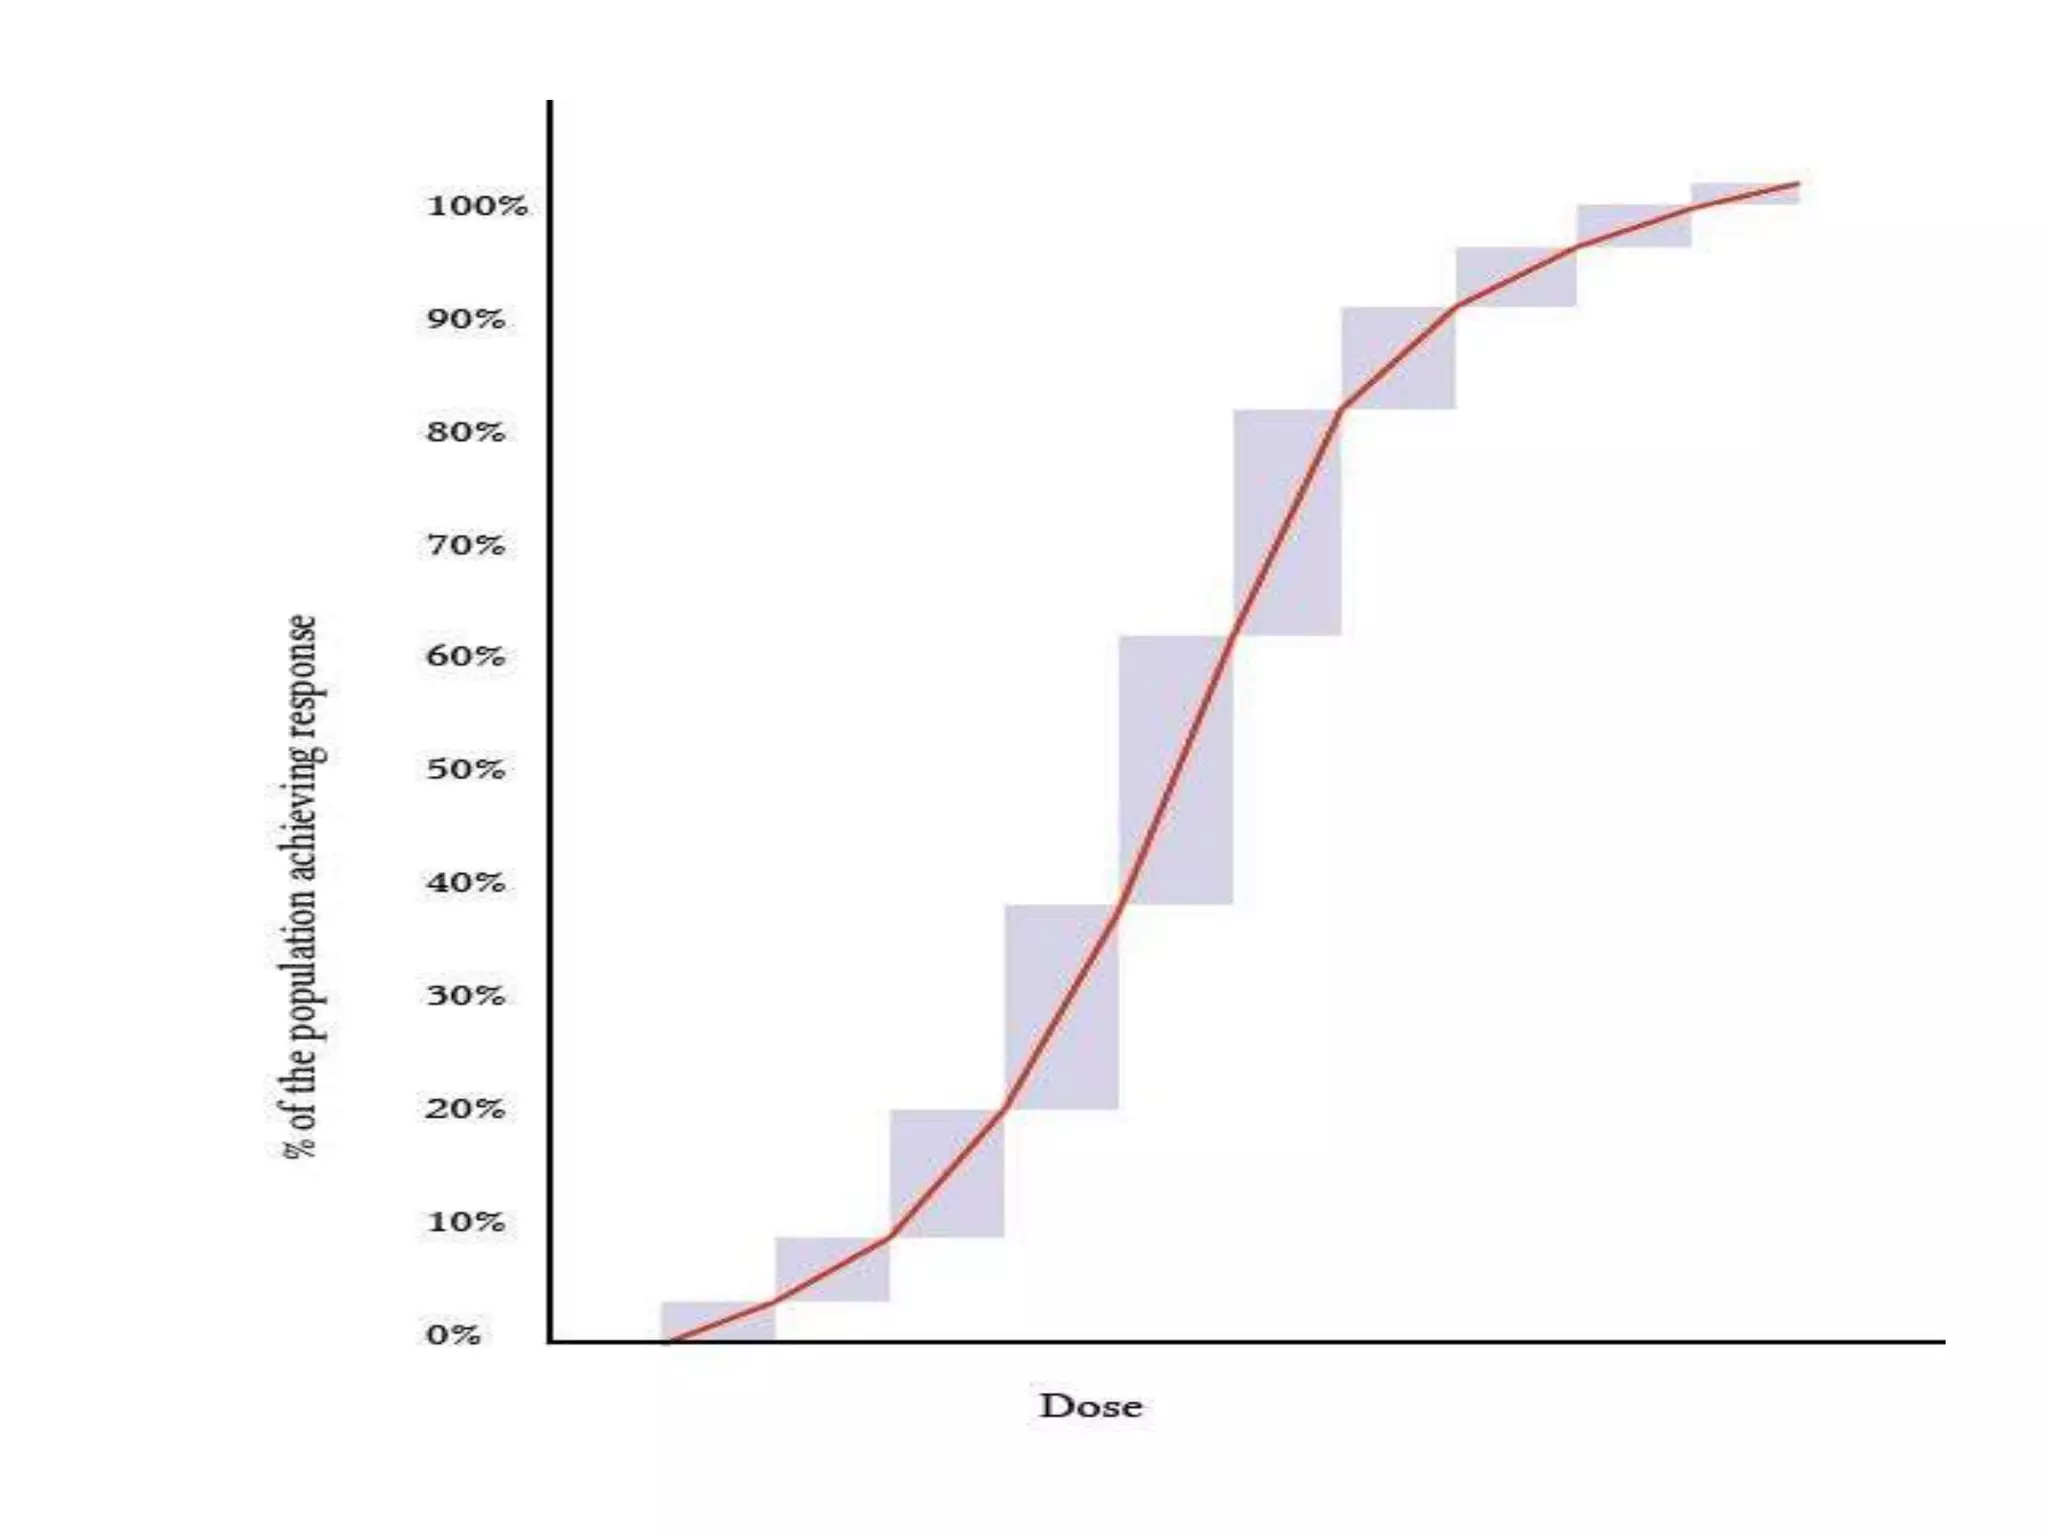
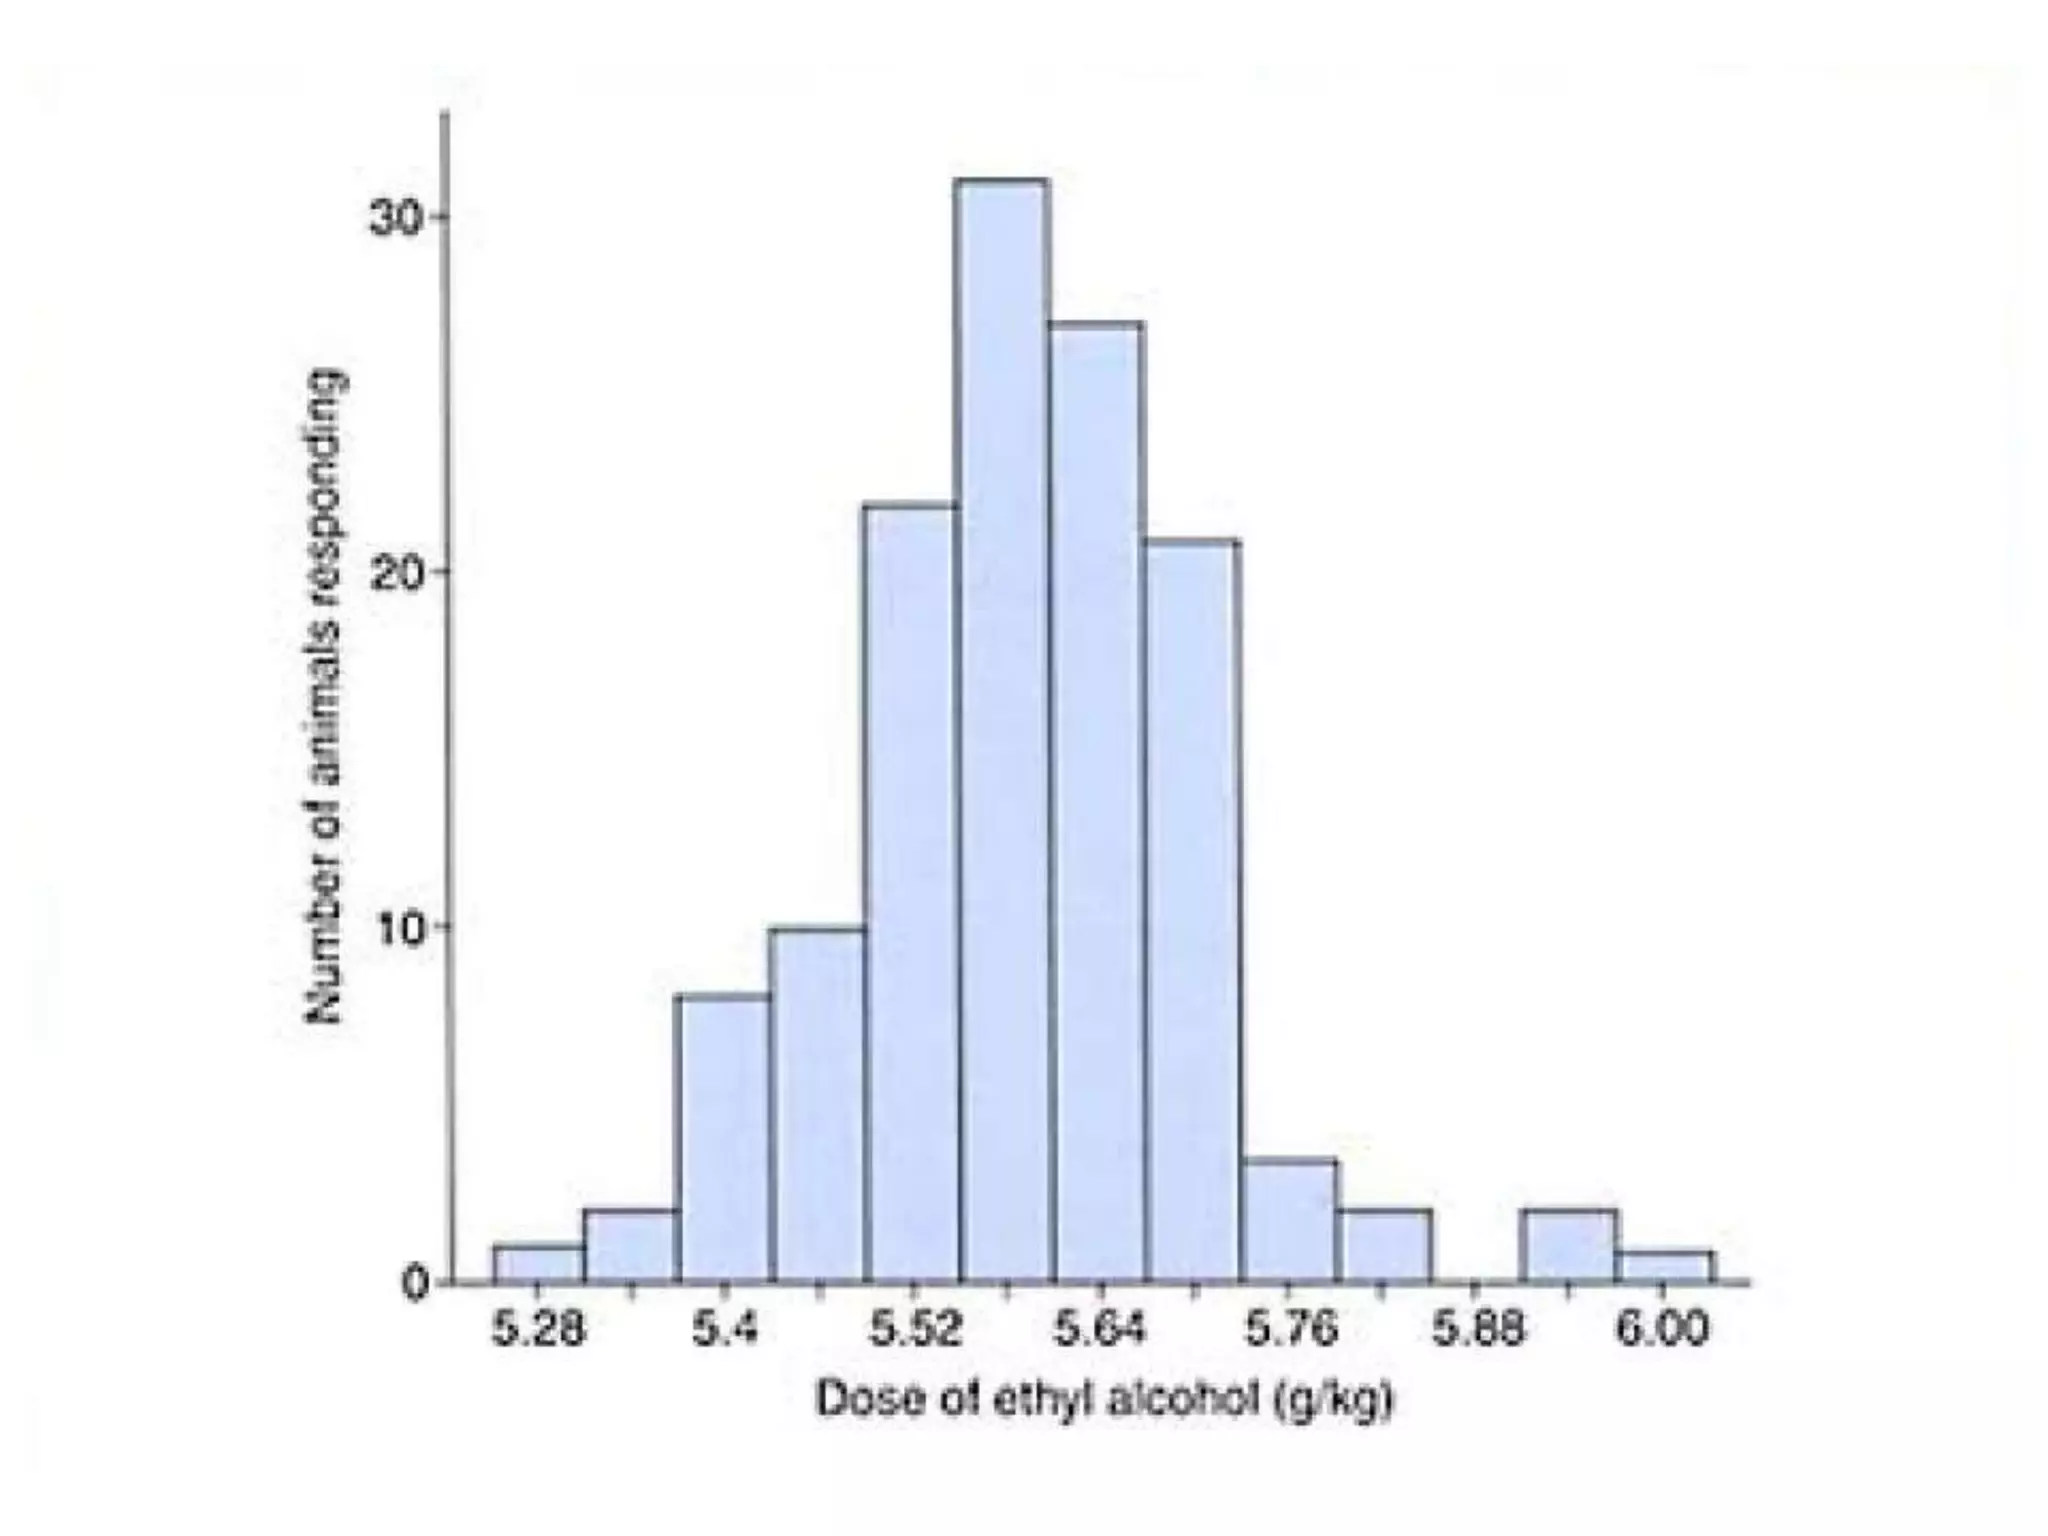
Overview of graded vs. quantal dose response curves and their applications in pharmacology.
Closing remarks on dose response curves and their importance in clinical settings.


