Downloaded 11 times


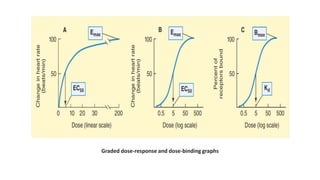

![Drug-receptor interaction obeys law of mass action, accordingly:-
Where E: Observed effect at a dose [D] of the drug.
Emax: Maximal response.
KD: Dissociation constant of the drug-receptor complex, which is equal to the dose of
the drug at which half maximal response is produced.](https://image.slidesharecdn.com/doseresponsephenomenon-230305161336-c55f5c6e/85/Dose-Response-Phenomenon-pptx-13-320.jpg)


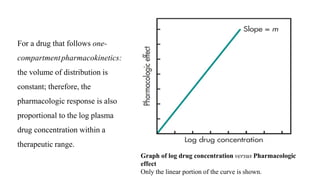


The lecture by Dr. Awais Irshad focuses on the dose-response phenomenon in pharmacology, explaining how the relationship between drug concentration, receptor activation, and pharmacologic response is determined. It elaborates on the different types of dose-response curves, such as graded and quantal curves, and their graphical representations, as well as the impact of factors like receptor spare and antagonists on drug efficacy. Furthermore, it discusses the pharmacokinetic considerations and how the pharmacologic effects are influenced by the administered dose.


![ABDOMINAL EXAMINATION Presentation[1].pptx](https://cdn.slidesharecdn.com/ss_thumbnails/abdominalexaminationpresentation1-240105120242-b6318479-thumbnail.jpg?width=640&height=640&fit=bounds)


![Down syndrome (2)[1].pptx pediatric lecture](https://cdn.slidesharecdn.com/ss_thumbnails/downsyndrome21-240709094926-fcdd02d9-thumbnail.jpg?width=640&height=640&fit=bounds)


