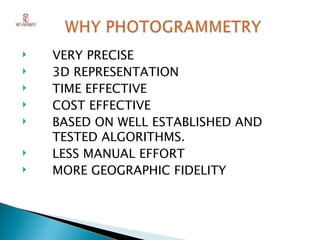
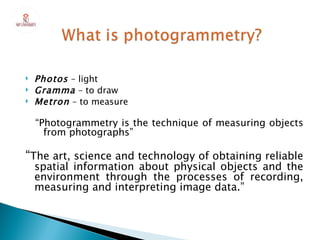
PHOTOGRAMMETRY


           G.CHANDRA SEKHAR REDDY
                   M.Tech(GIS)
                NIIT UNIVERSITY
   VERY PRECISE
   3D REPRESENTATION
   TIME EFFECTIVE
   COST EFFECTIVE
   BASED ON WELL ESTABLISHED AND
    TESTED ALGORITHMS.
   LESS MANUAL EFFORT
   MORE GEOGRAPHIC FIDELITY
   Photos – light
   Gramma – to draw
   Metron – to measure

    “Photogrammetry is the technique of measuring objects
      from photographs”

“The art, science and technology of obtaining reliable
    spatial information about physical objects and the
    environment through the processes of recording,
    measuring and interpreting image data.”
Aerial Photogrammetry the camera is mounted
in an aircraft and is usually pointed vertically towards
the ground. Multiple overlapping photos of the ground
are taken as the aircraft flies along a flight path. These
photos are processed in a stereo-plotter (an instrument
that lets an operator see two photos at once in a stereo
view). These photos are also used in automated
processing for Digital Elevation Model (DEM) creation.

  Close-range Photogrammetry the camera is
close to the subject and is typically hand held or on a
tripod. Usually this type of photogrammetry work is
non-topographic - that is the output is not topographic
products like terrain models or topographic maps, but
instead drawings and 3d models. Everyday cameras are
used to model buildings, engineering structures,
vehicles, forensic and accident scenes, film sets, etc.
PROCESS
            FLOW

=>   RAW DATA FORM CLIENT
=>   AERIAL TRIANGULATION
=>   DATA CAPTURING
=>   DEM GENARATION
=>   CONTOUR GENARATION
=>   ORTHOPHO GENARATION
=>   GIS CONVERSTION
In Aerial Photogrammetry the camera is mounted
in an aircraft and is usually pointed vertically towards
the ground. Multiple overlapping photos of the
ground are taken as the aircraft flies along a flight
path. These photos are processed in a stereo-plotter
(an instrument that lets an operator see two photos at
once in a stereo view).
AERIALTRIANGULATION


Aeotriangulation
adopts
photogrammteric
triangulation which
establishes the
geometric
relationships among
overlapping and
sidelapping
photographs to
determine
supplemental
horizontal and vertical
control points
   Adjacent but
    overlapping aerial
    photos are called
    stereo-pairs and
    are needed to
    determine parallax
    and stereo/3D
    viewing
R u n #1

R u n #2
   Overlapping
    photography


   Endlap - ~60%

   Sidelap - ~20-30%
PLANIMETRIC FEATURE
     EXTRACTION
   Buildings
   Transportation Features
   Hydro Features
   Utilities
   Vegetation
   Breaklines
   DTM points
   Bridges
Raster data are described by a cell grid, one value per cell
                           Vector                   Raster

    Point

   Line
                                                 Zone of cells
  Polygon
15
PLANMETRIC FEATURES
   There is no common usage of the terms digital
    elevation model (DEM), digital terrain model
    (DTM) and digital surface model (DSM) in
    scientific literature.
    In the most cases the term digital surface model
    represents the earth's
   The digital terrain model represents the bare
    ground surface
   The term Digital Elevation Model is often used as a
    generic term for DSMs and DTMs, only
    representing height information without any further
    definition about the surface
   There is no common usage of the terms digital elevation
    model (DEM), digital terrain model (DTM) and digital
    surface model (DSM) in scientific literature.
    In the most cases the term digital surface model
    represents the earth's
   The digital terrain model represents the bare ground
    surface
   The term Digital Elevation Model is often used as a generic
    term for DSMs and DTMs, only representing height
    information without any further definition about the surface
 Contour lines are lines drawn on a map connecting
  points of equal elevation

 Contour lines are useful because they allow us to show
  the shape of the land surface (topography) on a map

 This vertical spacing is referred to as the contour interval

 If the contour interval is 10 ft. Each the contour lines was
  a multiple of 10 ft.( i.e. 0, 10, 20, 30)

 In areas with high relief the contour interval is usually
  larger
DATA FOR THE 3D CITY MODELS

 The 3D city models contain data, which is related to the Spatial objects.

Those objects are generally topography, buildings, transportation,
plant cover, infrastructure and other details related to the goal of
application.

3D city models are focused on buildings however it may contain
roads, green cover, trees etc. according to the usage of model.
3D BUILDING MODEL


           The constructed 3D model
Photogrammetry …. Lecture 11
          Dr. Steve Ramroop
ORTHO PHOTO GENARATION

Usually orthoimages do have some geometric limitations, they do
show only the elements located in the height level of the used DEM in
the correct location. Buildings not included in the DEM, are shifted with
the location of the roofs depending upon the tangent of the nadir angle
of the image location multiplied with the building height. So also parts of
the facade can be seen If the height value of the roof is included in a
detailed DEM, the roof is shown in the correct position corresponding to
an orthogonal map projection. This is causing the problem that for some
parts, before hidden by the roof, no information is available for the
orthoimage
ORTHOIMAGE


  location of a building in a usual
                                      orthoimage with the
orthoimage based on a DEM the bare
                                      corrected location of
           including ground
                                      the building roof
ORTHOIMAGE


location of bridges uncorrected and corrected for
height differences against the road below
   The output of photogrammetry is typically a
    map, drawing or a 3d model of some real-
    world object or scene. Many of the maps we
    use today are created with photogrammetry
    and photographs taken from aircraft.
Photogrammetry chandu

Photogrammetry chandu

  • 1.
    PHOTOGRAMMETRY G.CHANDRA SEKHAR REDDY M.Tech(GIS) NIIT UNIVERSITY
  • 2.
    VERY PRECISE  3D REPRESENTATION  TIME EFFECTIVE  COST EFFECTIVE  BASED ON WELL ESTABLISHED AND TESTED ALGORITHMS.  LESS MANUAL EFFORT  MORE GEOGRAPHIC FIDELITY
  • 3.
    Photos – light  Gramma – to draw  Metron – to measure “Photogrammetry is the technique of measuring objects from photographs” “The art, science and technology of obtaining reliable spatial information about physical objects and the environment through the processes of recording, measuring and interpreting image data.”
  • 4.
    Aerial Photogrammetry thecamera is mounted in an aircraft and is usually pointed vertically towards the ground. Multiple overlapping photos of the ground are taken as the aircraft flies along a flight path. These photos are processed in a stereo-plotter (an instrument that lets an operator see two photos at once in a stereo view). These photos are also used in automated processing for Digital Elevation Model (DEM) creation. Close-range Photogrammetry the camera is close to the subject and is typically hand held or on a tripod. Usually this type of photogrammetry work is non-topographic - that is the output is not topographic products like terrain models or topographic maps, but instead drawings and 3d models. Everyday cameras are used to model buildings, engineering structures, vehicles, forensic and accident scenes, film sets, etc.
  • 5.
    PROCESS FLOW => RAW DATA FORM CLIENT => AERIAL TRIANGULATION => DATA CAPTURING => DEM GENARATION => CONTOUR GENARATION => ORTHOPHO GENARATION => GIS CONVERSTION
  • 6.
    In Aerial Photogrammetrythe camera is mounted in an aircraft and is usually pointed vertically towards the ground. Multiple overlapping photos of the ground are taken as the aircraft flies along a flight path. These photos are processed in a stereo-plotter (an instrument that lets an operator see two photos at once in a stereo view).
  • 7.
    AERIALTRIANGULATION Aeotriangulation adopts photogrammteric triangulation which establishes the geometric relationshipsamong overlapping and sidelapping photographs to determine supplemental horizontal and vertical control points
  • 8.
    Adjacent but overlapping aerial photos are called stereo-pairs and are needed to determine parallax and stereo/3D viewing
  • 9.
    R u n#1 R u n #2
  • 10.
    Overlapping photography  Endlap - ~60%  Sidelap - ~20-30%
  • 11.
  • 12.
    Buildings  Transportation Features  Hydro Features  Utilities  Vegetation  Breaklines  DTM points  Bridges
  • 13.
    Raster data aredescribed by a cell grid, one value per cell Vector Raster Point Line Zone of cells Polygon
  • 15.
  • 16.
  • 18.
    There is no common usage of the terms digital elevation model (DEM), digital terrain model (DTM) and digital surface model (DSM) in scientific literature.  In the most cases the term digital surface model represents the earth's  The digital terrain model represents the bare ground surface  The term Digital Elevation Model is often used as a generic term for DSMs and DTMs, only representing height information without any further definition about the surface
  • 19.
    There is no common usage of the terms digital elevation model (DEM), digital terrain model (DTM) and digital surface model (DSM) in scientific literature.  In the most cases the term digital surface model represents the earth's  The digital terrain model represents the bare ground surface  The term Digital Elevation Model is often used as a generic term for DSMs and DTMs, only representing height information without any further definition about the surface
  • 21.
     Contour linesare lines drawn on a map connecting points of equal elevation  Contour lines are useful because they allow us to show the shape of the land surface (topography) on a map  This vertical spacing is referred to as the contour interval  If the contour interval is 10 ft. Each the contour lines was a multiple of 10 ft.( i.e. 0, 10, 20, 30)  In areas with high relief the contour interval is usually larger
  • 23.
    DATA FOR THE3D CITY MODELS  The 3D city models contain data, which is related to the Spatial objects. Those objects are generally topography, buildings, transportation, plant cover, infrastructure and other details related to the goal of application. 3D city models are focused on buildings however it may contain roads, green cover, trees etc. according to the usage of model.
  • 24.
    3D BUILDING MODEL The constructed 3D model
  • 25.
    Photogrammetry …. Lecture11 Dr. Steve Ramroop
  • 26.
  • 27.
    ORTHO PHOTO GENARATION Usuallyorthoimages do have some geometric limitations, they do show only the elements located in the height level of the used DEM in the correct location. Buildings not included in the DEM, are shifted with the location of the roofs depending upon the tangent of the nadir angle of the image location multiplied with the building height. So also parts of the facade can be seen If the height value of the roof is included in a detailed DEM, the roof is shown in the correct position corresponding to an orthogonal map projection. This is causing the problem that for some parts, before hidden by the roof, no information is available for the orthoimage
  • 28.
    ORTHOIMAGE locationof a building in a usual orthoimage with the orthoimage based on a DEM the bare corrected location of including ground the building roof
  • 29.
    ORTHOIMAGE location of bridgesuncorrected and corrected for height differences against the road below
  • 30.
    The output of photogrammetry is typically a map, drawing or a 3d model of some real- world object or scene. Many of the maps we use today are created with photogrammetry and photographs taken from aircraft.

Editor's Notes