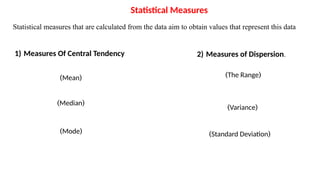
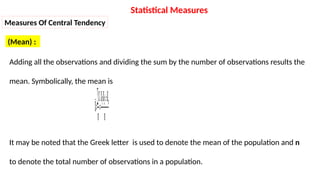
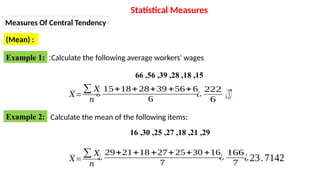
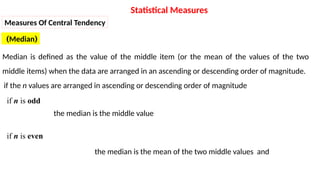
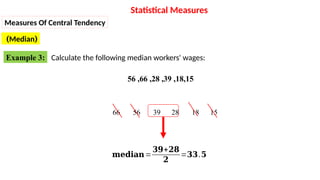
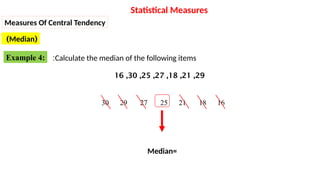
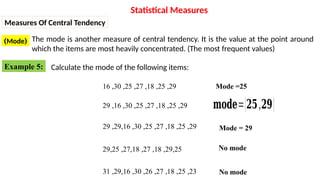
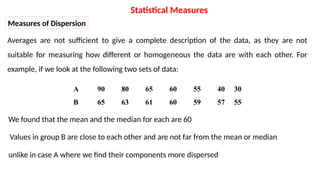
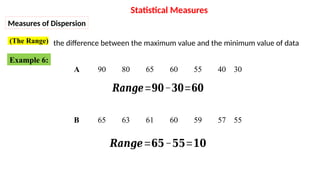
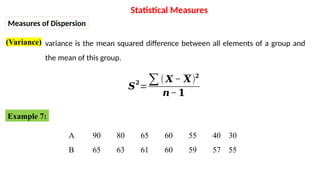
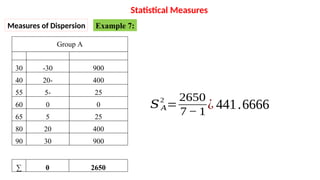
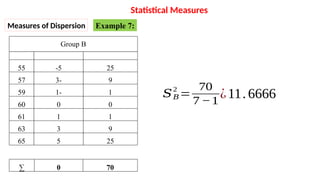
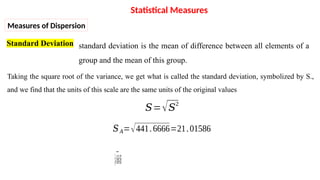
DESCRIPTIVE STATISTICS
statistics is concerned with scientific method for collecting, organizing, summarizing, presenting and
analyzing data as well as drawing valid conclusions and making reasonable decisions on the basis of
such analysis.
Definitions of Statistics
General Concepts
The descriptive statistics
deals with collecting, summarizing, and simplifying data to achieve conclusions can be readily drawn
from the data. It facilitates an understanding of the data and systematic reporting; and also makes them
amenable to further discussion, analysis, and interpretations.
Inferential statistics
it consists of methods that are used for drawing inferences, or making broad generalizations, about a
totality of observations on the basis of knowledge about a part of that totality. we can estimate a value
about the entire population from the sample information by using inferential statistics.
General Concepts
Data collection method
Survey method
:
Data are collected on every item of the community without exception
Sampling method
:
This method is based on selecting a part of the community under study, and this method is
characterized by reducing time, effort and cost.
Population : It is the total group of the study items, whether they are individuals or things
Sample: It is a part of the population that includes the
characteristics of the original population , and the sample
must be representative of all the components of this
population .
General Concepts
Statistical Measures
Statistical measures that are calculated from the data aim to obtain values that represent this data
1) Measures Of Central Tendency 2) Measures of Dispersion.
(
Mean
)
(
Median
)
(
Mode
)
(
The Range
)
(
Variance
)
(
Standard Deviation
)
Measures Of Central Tendency
(Mean) :
Adding all the observations and dividing the sum by the number of observations results the
mean. Symbolically, the mean is
๐‘ฟ=
โˆ‘๐‘ฟ
๐’
=
๐‘ฟ๐Ÿ+๐‘ฟ๐Ÿ+โ€ฆ+๐‘ฟ๐’
๐’
It may be noted that the Greek letter is used to denote the mean of the population and n
to denote the total number of observations in a population.
Statistical Measures
Example 1: Calculate the following average workers' wages
:
15
,
18
,
28
,
39
,
56
,
66
๐‘‹=
โˆ‘ ๐‘‹
๐‘›
ยฟ
15+18+28+39 +56+6
6
ยฟ
222
6 ยฟ37
Example 2: Calculate the mean of the following items:
29
,
21
,
18
,
27
,
25
,
30
,
16
๐‘‹=
โˆ‘ ๐‘‹
๐‘›
ยฟ
29+21+18 +27+25+30 +16
7
ยฟ
166
7
ยฟ23.7142
Statistical Measures
Measures Of Central Tendency
(Mean) :
(
Median
)
Median is defined as the value of the middle item (or the mean of the values of the two
middle items) when the data are arranged in an ascending or descending order of magnitude.
if the n values are arranged in ascending or descending order of magnitude
the median is the middle value
the median is the mean of the two middle values and
Statistical Measures
Measures Of Central Tendency
if n is odd
if n is even
Calculate the following median workers' wages:
18,15
,
39
,
28
,
66
,
56
15
18
28
39
56
66
๐ฆ๐ž๐๐ข๐š๐ง=
๐Ÿ‘๐Ÿ—+๐Ÿ๐Ÿ–
๐Ÿ
=๐Ÿ‘๐Ÿ‘.๐Ÿ“
Statistical Measures
(
Median
)
Measures Of Central Tendency
Example 3:
Calculate the median of the following items
:
29
,
21
,
18
,
27
,
25
,
30
,
16
16
18
21
25
27
29
30
Median=
Statistical Measures
(
Median
)
Measures Of Central Tendency
Example 4:
(
Mode
) The mode is another measure of central tendency. It is the value at the point around
which the items are most heavily concentrated. (The most frequent values)
Calculate the mode of the following items:
29
,
25
,
18
,
27
,
25
,
30
,
16 Mode =25
29
,
25
,
18
,
27
,
25
,
30
,
16
,
29 ๐ฆ๐จ๐๐ž={๐Ÿ๐Ÿ“,๐Ÿ๐Ÿ—}
29,25
,
18
,
27
,
27,18
,
29,25
Mode = 29
23
,
25
,
18
,
27
,
26
,
30
,
29,16
,
31
No mode
29
,
25
,
18
,
27
,
25
,
30
,
29,16
,
29
No mode
Statistical Measures
Measures Of Central Tendency
Example 5:
Measures of Dispersion
Averages are not sufficient to give a complete description of the data, as they are not
suitable for measuring how different or homogeneous the data are with each other. For
example, if we look at the following two sets of data:
30
40
55
60
65
80
90
A
55
57
59
60
61
63
65
B
We found that the mean and the median for each are 60
Values in group B are close to each other and are not far from the mean or median
unlike in case A where we find their components more dispersed
Statistical Measures
(
The Range
) the difference between the maximum value and the minimum value of data
30
40
55
60
65
80
90
A
๐‘น๐’‚๐’๐’ˆ๐’†=๐Ÿ”๐Ÿ“โˆ’๐Ÿ“๐Ÿ“=๐Ÿ๐ŸŽ
55
57
59
60
61
63
65
B
๐‘น๐’‚๐’๐’ˆ๐’†=๐Ÿ—๐ŸŽโˆ’๐Ÿ‘๐ŸŽ=๐Ÿ”๐ŸŽ
Statistical Measures
Measures of Dispersion
Example 6:
(
Variance
) variance is the mean squared difference between all elements of a group and
the mean of this group.
๐‘บ๐Ÿ
=
โˆ‘( ๐‘ฟ โˆ’ ๐‘ฟ)๐Ÿ
๐’โˆ’๐Ÿ
30
40
55
60
65
80
90
A
55
57
59
60
61
63
65
B
Statistical Measures
Measures of Dispersion
Example 7:
Group A
30
40
55
60
65
80
90
-30
-
20
-
5
0
5
20
30
900
400
25
0
25
400
900
โˆ‘ 0 2650
๐‘† ๐ด
2
=
2650
7โˆ’ 1
ยฟ 441.6666
Statistical Measures
Measures of Dispersion Example 7:
Group B
55
57
59
60
61
63
65
-5
-
3
-
1
0
1
3
5
25
9
1
0
1
9
25
โˆ‘ 0 70
๐‘†๐ต
2
=
70
7 โˆ’1
ยฟ11.6666
Statistical Measures
Measures of Dispersion Example 7:
Standard Deviation
Taking the square root of the variance, we get what is called the standard deviation, symbolized by S.,
and we find that the units of this scale are the same units of the original values
๐‘†=โˆš๐‘†2
๐‘†๐ด=โˆš441.6666=21.01586
๐‘†๐ต=โˆš11.6666=3.415650
Statistical Measures
Measures of Dispersion
standard deviation is the mean of difference between all elements of a
group and the mean of this group.
Good luck

Presentation of DESCRIPTIVE STATISTICS analysis

  • 1.
  • 2.
    statistics is concernedwith scientific method for collecting, organizing, summarizing, presenting and analyzing data as well as drawing valid conclusions and making reasonable decisions on the basis of such analysis. Definitions of Statistics General Concepts The descriptive statistics deals with collecting, summarizing, and simplifying data to achieve conclusions can be readily drawn from the data. It facilitates an understanding of the data and systematic reporting; and also makes them amenable to further discussion, analysis, and interpretations. Inferential statistics it consists of methods that are used for drawing inferences, or making broad generalizations, about a totality of observations on the basis of knowledge about a part of that totality. we can estimate a value about the entire population from the sample information by using inferential statistics.
  • 3.
  • 4.
    Data collection method Surveymethod : Data are collected on every item of the community without exception Sampling method : This method is based on selecting a part of the community under study, and this method is characterized by reducing time, effort and cost. Population : It is the total group of the study items, whether they are individuals or things Sample: It is a part of the population that includes the characteristics of the original population , and the sample must be representative of all the components of this population . General Concepts
  • 5.
    Statistical Measures Statistical measuresthat are calculated from the data aim to obtain values that represent this data 1) Measures Of Central Tendency 2) Measures of Dispersion. ( Mean ) ( Median ) ( Mode ) ( The Range ) ( Variance ) ( Standard Deviation )
  • 6.
    Measures Of CentralTendency (Mean) : Adding all the observations and dividing the sum by the number of observations results the mean. Symbolically, the mean is ๐‘ฟ= โˆ‘๐‘ฟ ๐’ = ๐‘ฟ๐Ÿ+๐‘ฟ๐Ÿ+โ€ฆ+๐‘ฟ๐’ ๐’ It may be noted that the Greek letter is used to denote the mean of the population and n to denote the total number of observations in a population. Statistical Measures
  • 7.
    Example 1: Calculatethe following average workers' wages : 15 , 18 , 28 , 39 , 56 , 66 ๐‘‹= โˆ‘ ๐‘‹ ๐‘› ยฟ 15+18+28+39 +56+6 6 ยฟ 222 6 ยฟ37 Example 2: Calculate the mean of the following items: 29 , 21 , 18 , 27 , 25 , 30 , 16 ๐‘‹= โˆ‘ ๐‘‹ ๐‘› ยฟ 29+21+18 +27+25+30 +16 7 ยฟ 166 7 ยฟ23.7142 Statistical Measures Measures Of Central Tendency (Mean) :
  • 8.
    ( Median ) Median is definedas the value of the middle item (or the mean of the values of the two middle items) when the data are arranged in an ascending or descending order of magnitude. if the n values are arranged in ascending or descending order of magnitude the median is the middle value the median is the mean of the two middle values and Statistical Measures Measures Of Central Tendency if n is odd if n is even
  • 9.
    Calculate the followingmedian workers' wages: 18,15 , 39 , 28 , 66 , 56 15 18 28 39 56 66 ๐ฆ๐ž๐๐ข๐š๐ง= ๐Ÿ‘๐Ÿ—+๐Ÿ๐Ÿ– ๐Ÿ =๐Ÿ‘๐Ÿ‘.๐Ÿ“ Statistical Measures ( Median ) Measures Of Central Tendency Example 3:
  • 10.
    Calculate the medianof the following items : 29 , 21 , 18 , 27 , 25 , 30 , 16 16 18 21 25 27 29 30 Median= Statistical Measures ( Median ) Measures Of Central Tendency Example 4:
  • 11.
    ( Mode ) The modeis another measure of central tendency. It is the value at the point around which the items are most heavily concentrated. (The most frequent values) Calculate the mode of the following items: 29 , 25 , 18 , 27 , 25 , 30 , 16 Mode =25 29 , 25 , 18 , 27 , 25 , 30 , 16 , 29 ๐ฆ๐จ๐๐ž={๐Ÿ๐Ÿ“,๐Ÿ๐Ÿ—} 29,25 , 18 , 27 , 27,18 , 29,25 Mode = 29 23 , 25 , 18 , 27 , 26 , 30 , 29,16 , 31 No mode 29 , 25 , 18 , 27 , 25 , 30 , 29,16 , 29 No mode Statistical Measures Measures Of Central Tendency Example 5:
  • 12.
    Measures of Dispersion Averagesare not sufficient to give a complete description of the data, as they are not suitable for measuring how different or homogeneous the data are with each other. For example, if we look at the following two sets of data: 30 40 55 60 65 80 90 A 55 57 59 60 61 63 65 B We found that the mean and the median for each are 60 Values in group B are close to each other and are not far from the mean or median unlike in case A where we find their components more dispersed Statistical Measures
  • 13.
    ( The Range ) thedifference between the maximum value and the minimum value of data 30 40 55 60 65 80 90 A ๐‘น๐’‚๐’๐’ˆ๐’†=๐Ÿ”๐Ÿ“โˆ’๐Ÿ“๐Ÿ“=๐Ÿ๐ŸŽ 55 57 59 60 61 63 65 B ๐‘น๐’‚๐’๐’ˆ๐’†=๐Ÿ—๐ŸŽโˆ’๐Ÿ‘๐ŸŽ=๐Ÿ”๐ŸŽ Statistical Measures Measures of Dispersion Example 6:
  • 14.
    ( Variance ) variance isthe mean squared difference between all elements of a group and the mean of this group. ๐‘บ๐Ÿ = โˆ‘( ๐‘ฟ โˆ’ ๐‘ฟ)๐Ÿ ๐’โˆ’๐Ÿ 30 40 55 60 65 80 90 A 55 57 59 60 61 63 65 B Statistical Measures Measures of Dispersion Example 7:
  • 15.
    Group A 30 40 55 60 65 80 90 -30 - 20 - 5 0 5 20 30 900 400 25 0 25 400 900 โˆ‘ 02650 ๐‘† ๐ด 2 = 2650 7โˆ’ 1 ยฟ 441.6666 Statistical Measures Measures of Dispersion Example 7:
  • 16.
    Group B 55 57 59 60 61 63 65 -5 - 3 - 1 0 1 3 5 25 9 1 0 1 9 25 โˆ‘ 070 ๐‘†๐ต 2 = 70 7 โˆ’1 ยฟ11.6666 Statistical Measures Measures of Dispersion Example 7:
  • 17.
    Standard Deviation Taking thesquare root of the variance, we get what is called the standard deviation, symbolized by S., and we find that the units of this scale are the same units of the original values ๐‘†=โˆš๐‘†2 ๐‘†๐ด=โˆš441.6666=21.01586 ๐‘†๐ต=โˆš11.6666=3.415650 Statistical Measures Measures of Dispersion standard deviation is the mean of difference between all elements of a group and the mean of this group.
  • 18.