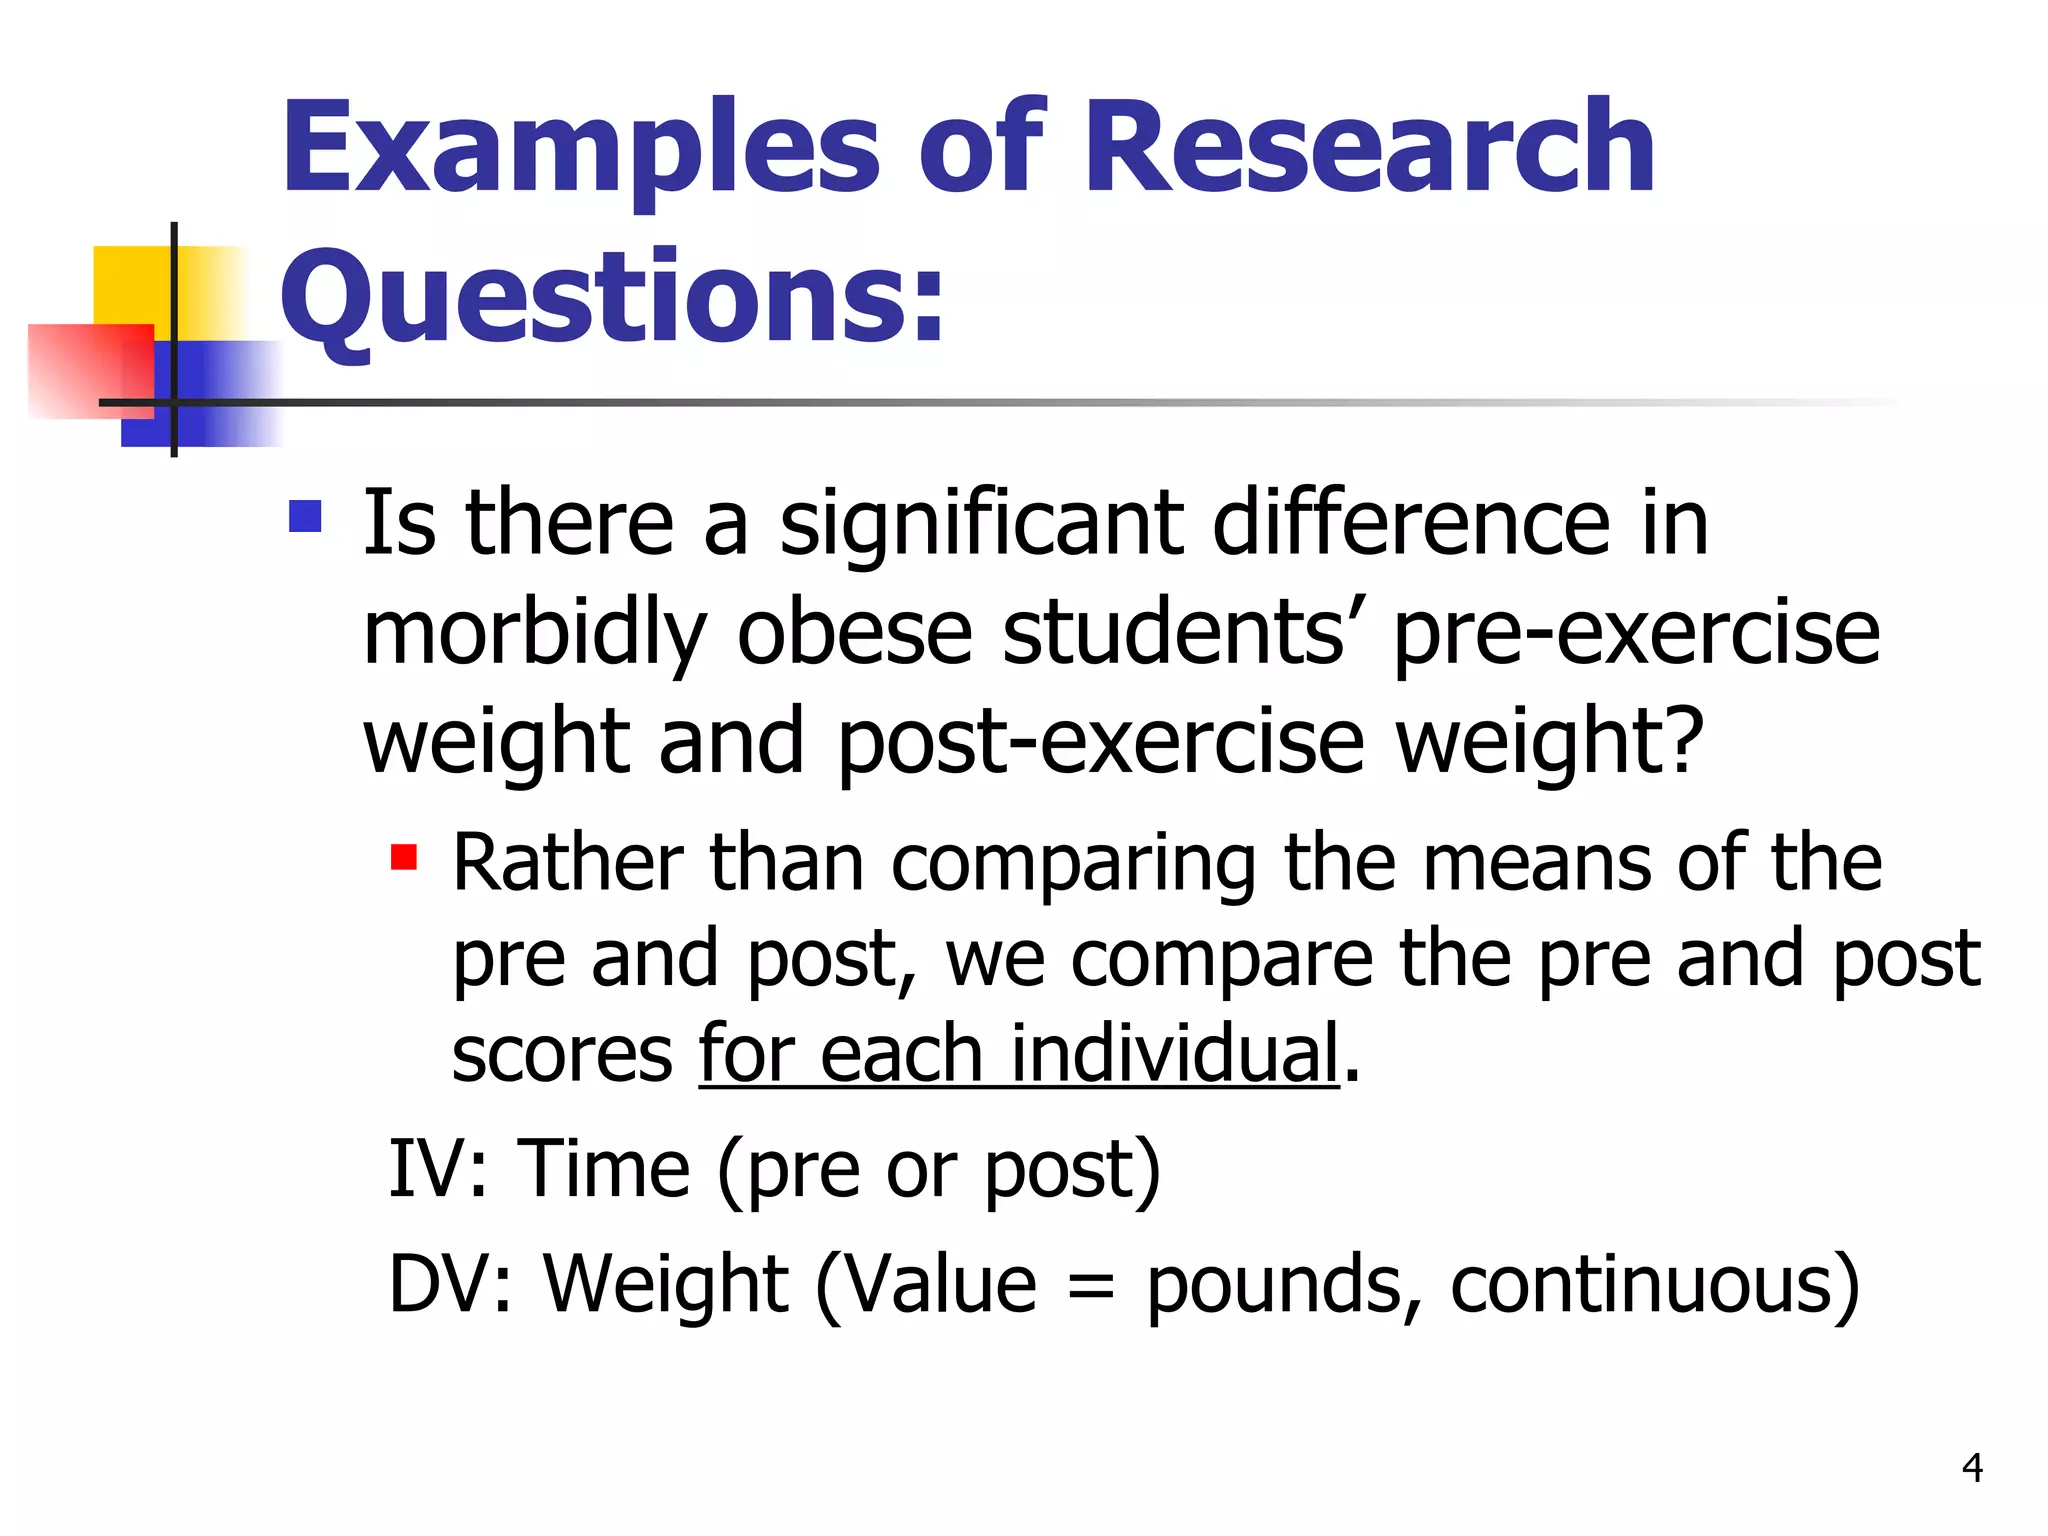
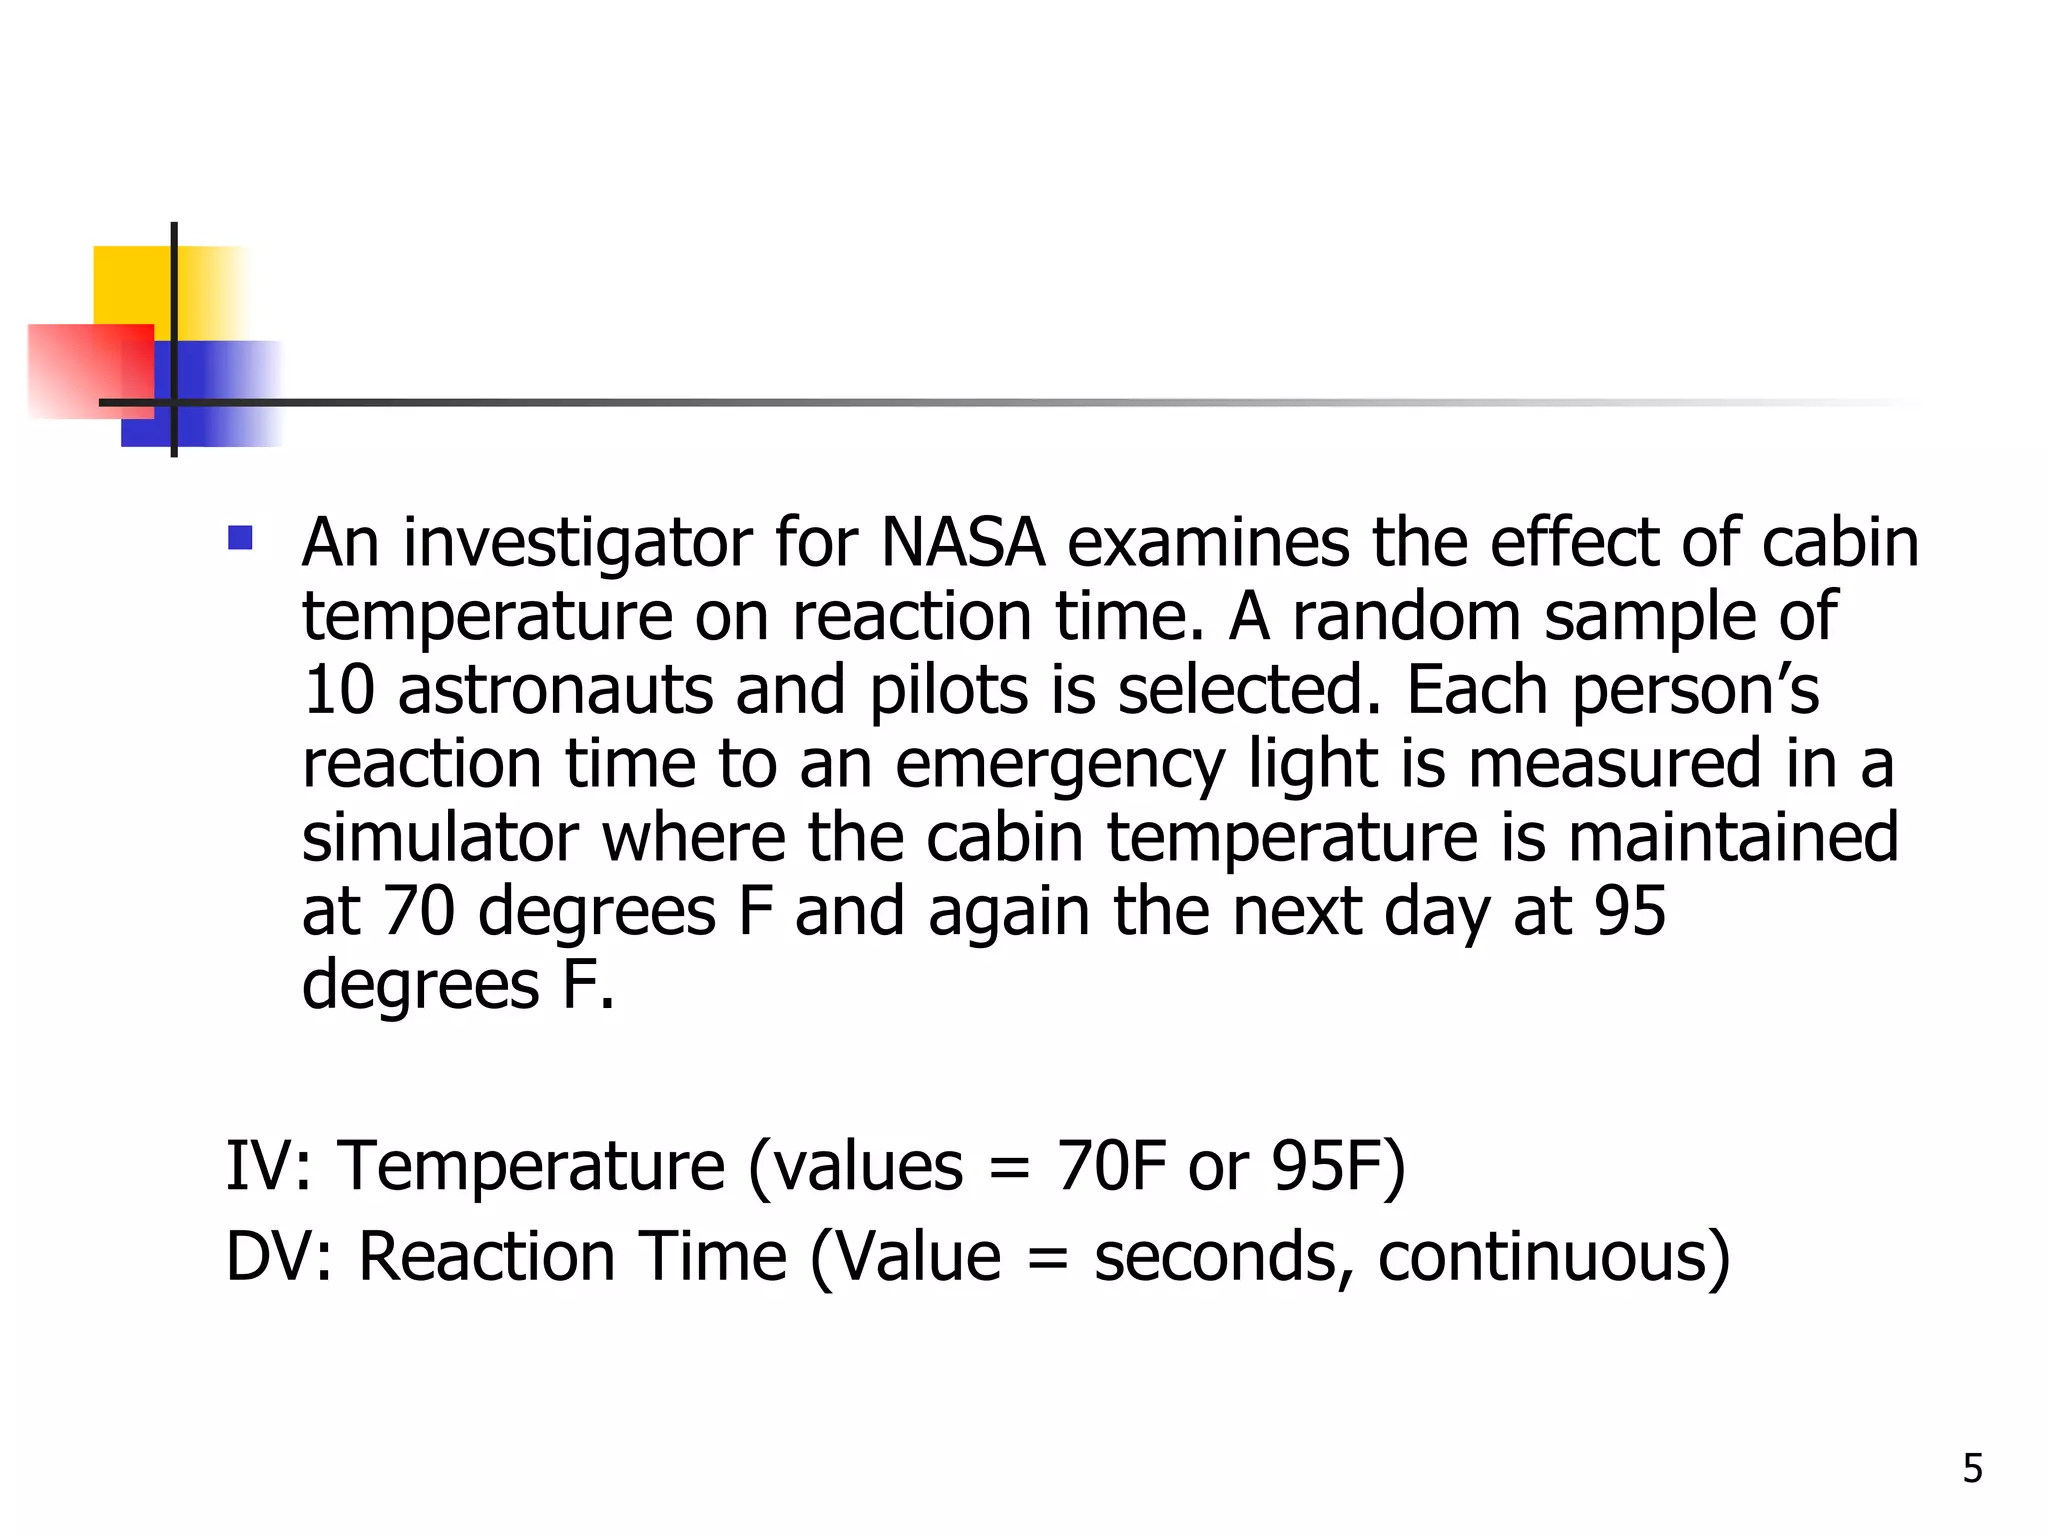
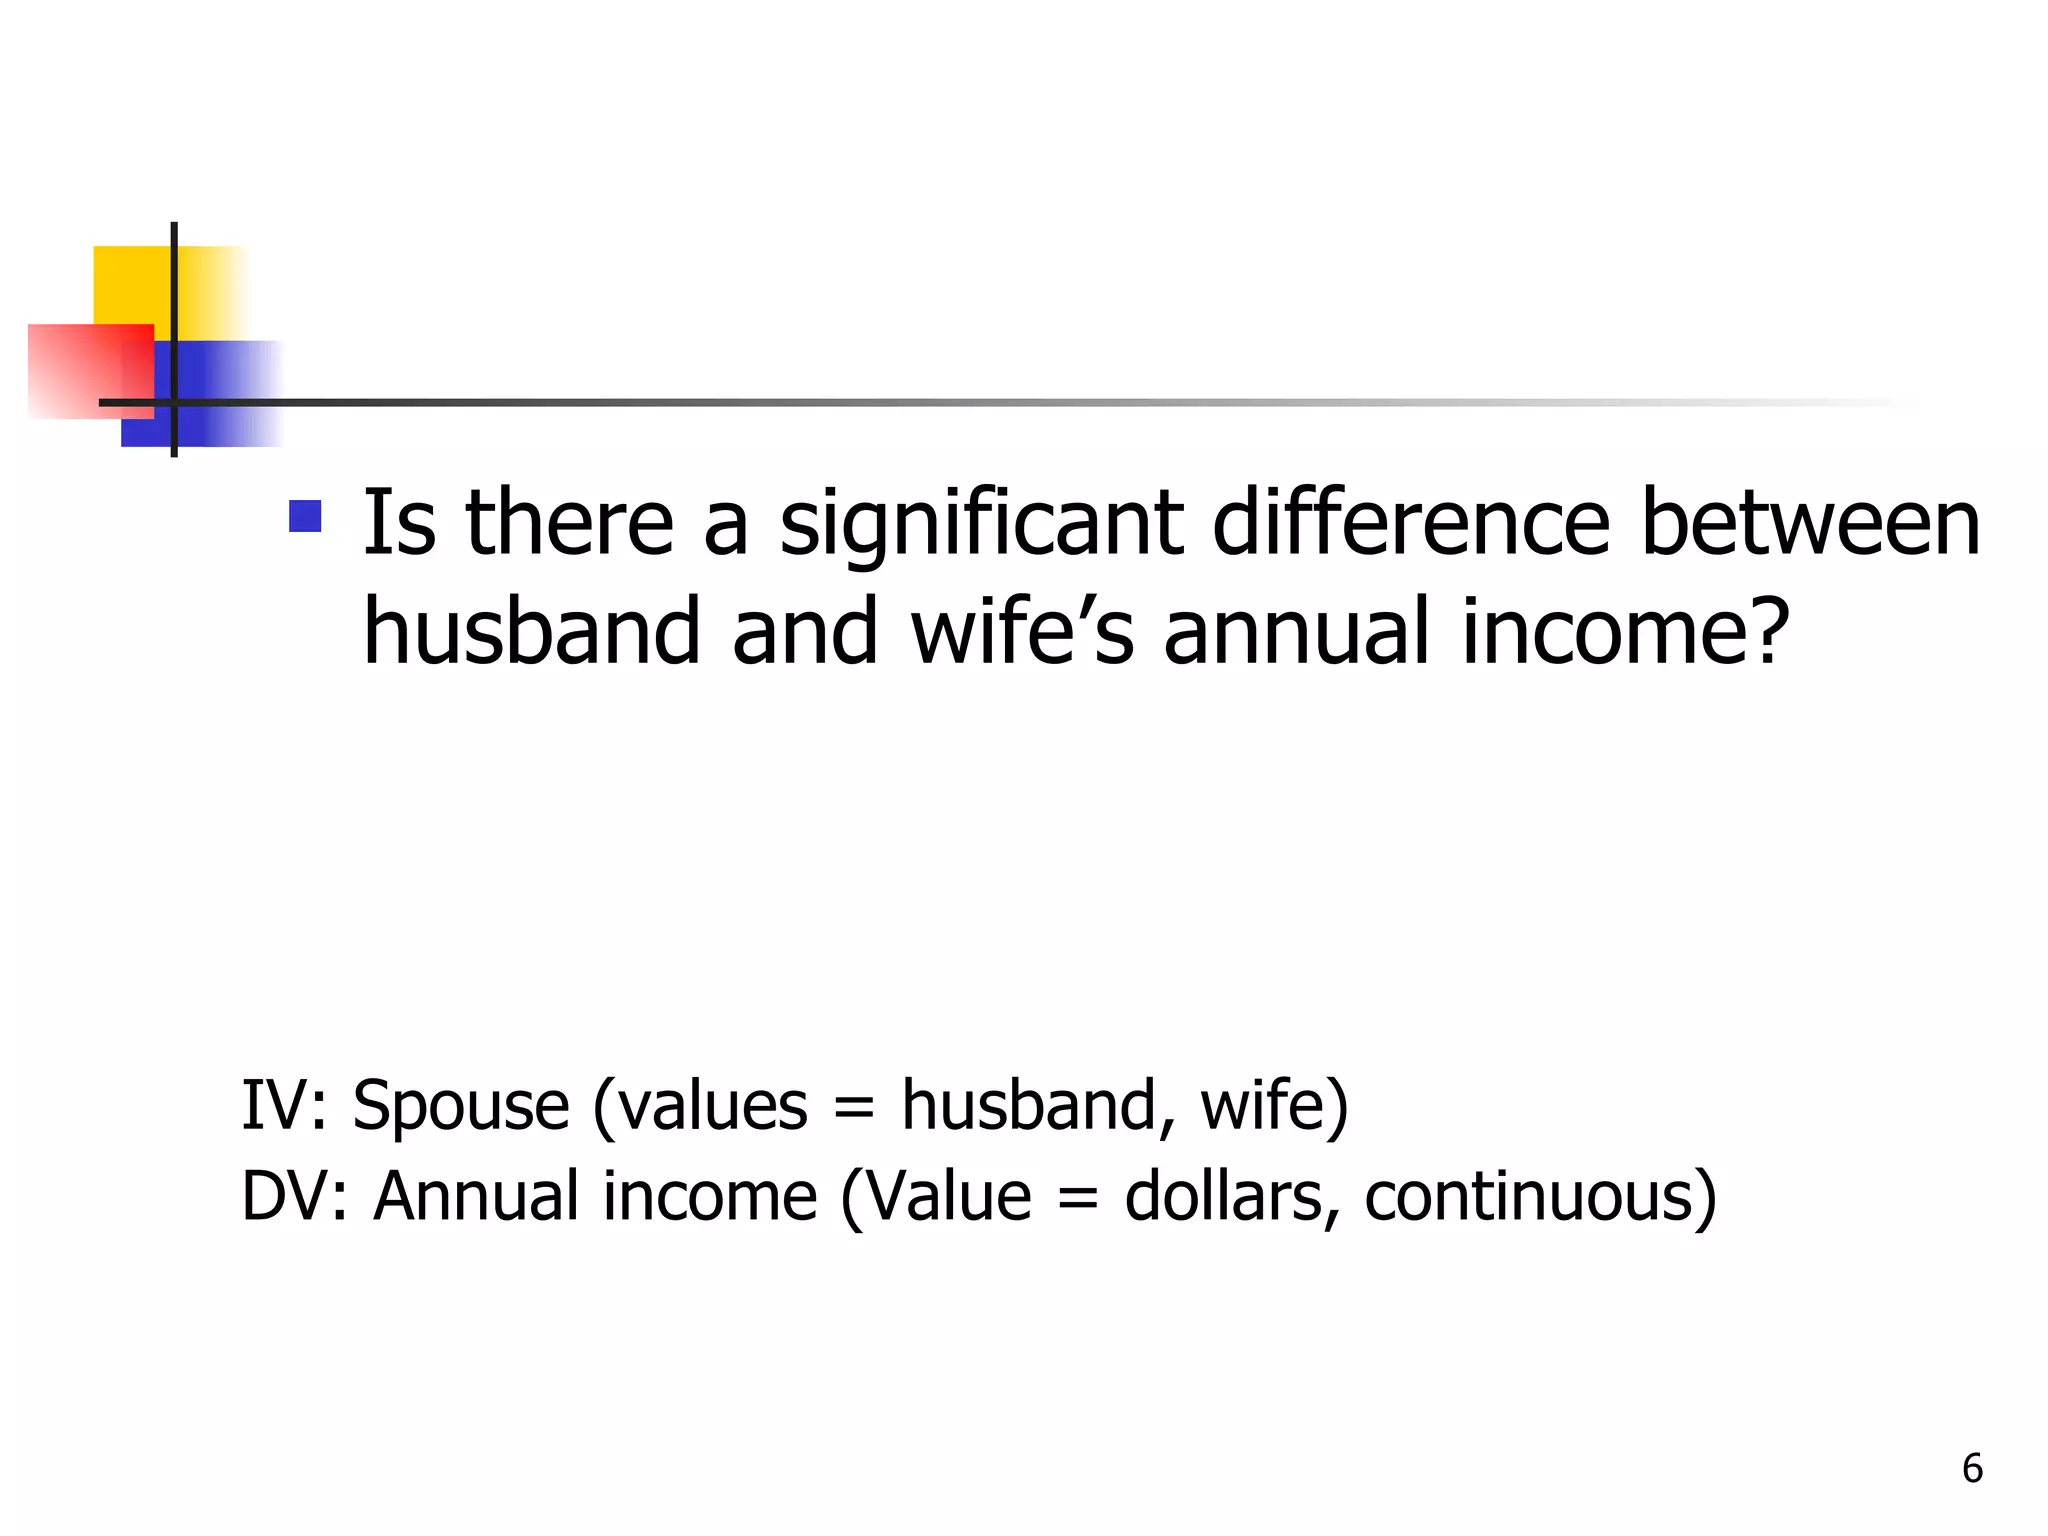
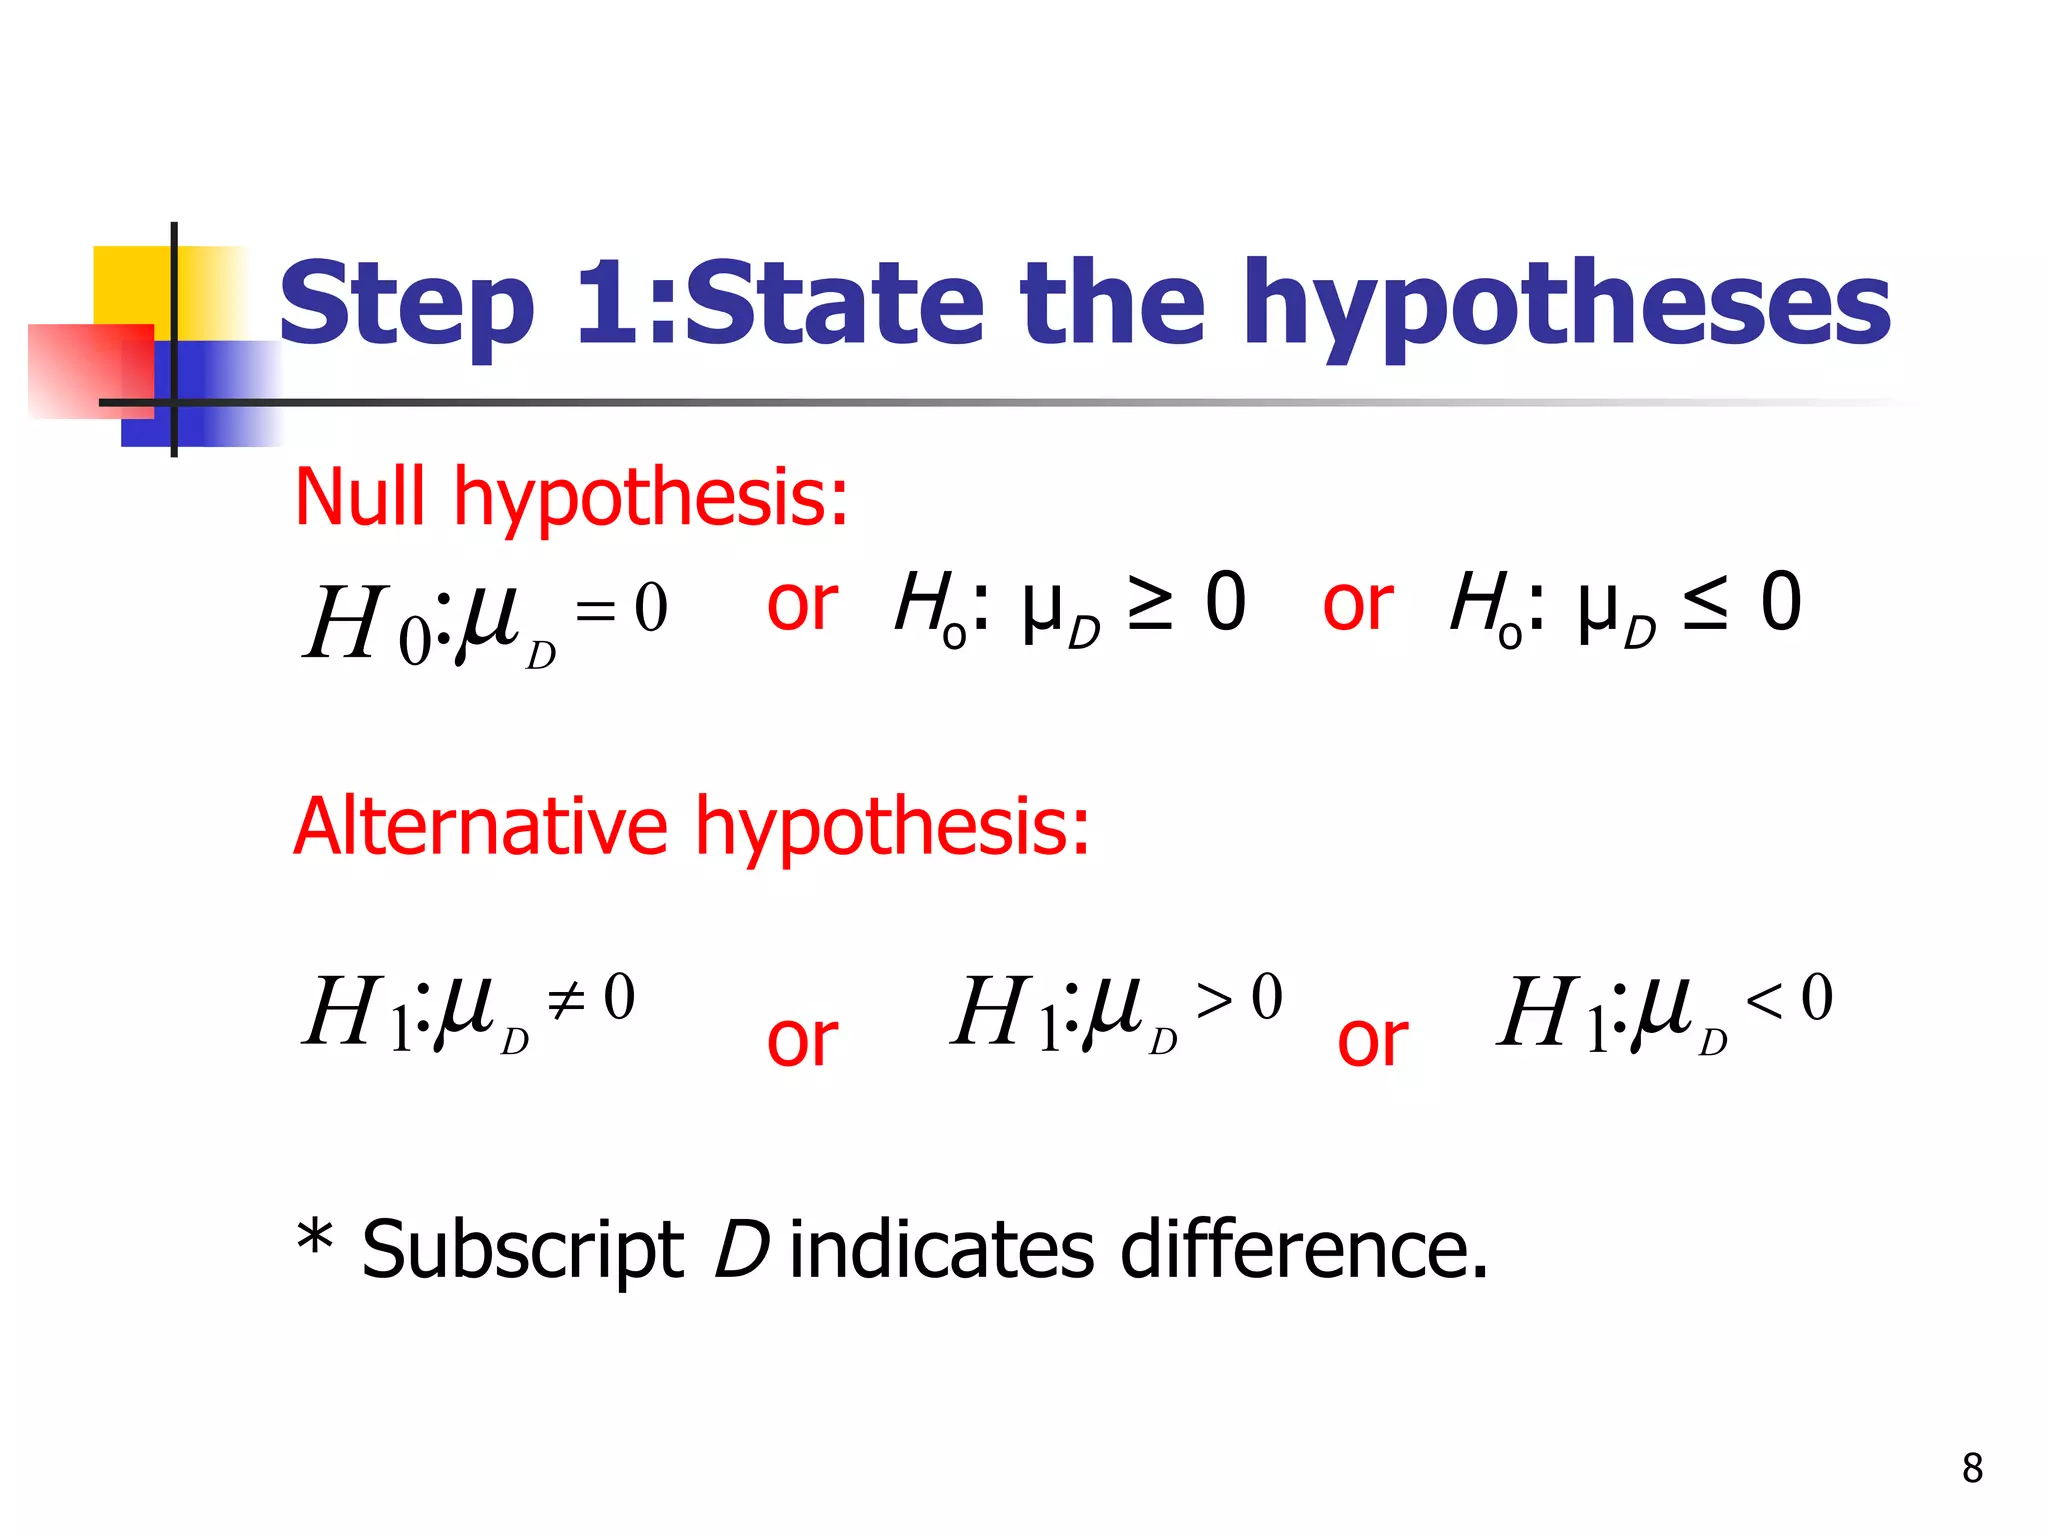
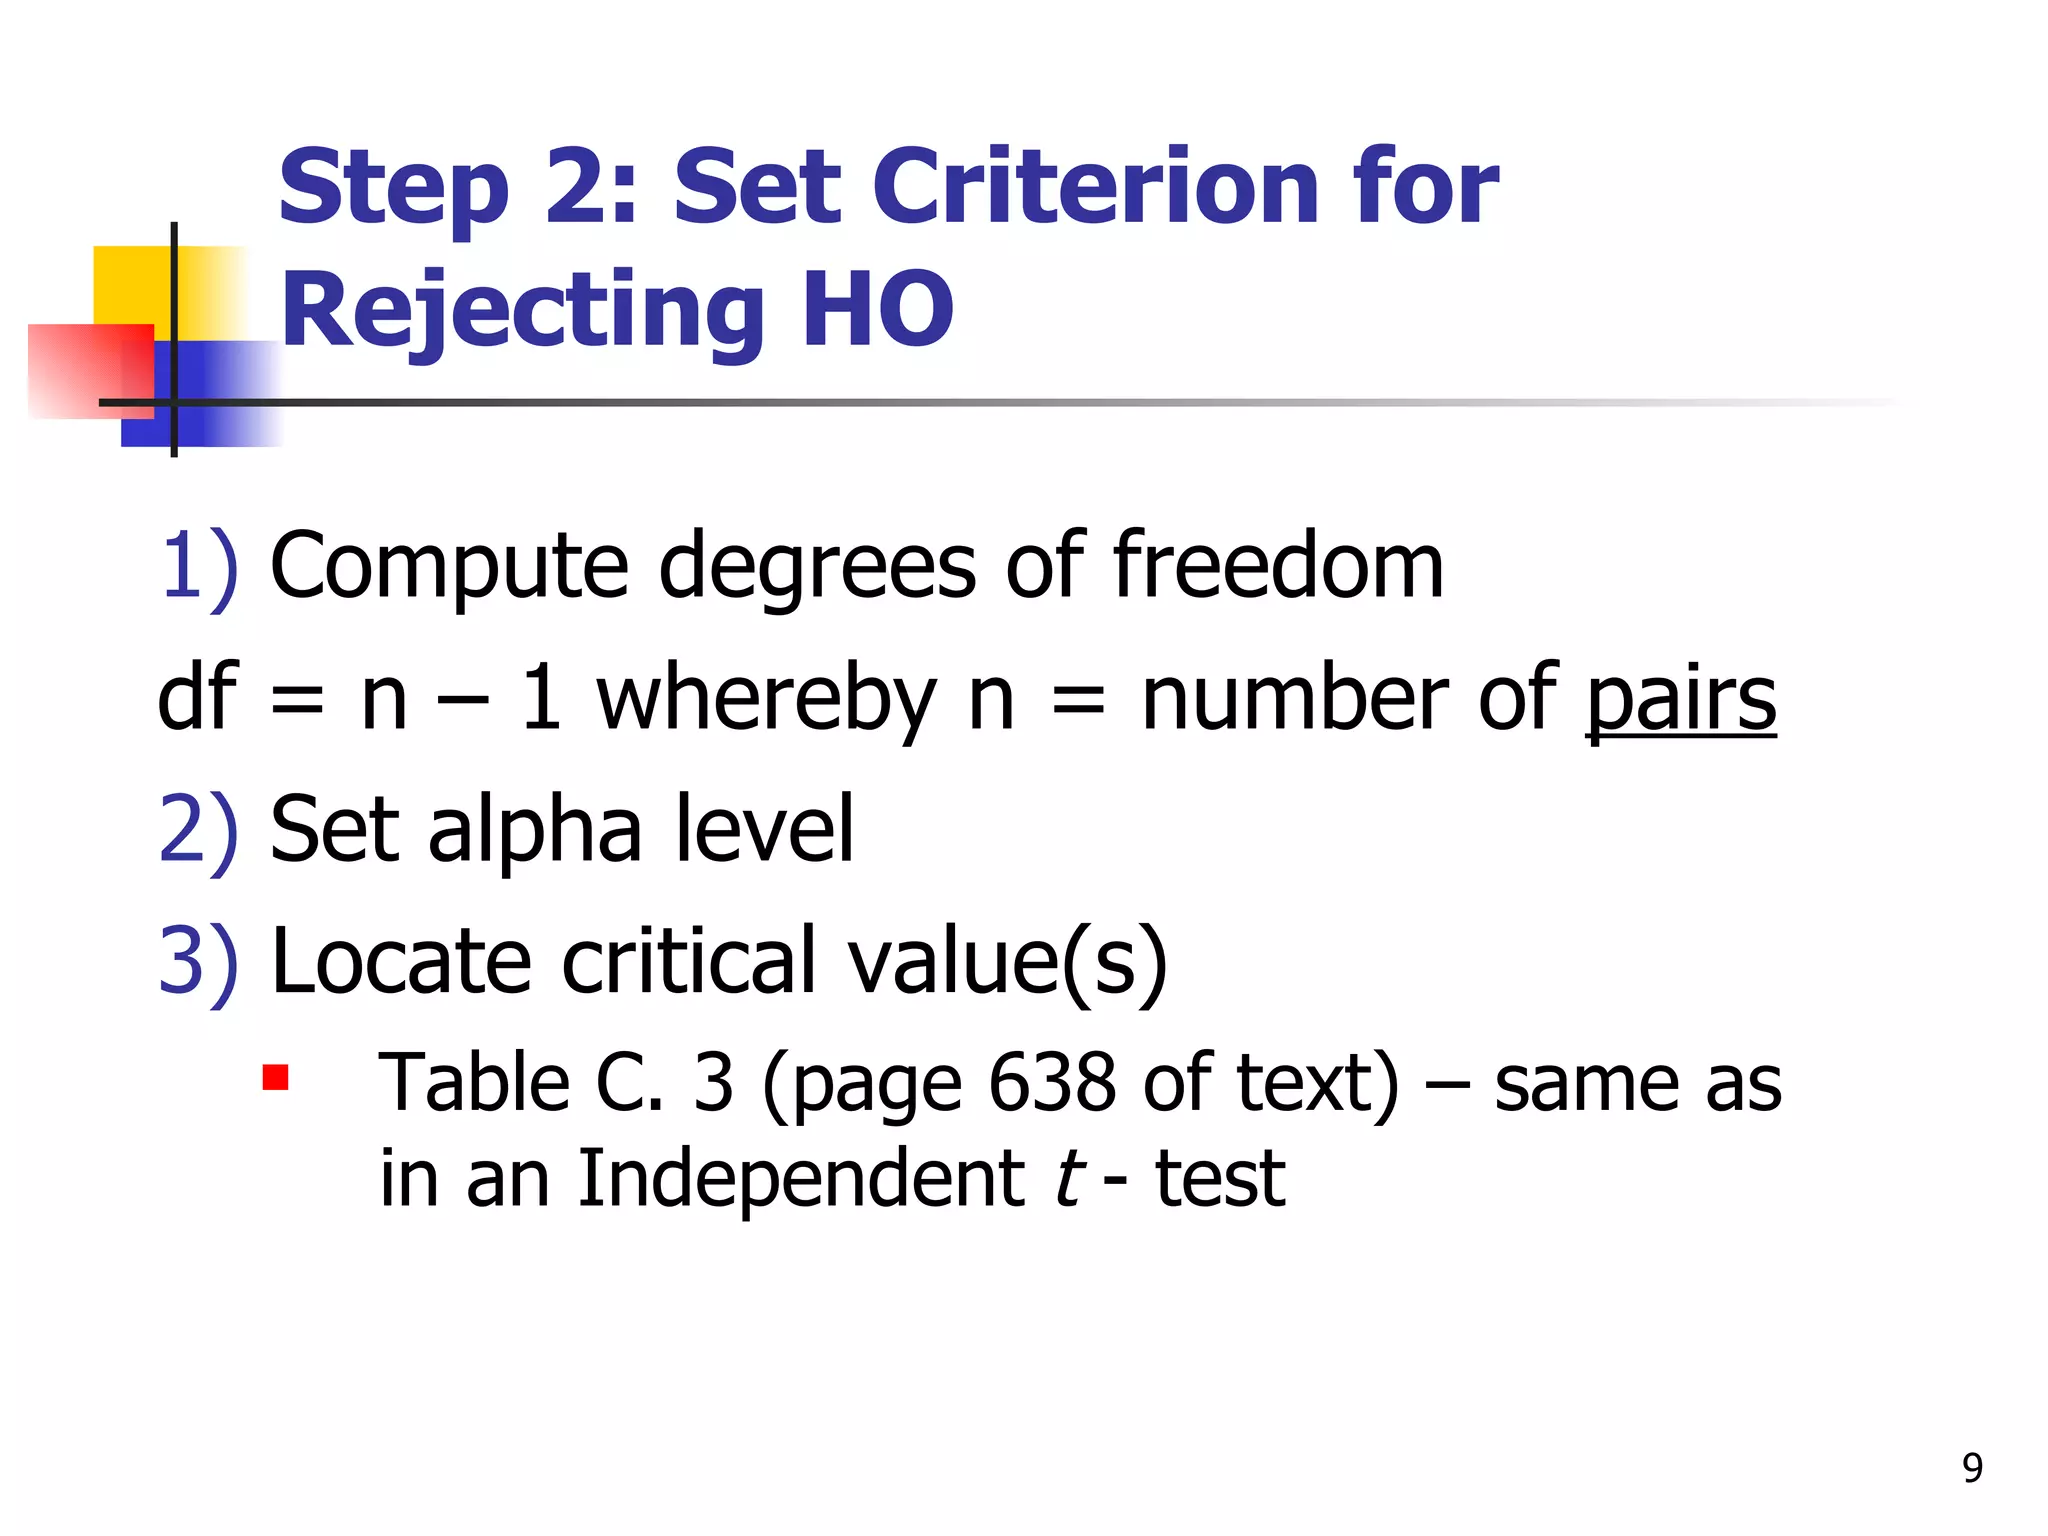
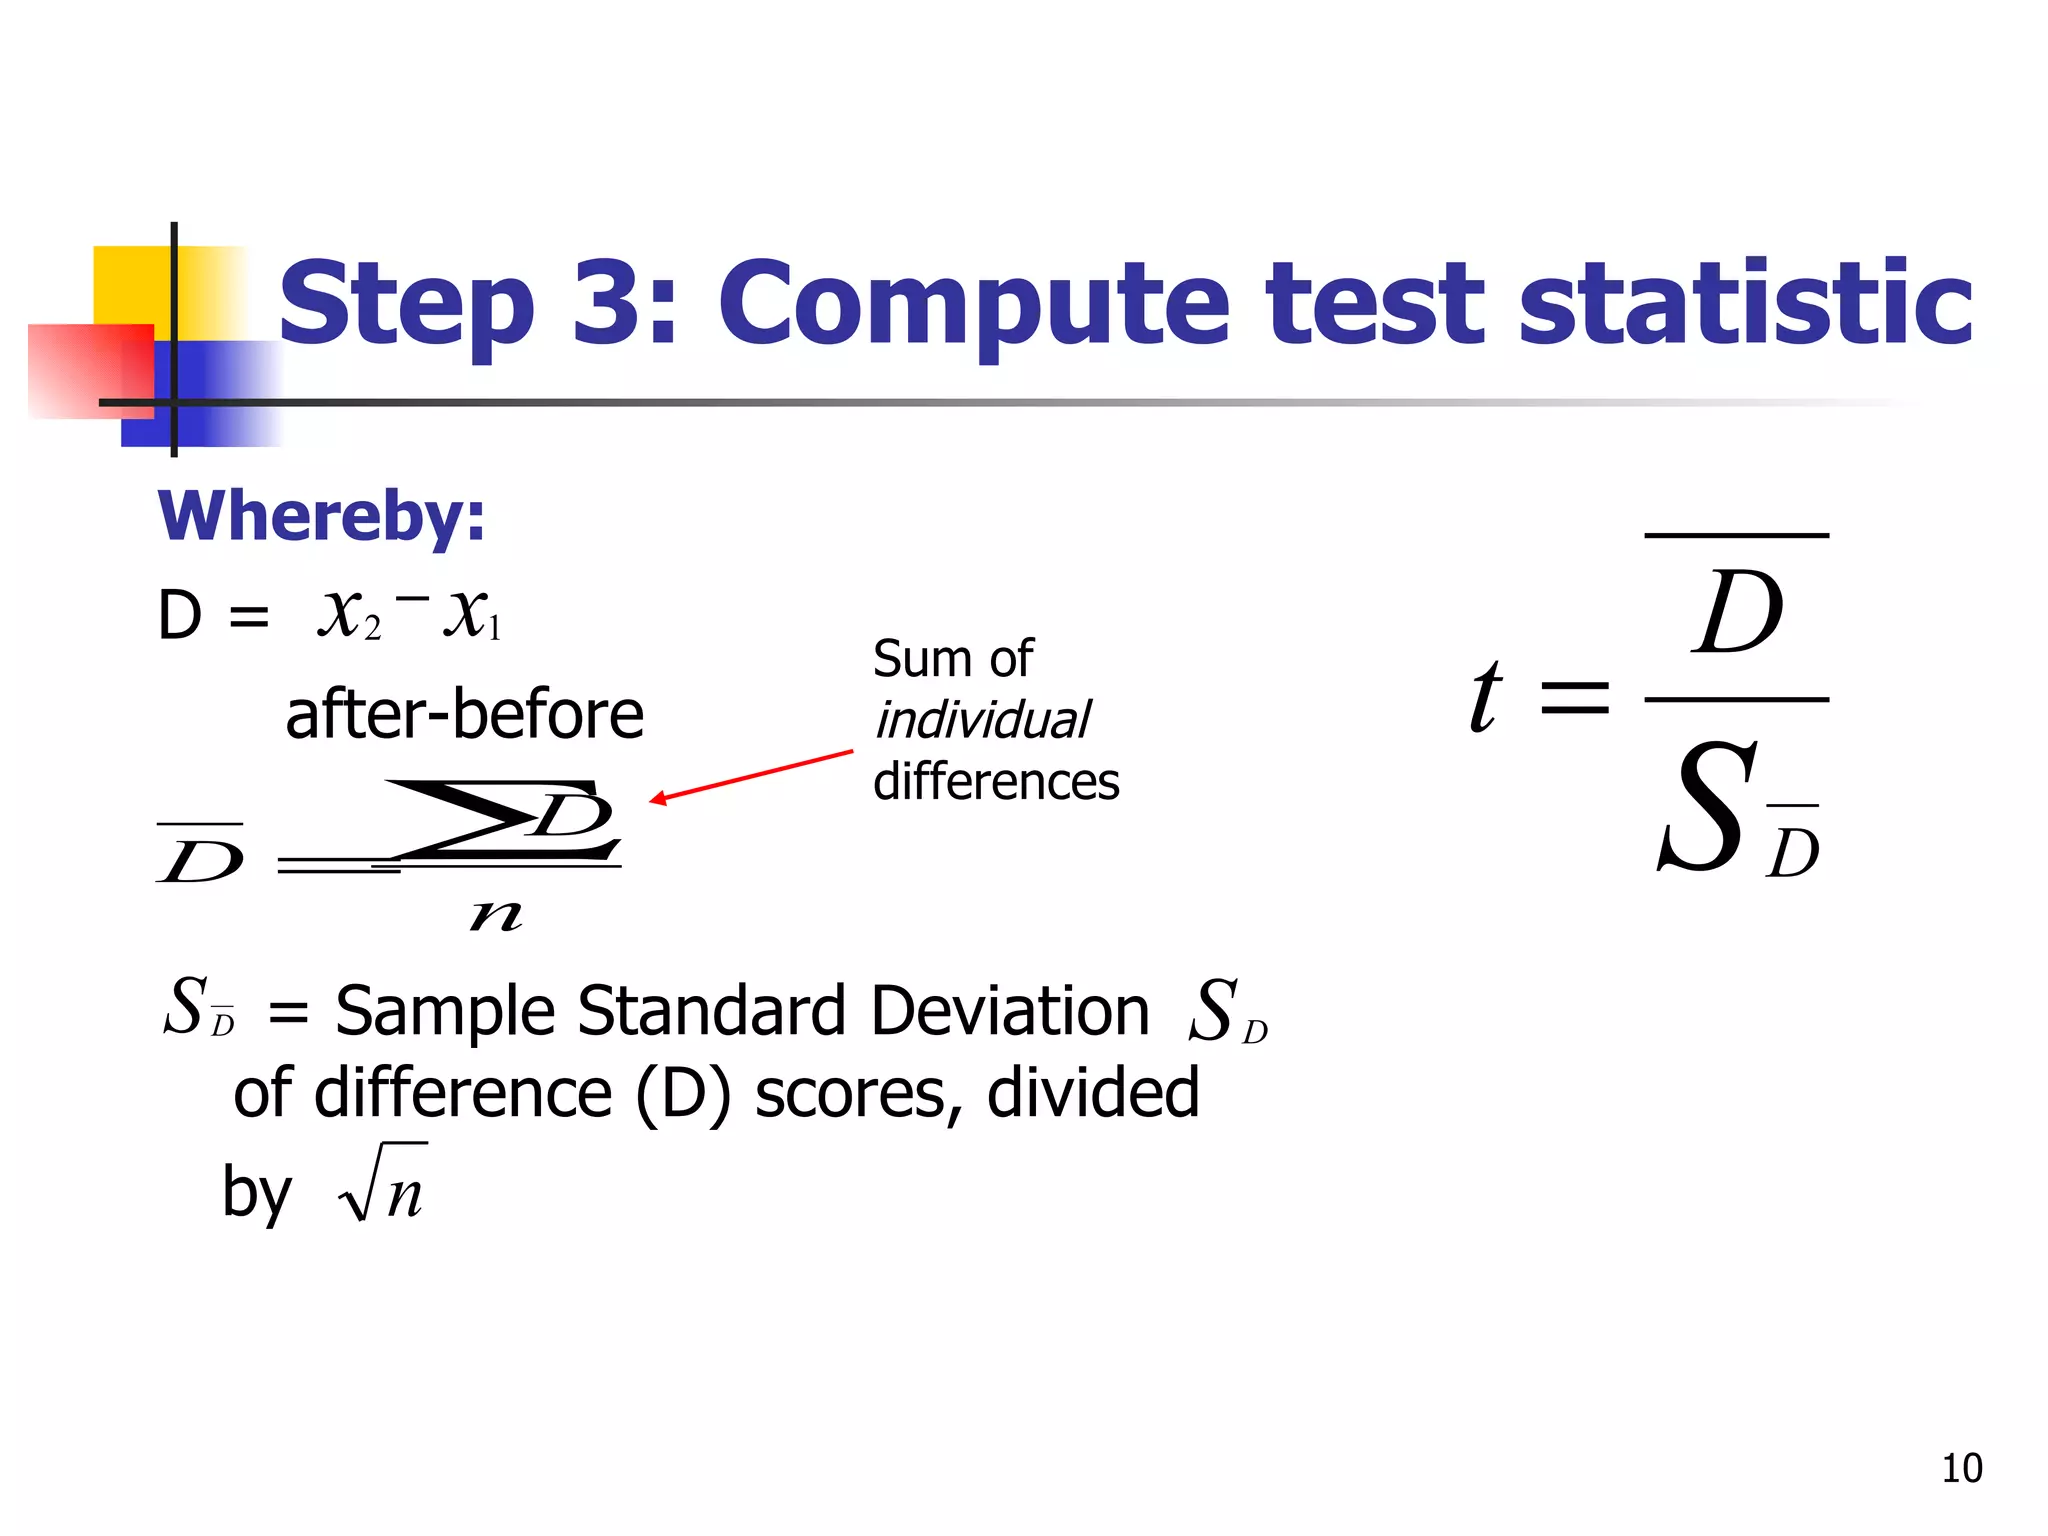
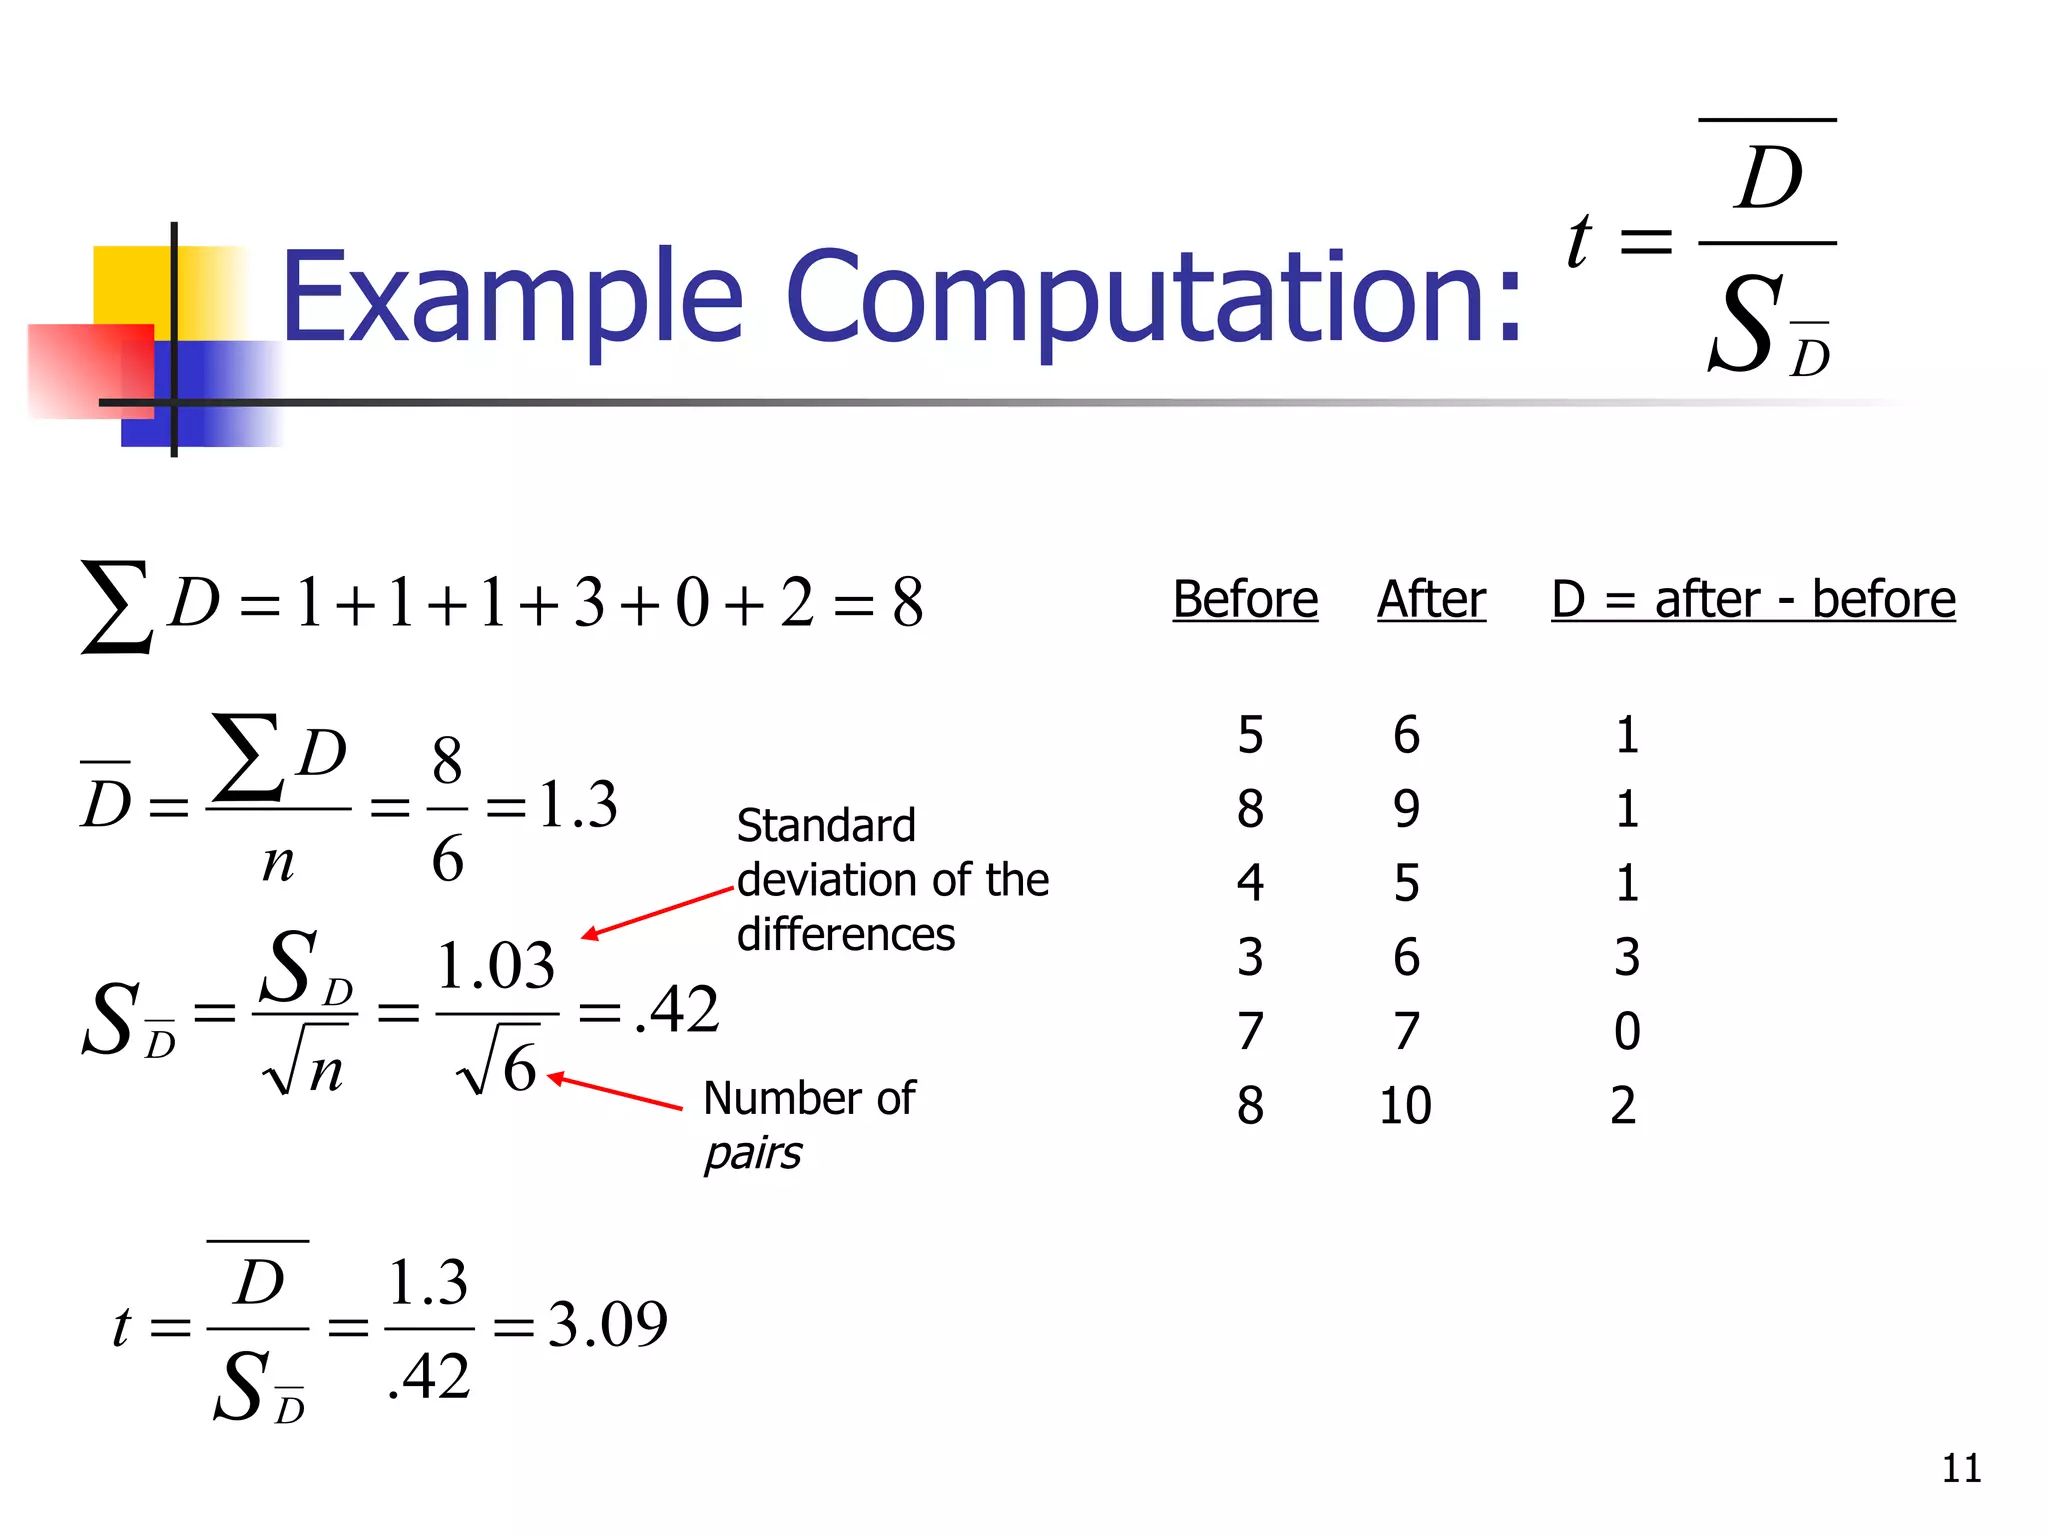
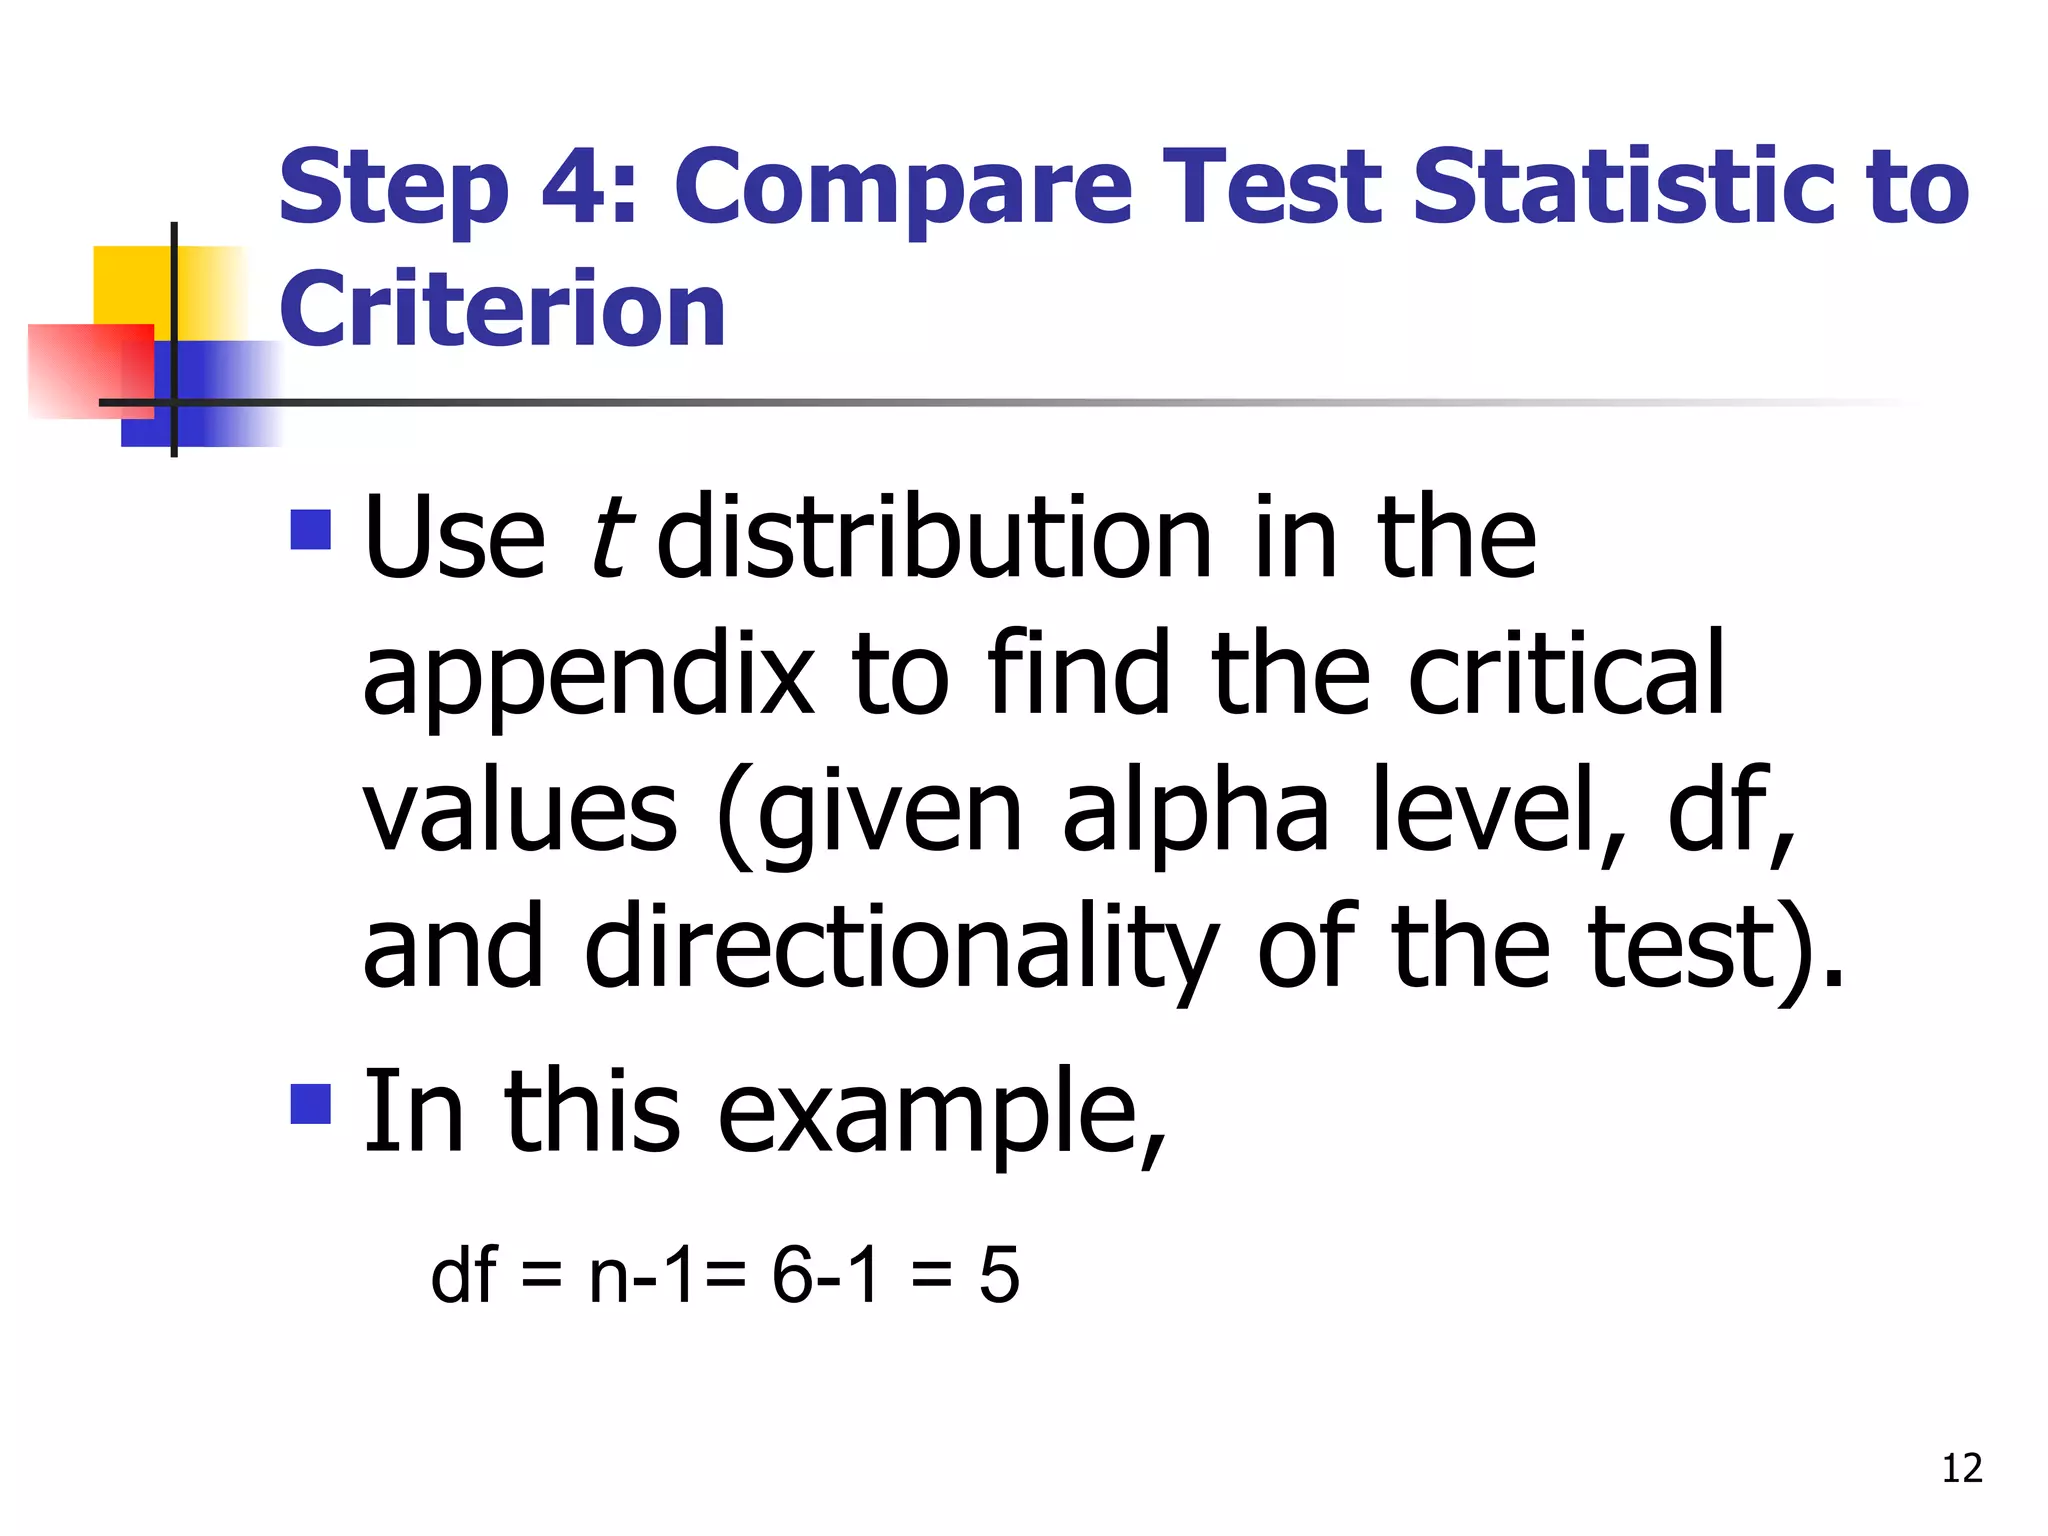
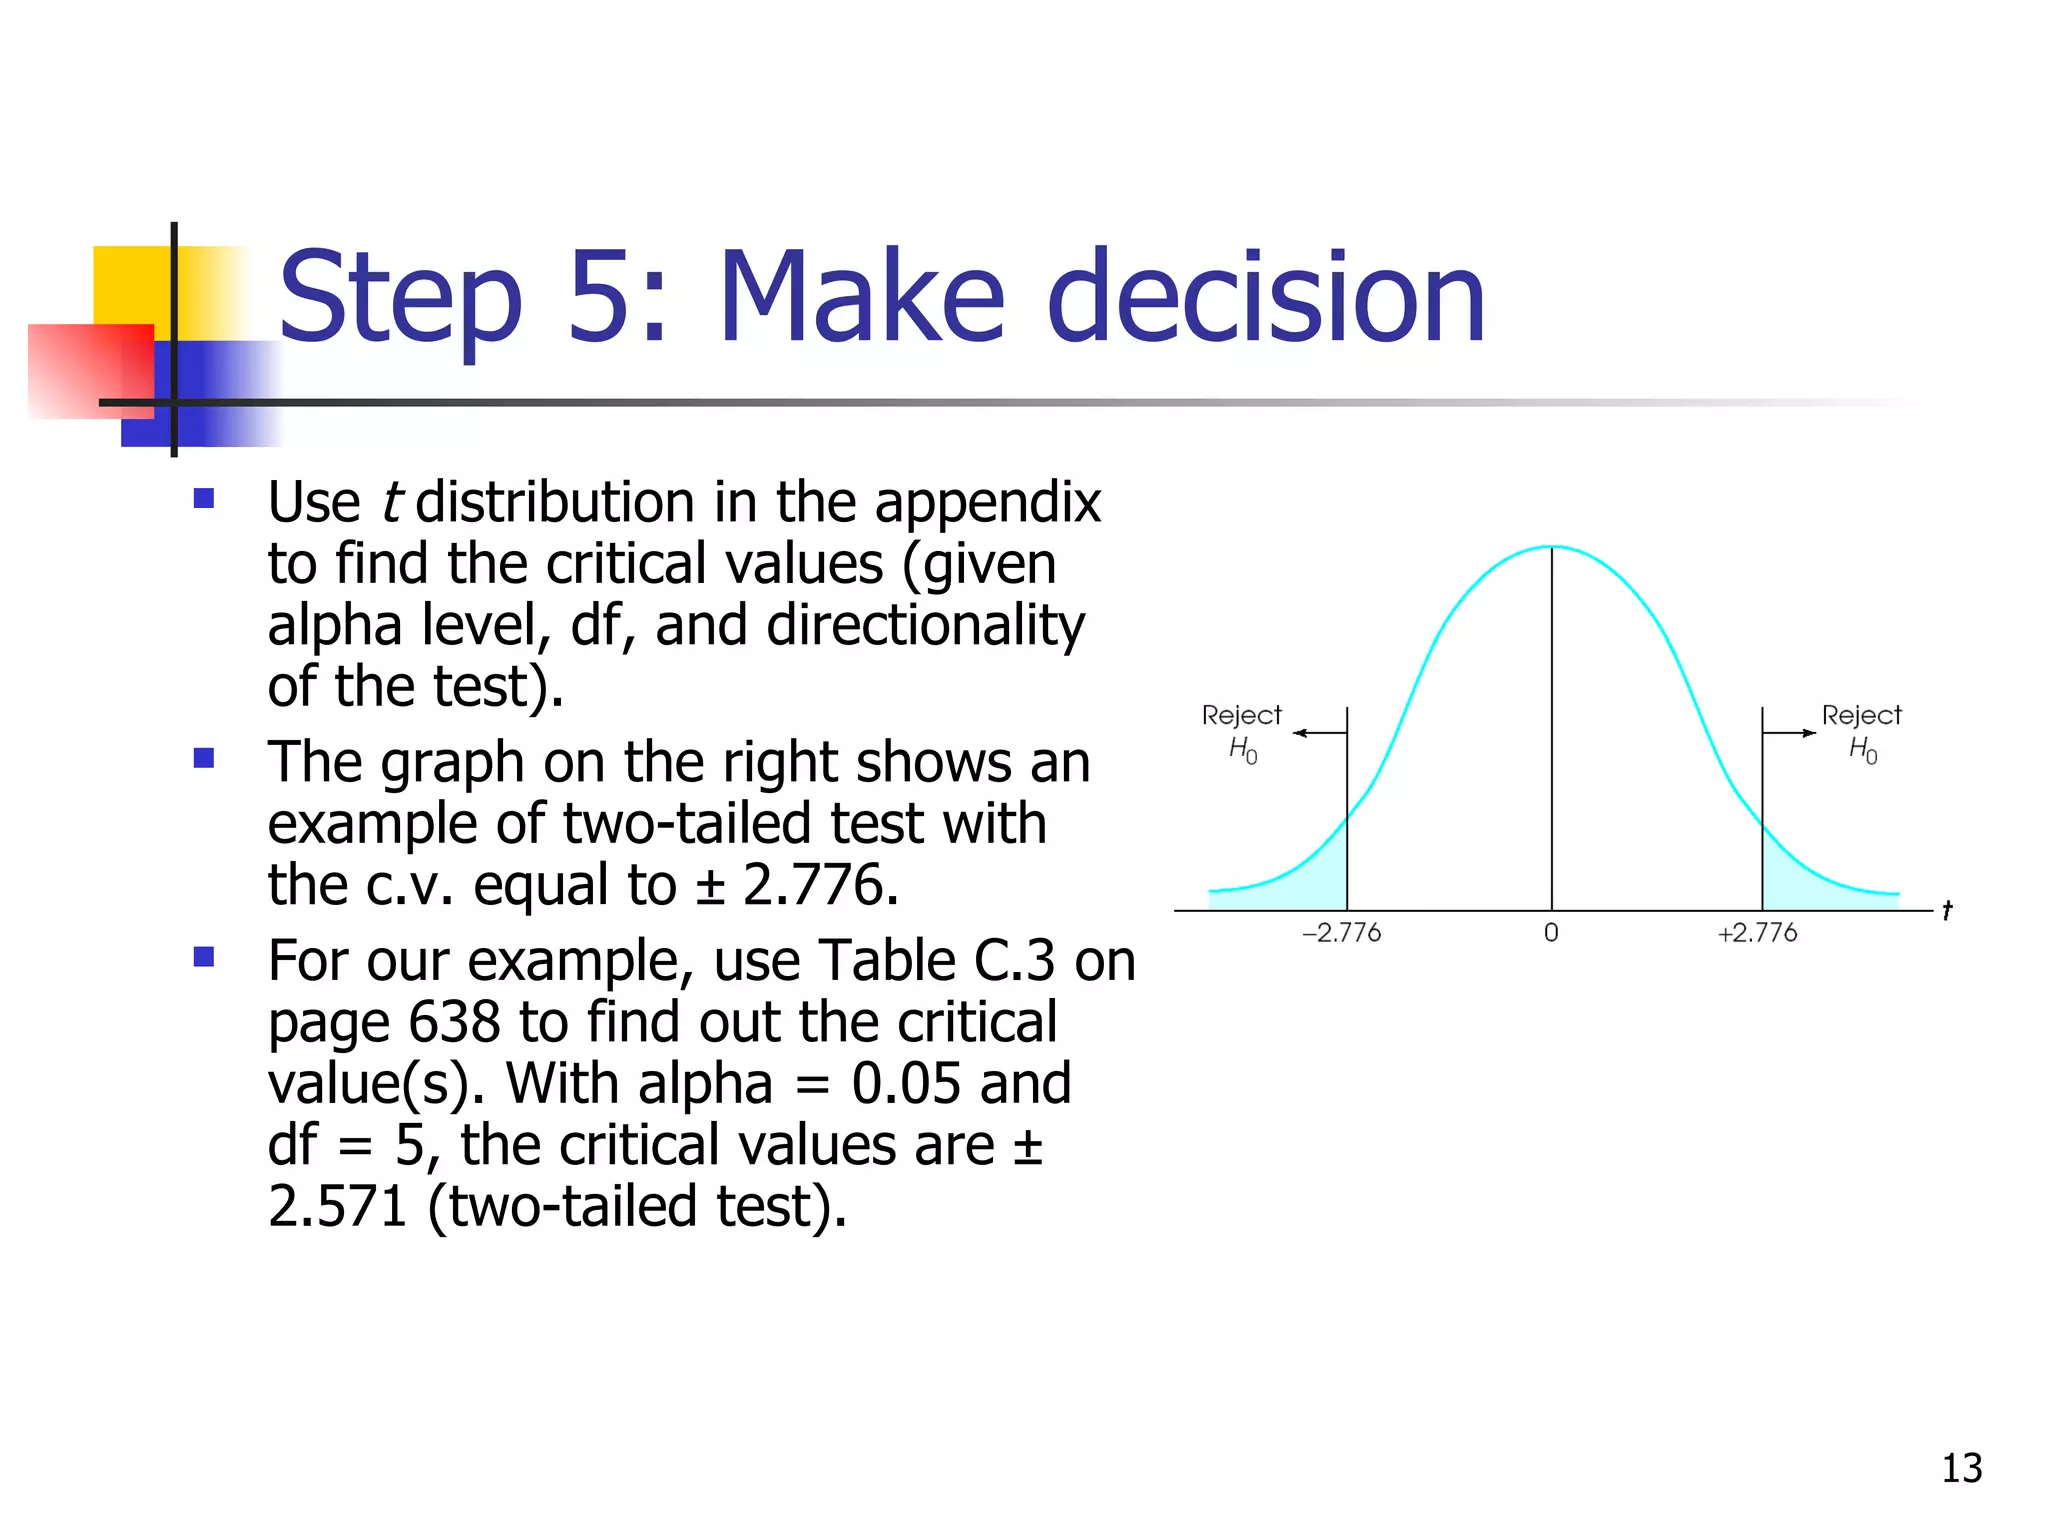
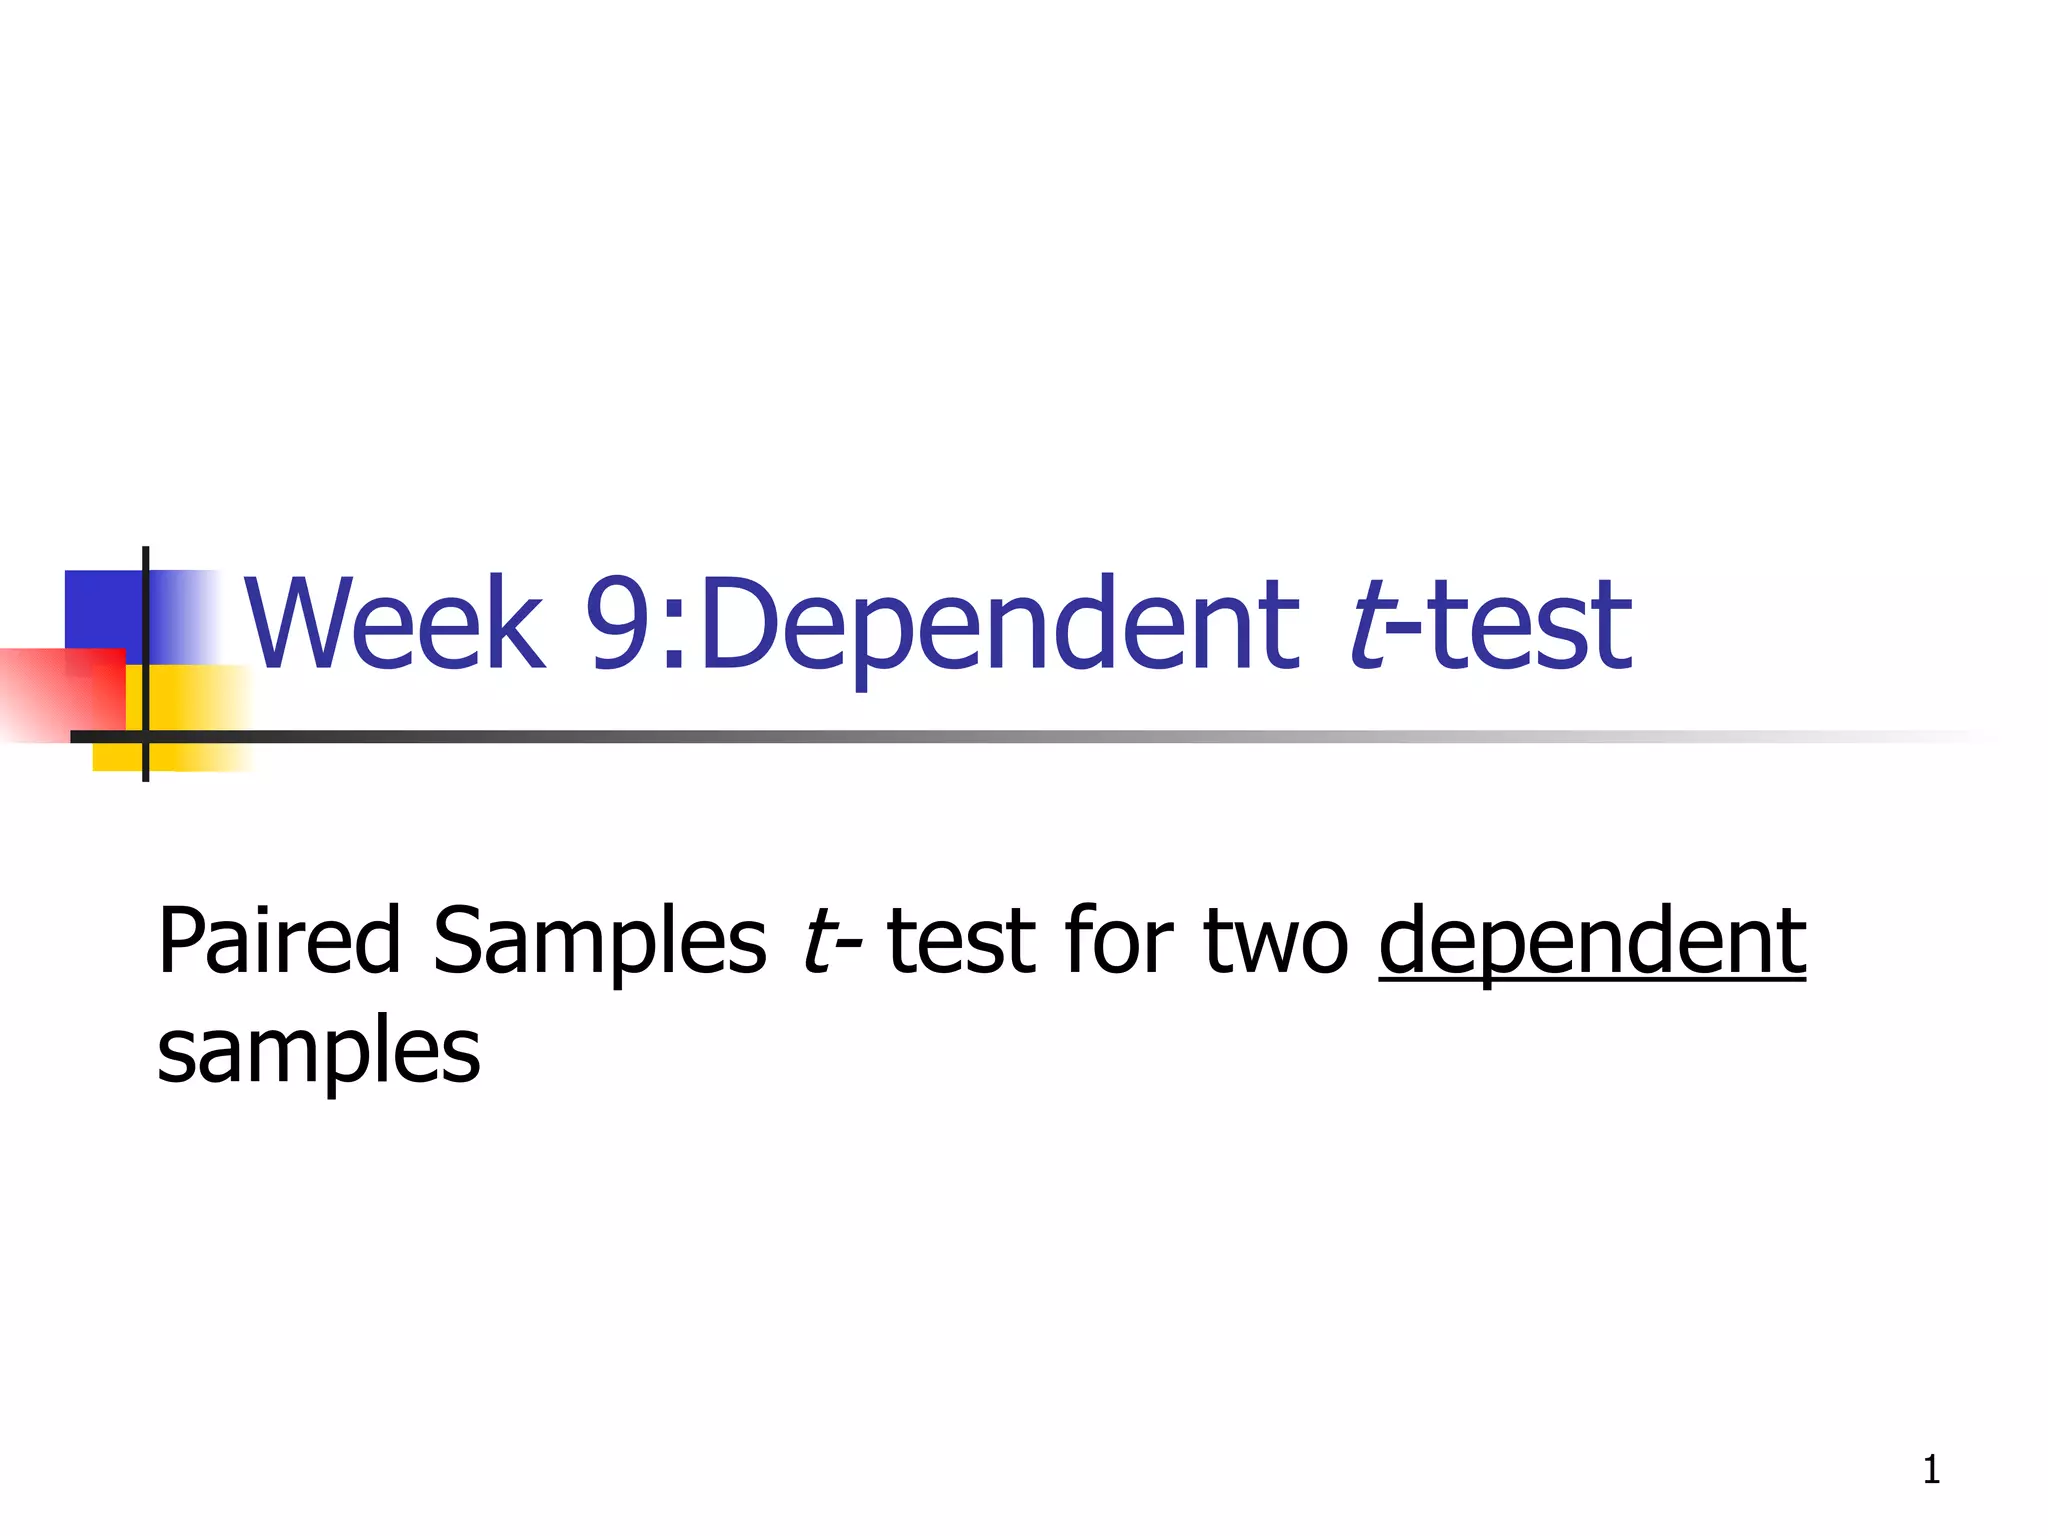
Week 9:Dependent t-test

Paired Samples t- test for two dependent
samples


                                           1
Dependent Samples
   When have two dependent or related
    samples.
•   Same group measured twice (Time 1 vs. Time
    2; Pretest and Posttest).
•   Samples are matched on some variable.
   Each score in one sample is paired with a
    specific score in the other sample.
   Such data are correlated data.


                                             2
Examples of Research
Questions:
 Is there a significant difference students’
  mathematics achievement when taught
  through traditional methods and hands-on
  problem-solving method?
IV = method taught (values = traditional
  [baseline], hands-on problem-solving)
DV = mathematics achievement (score,
  continuous)

                                                3
Examples of Research
Questions:
   Is there a significant difference in
    morbidly obese students’ pre-exercise
    weight and post-exercise weight?
     Rather than comparing the means of the
      pre and post, we compare the pre and post
      scores for each individual.
    IV: Time (pre or post)
    DV: Weight (Value = pounds, continuous)

                                              4
   An investigator for NASA examines the effect of cabin
    temperature on reaction time. A random sample of
    10 astronauts and pilots is selected. Each person’s
    reaction time to an emergency light is measured in a
    simulator where the cabin temperature is maintained
    at 70 degrees F and again the next day at 95
    degrees F.

IV: Temperature (values = 70F or 95F)
DV: Reaction Time (Value = seconds, continuous)

                                                            5
   Is there a significant difference between
     husband and wife’s annual income?


IV: Spouse (values = husband, wife)
DV: Annual income (Value = dollars, continuous)


                                                  6
Steps in hypothesis testing:


                               7
Step 1:State the hypotheses
Null hypothesis:
H 0:µ D = 0 or Ho: µD ≥ 0 or Ho: µD ≤ 0
Alternative hypothesis:

H 1:µ   D
            ≠0
                 or   H 1:µ   D
                                  >0
                                       or   H 1:µ   D
                                                        <0


* Subscript D indicates difference.

                                                             8
Step 2: Set Criterion for
  Rejecting HO

1) Compute degrees of freedom
df = n – 1 whereby n = number of pairs
2) Set alpha level
3) Locate critical value(s)
     Table C. 3 (page 638 of text) – same as
      in an Independent t - test


                                                9
Step 3: Compute test statistic
Whereby:
D = x2 − x1                               D
   after-before
                      Sum of
                      individual     t=
D    =
      ∑D
         n
                      differences
                                          S   D

S = Sample Standard Deviation S D
 D

 of difference (D) scores, divided
 by n


                                                  10
D
                                                                     t=
            Example Computation:                                           S   D


∑ D = 1+1+1+ 3 + 0 + 2 = 8                          Before   After   D = after - before


D=
   ∑ D = 8 = 1.3                 Standard
                                                      5
                                                      8
                                                              6
                                                              9
                                                                       1
                                                                       1
         n          6            deviation of the     4       5        1
                                 differences
        =S
                    1.03                              3       6        3
S   D
                D

                n
                  =
                      6
                         = .42                        7       7        0
                             Number of                8      10        2
                                pairs

        D         1 .3
t=              =      = 3.09
        S   D
                  .42
                                                                                      11
Step 4: Compare Test Statistic to
Criterion

 Use t distribution in the
  appendix to find the critical
  values (given alpha level, df,
  and directionality of the test).
 In this example,

    df = n-1= 6-1 = 5

                                     12
Step 5: Make decision
   Use t distribution in the appendix
    to find the critical values (given
    alpha level, df, and directionality
    of the test).
   The graph on the right shows an
    example of two-tailed test with
    the c.v. equal to ± 2.776.
   For our example, use Table C.3 on
    page 638 to find out the critical
    value(s). With alpha = 0.05 and
    df = 5, the critical values are ±
    2.571 (two-tailed test).


                                          13

Dependent T Test

  • 1.
    Week 9:Dependent t-test PairedSamples t- test for two dependent samples 1
  • 2.
    Dependent Samples  When have two dependent or related samples. • Same group measured twice (Time 1 vs. Time 2; Pretest and Posttest). • Samples are matched on some variable.  Each score in one sample is paired with a specific score in the other sample.  Such data are correlated data. 2
  • 3.
    Examples of Research Questions: Is there a significant difference students’ mathematics achievement when taught through traditional methods and hands-on problem-solving method? IV = method taught (values = traditional [baseline], hands-on problem-solving) DV = mathematics achievement (score, continuous) 3
  • 4.
    Examples of Research Questions:  Is there a significant difference in morbidly obese students’ pre-exercise weight and post-exercise weight?  Rather than comparing the means of the pre and post, we compare the pre and post scores for each individual. IV: Time (pre or post) DV: Weight (Value = pounds, continuous) 4
  • 5.
    An investigator for NASA examines the effect of cabin temperature on reaction time. A random sample of 10 astronauts and pilots is selected. Each person’s reaction time to an emergency light is measured in a simulator where the cabin temperature is maintained at 70 degrees F and again the next day at 95 degrees F. IV: Temperature (values = 70F or 95F) DV: Reaction Time (Value = seconds, continuous) 5
  • 6.
    Is there a significant difference between husband and wife’s annual income? IV: Spouse (values = husband, wife) DV: Annual income (Value = dollars, continuous) 6
  • 7.
  • 8.
    Step 1:State thehypotheses Null hypothesis: H 0:µ D = 0 or Ho: µD ≥ 0 or Ho: µD ≤ 0 Alternative hypothesis: H 1:µ D ≠0 or H 1:µ D >0 or H 1:µ D <0 * Subscript D indicates difference. 8
  • 9.
    Step 2: SetCriterion for Rejecting HO 1) Compute degrees of freedom df = n – 1 whereby n = number of pairs 2) Set alpha level 3) Locate critical value(s)  Table C. 3 (page 638 of text) – same as in an Independent t - test 9
  • 10.
    Step 3: Computetest statistic Whereby: D = x2 − x1 D after-before Sum of individual t= D = ∑D n differences S D S = Sample Standard Deviation S D D of difference (D) scores, divided by n 10
  • 11.
    D t= Example Computation: S D ∑ D = 1+1+1+ 3 + 0 + 2 = 8 Before After D = after - before D= ∑ D = 8 = 1.3 Standard 5 8 6 9 1 1 n 6 deviation of the 4 5 1 differences =S 1.03 3 6 3 S D D n = 6 = .42 7 7 0 Number of 8 10 2 pairs D 1 .3 t= = = 3.09 S D .42 11
  • 12.
    Step 4: CompareTest Statistic to Criterion  Use t distribution in the appendix to find the critical values (given alpha level, df, and directionality of the test).  In this example, df = n-1= 6-1 = 5 12
  • 13.
    Step 5: Makedecision  Use t distribution in the appendix to find the critical values (given alpha level, df, and directionality of the test).  The graph on the right shows an example of two-tailed test with the c.v. equal to ± 2.776.  For our example, use Table C.3 on page 638 to find out the critical value(s). With alpha = 0.05 and df = 5, the critical values are ± 2.571 (two-tailed test). 13