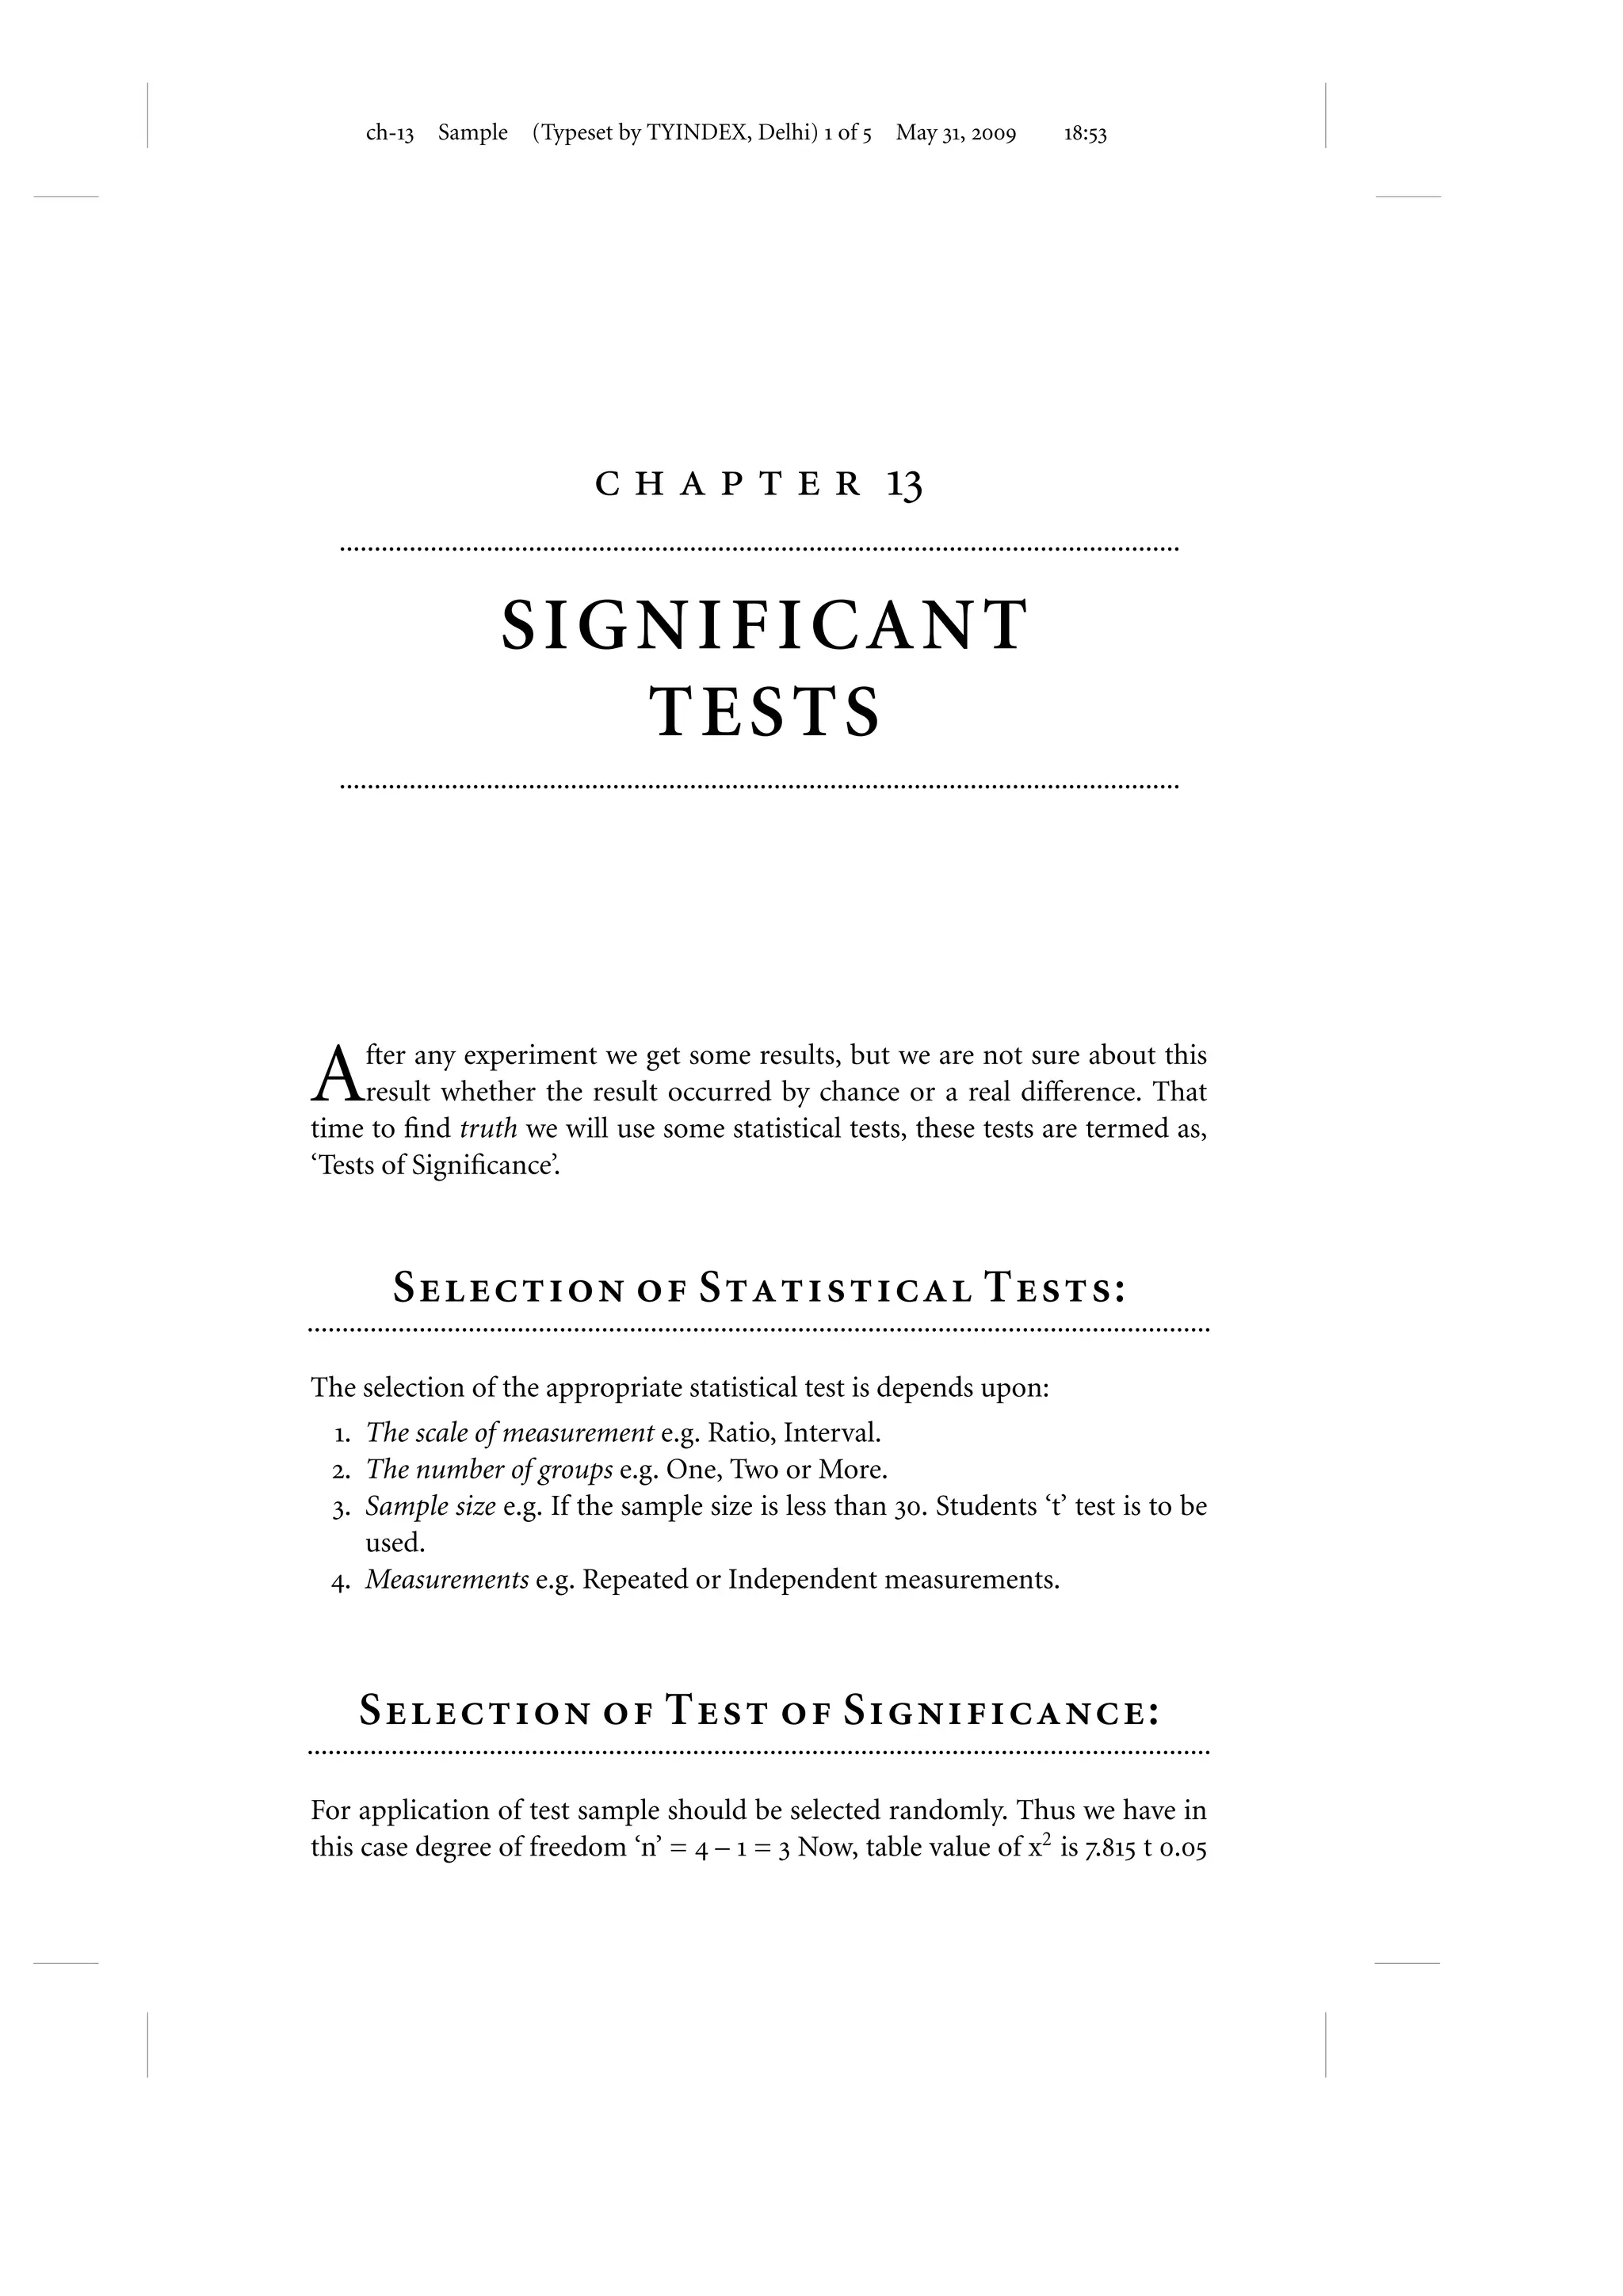
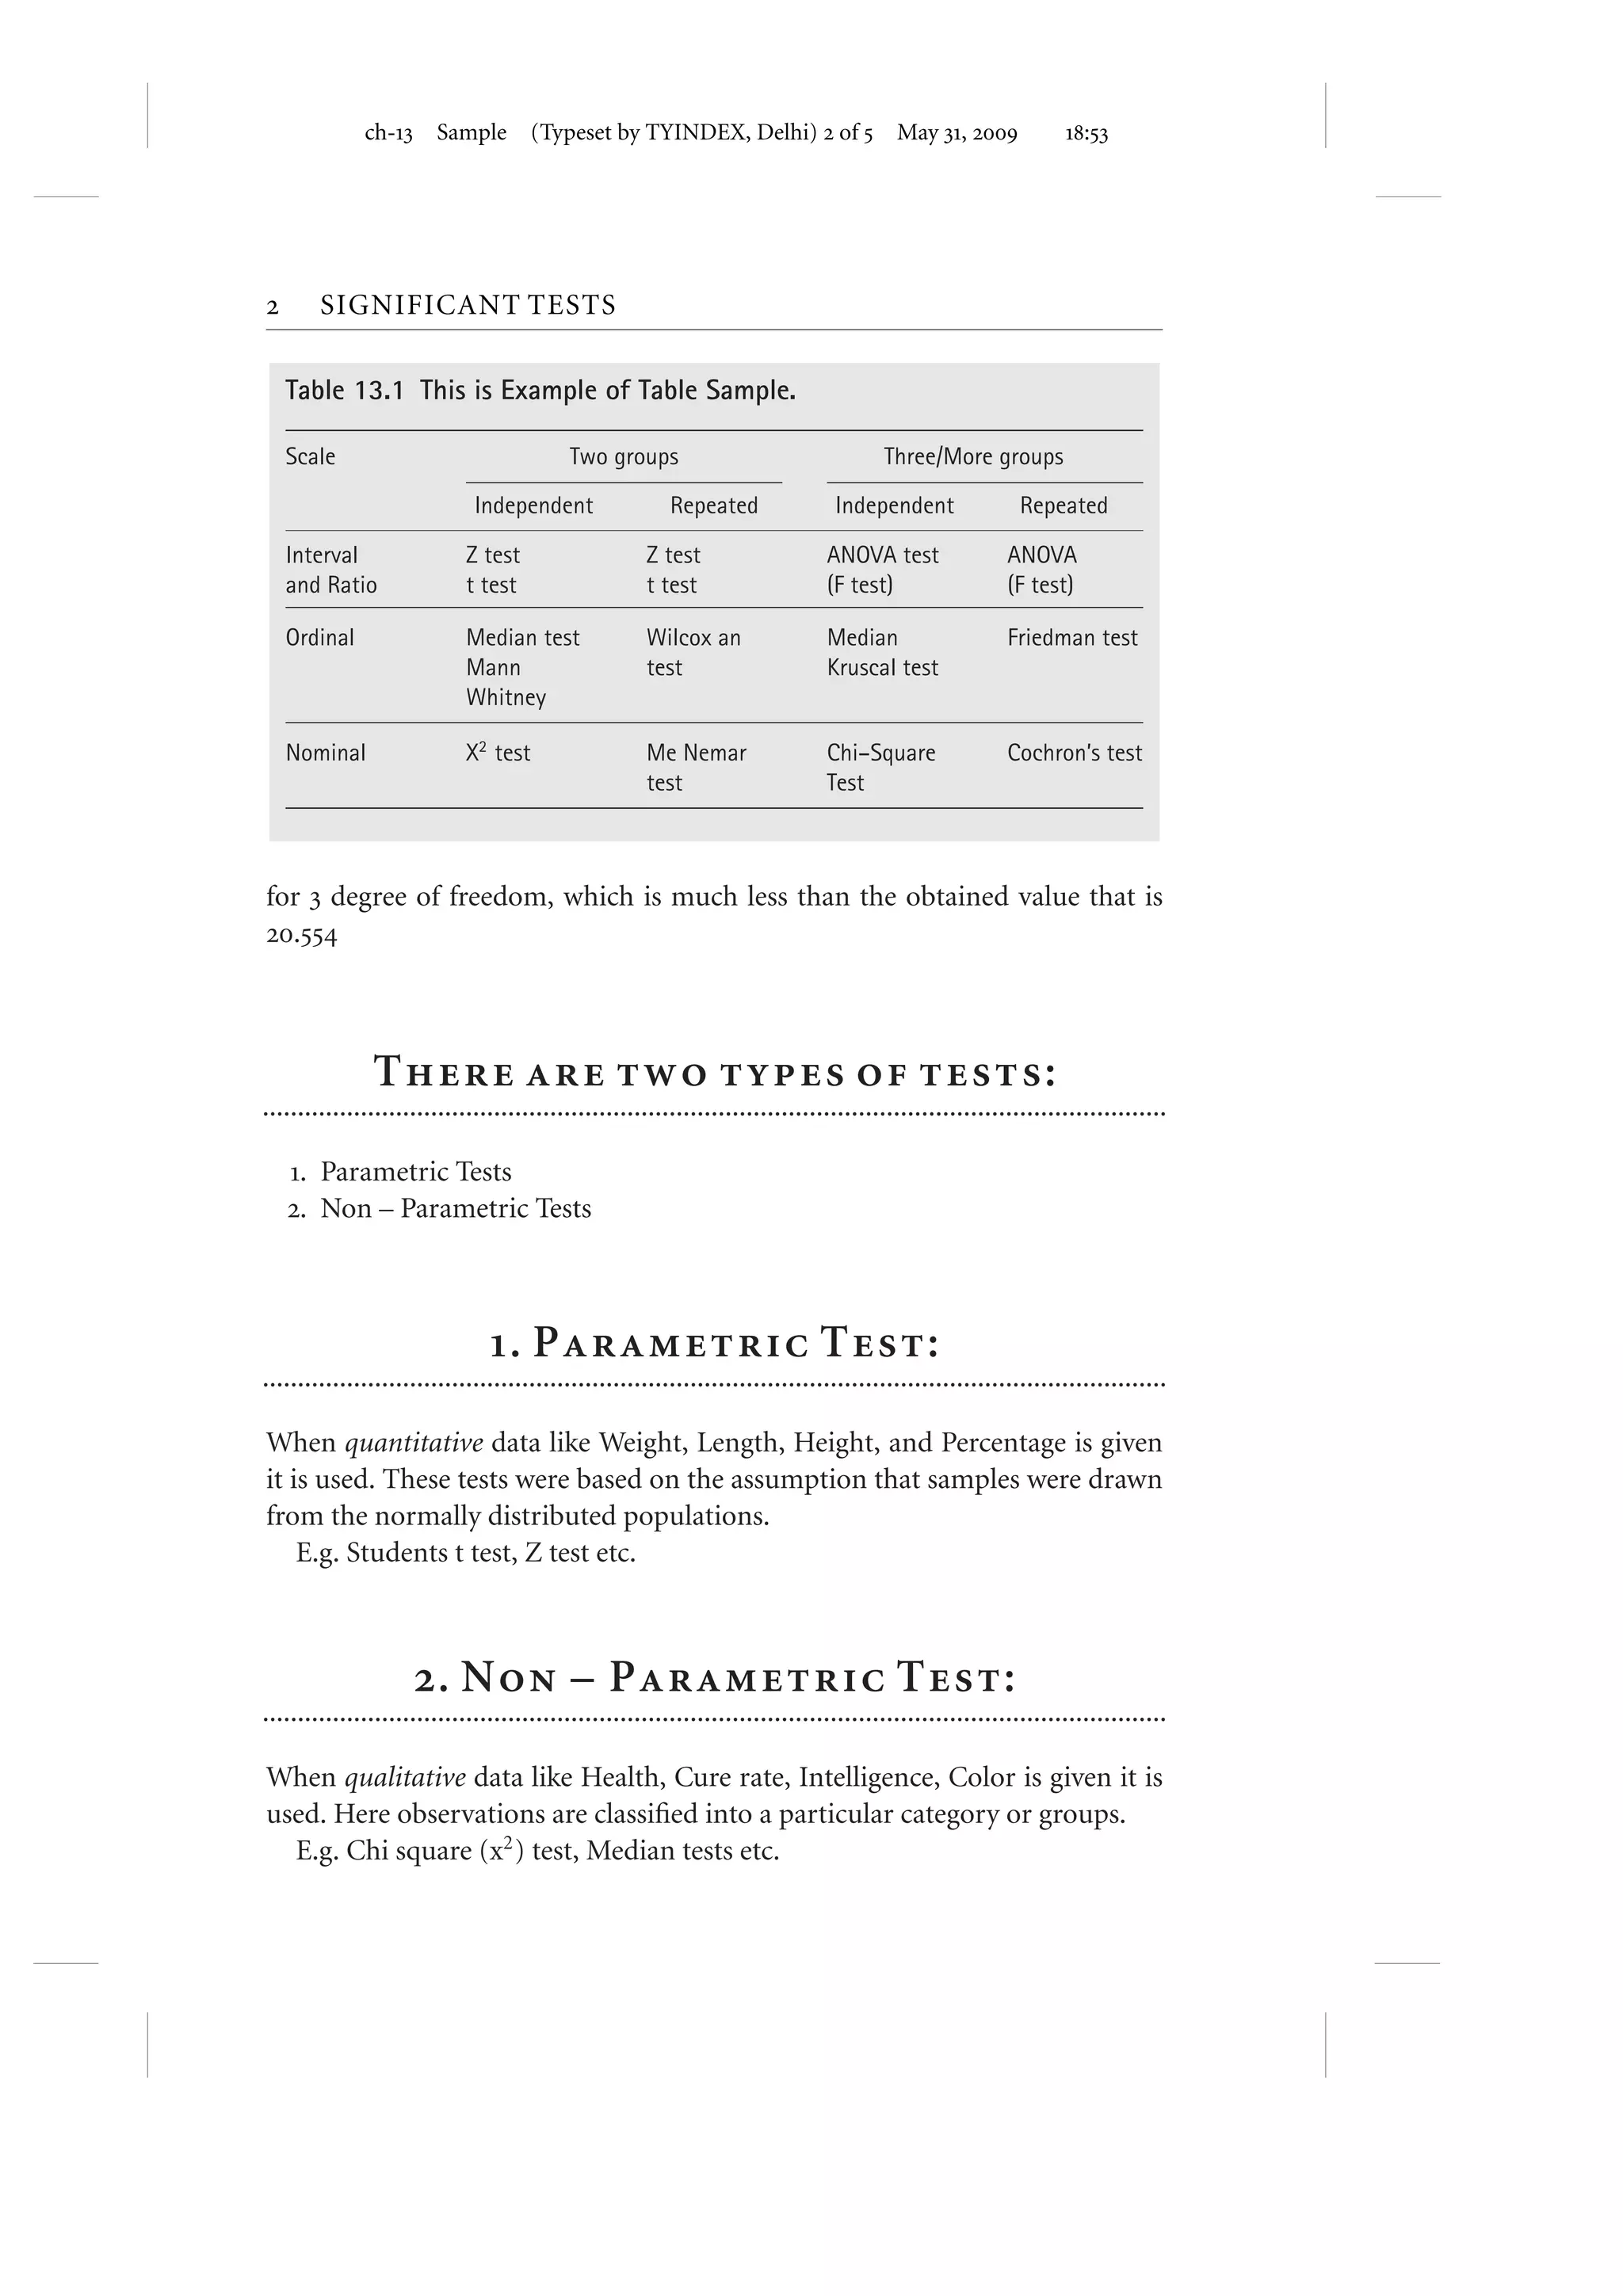
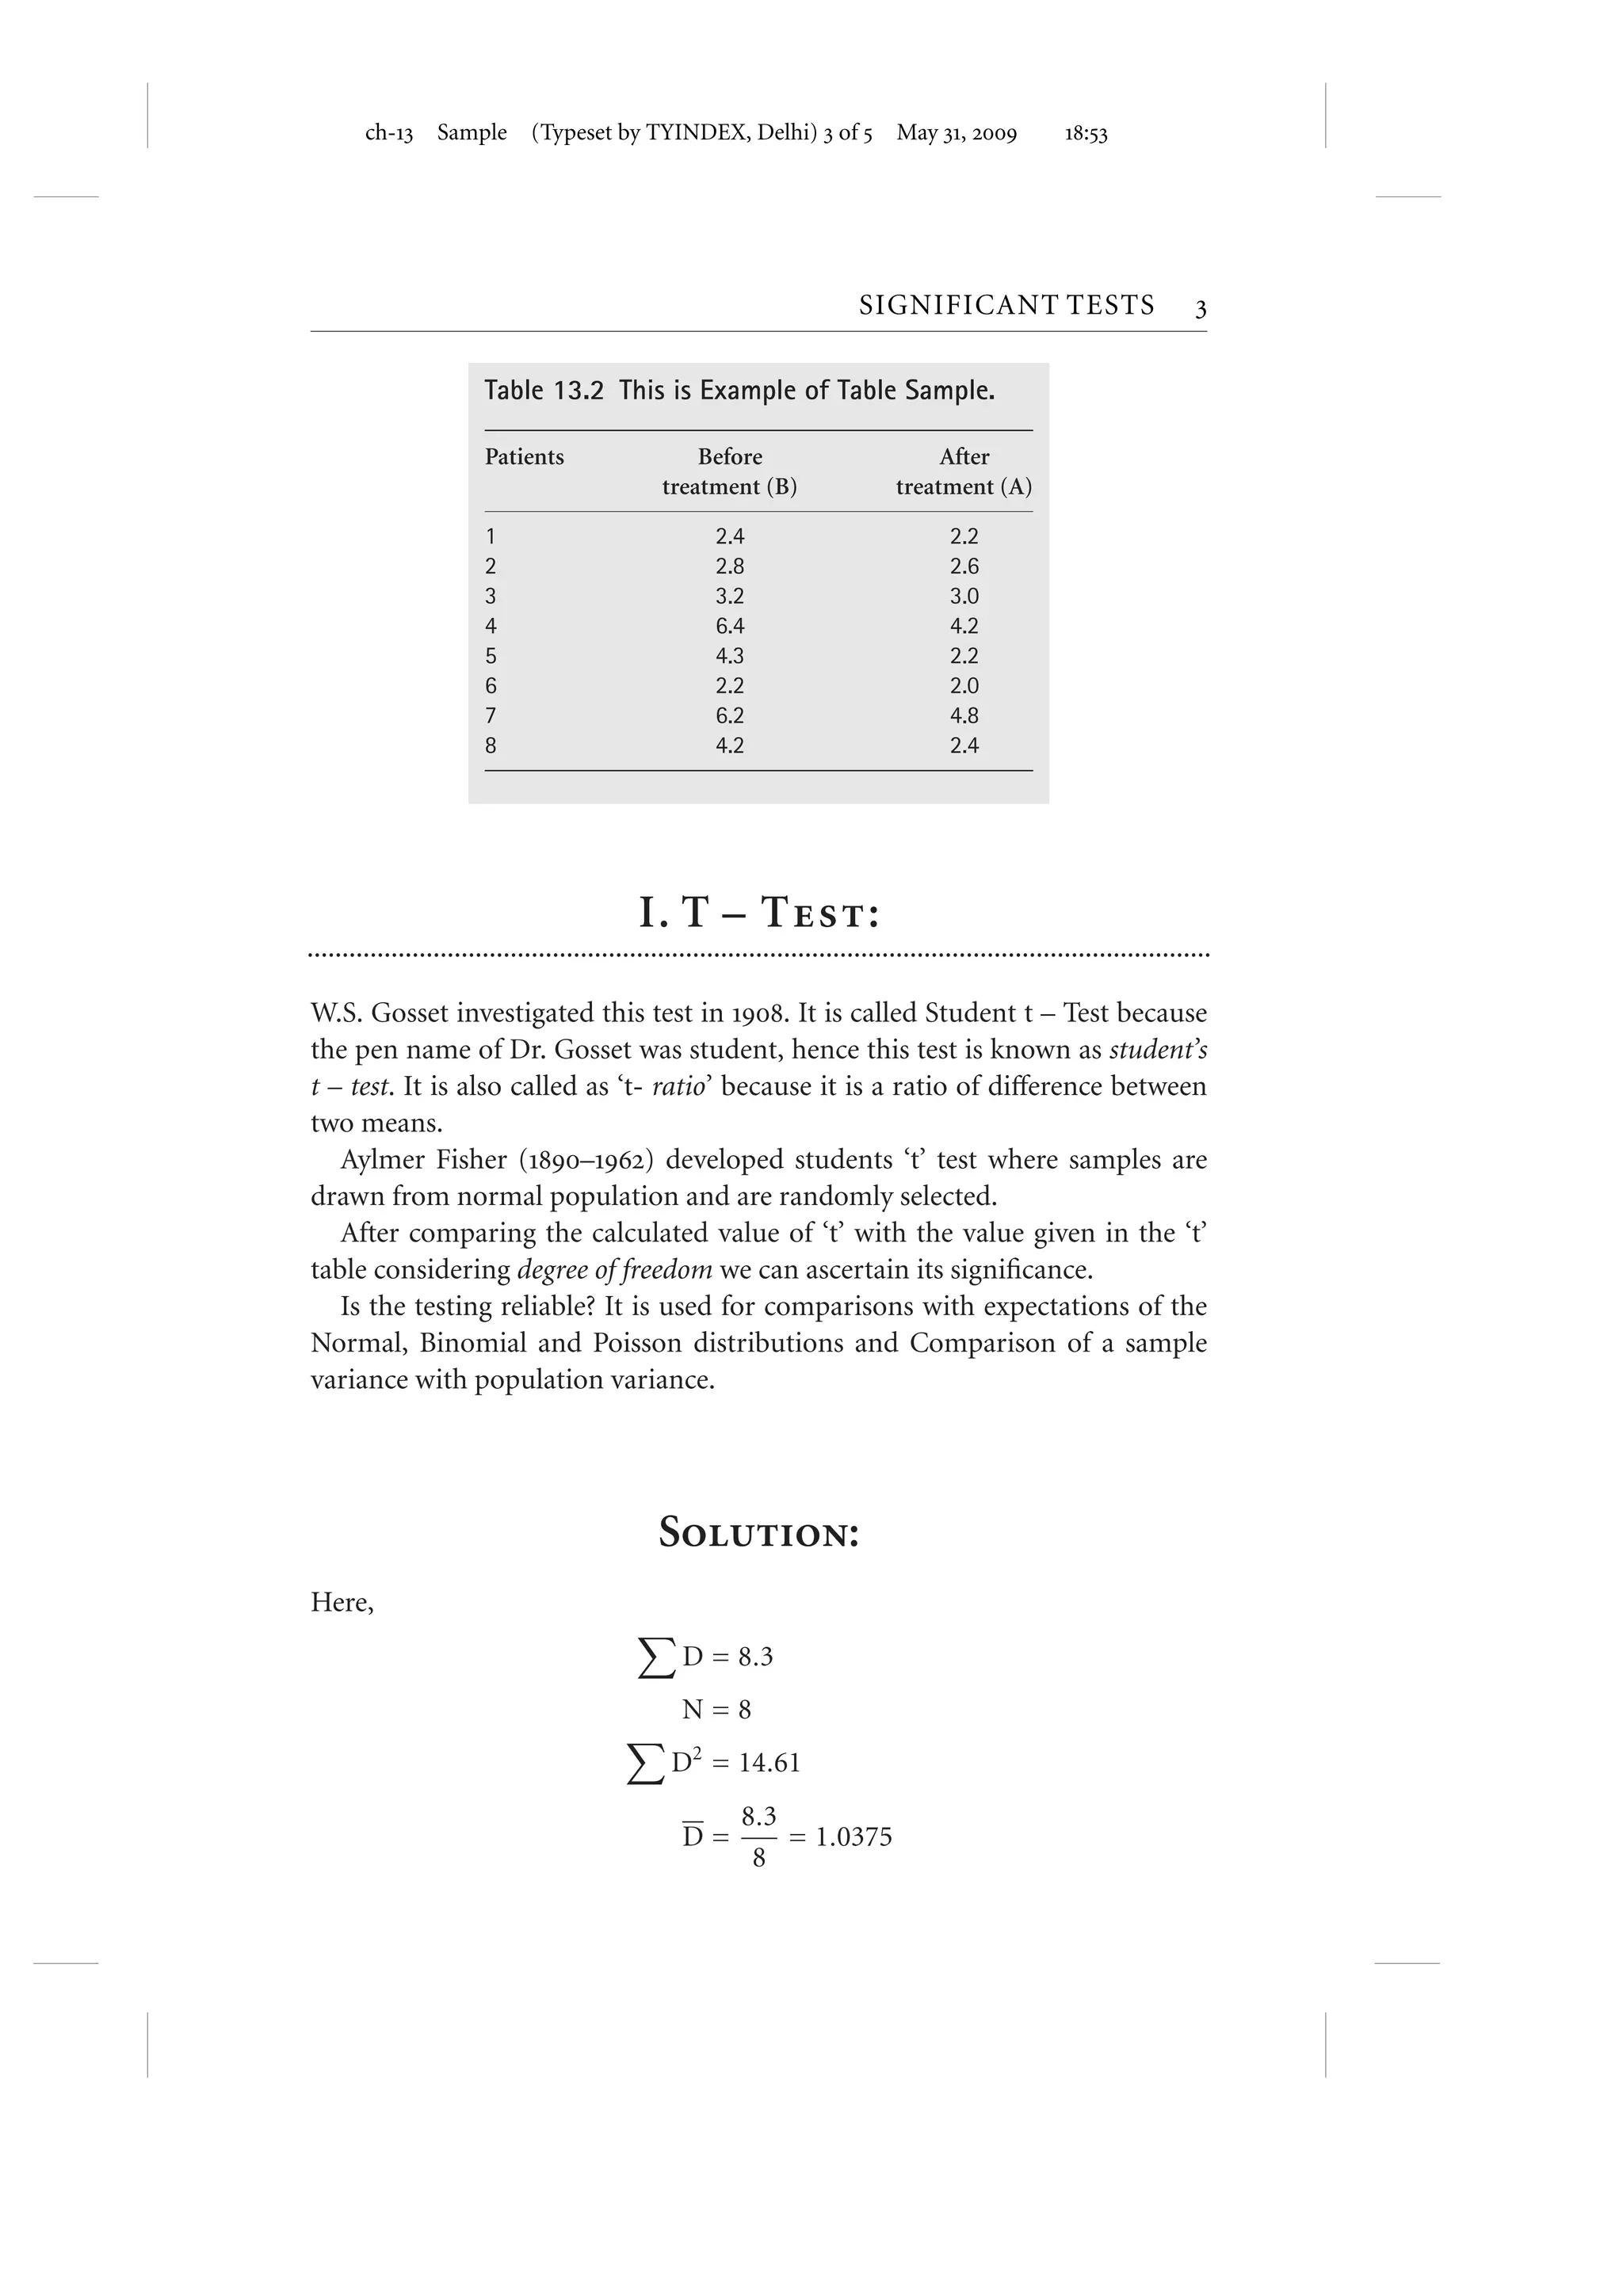
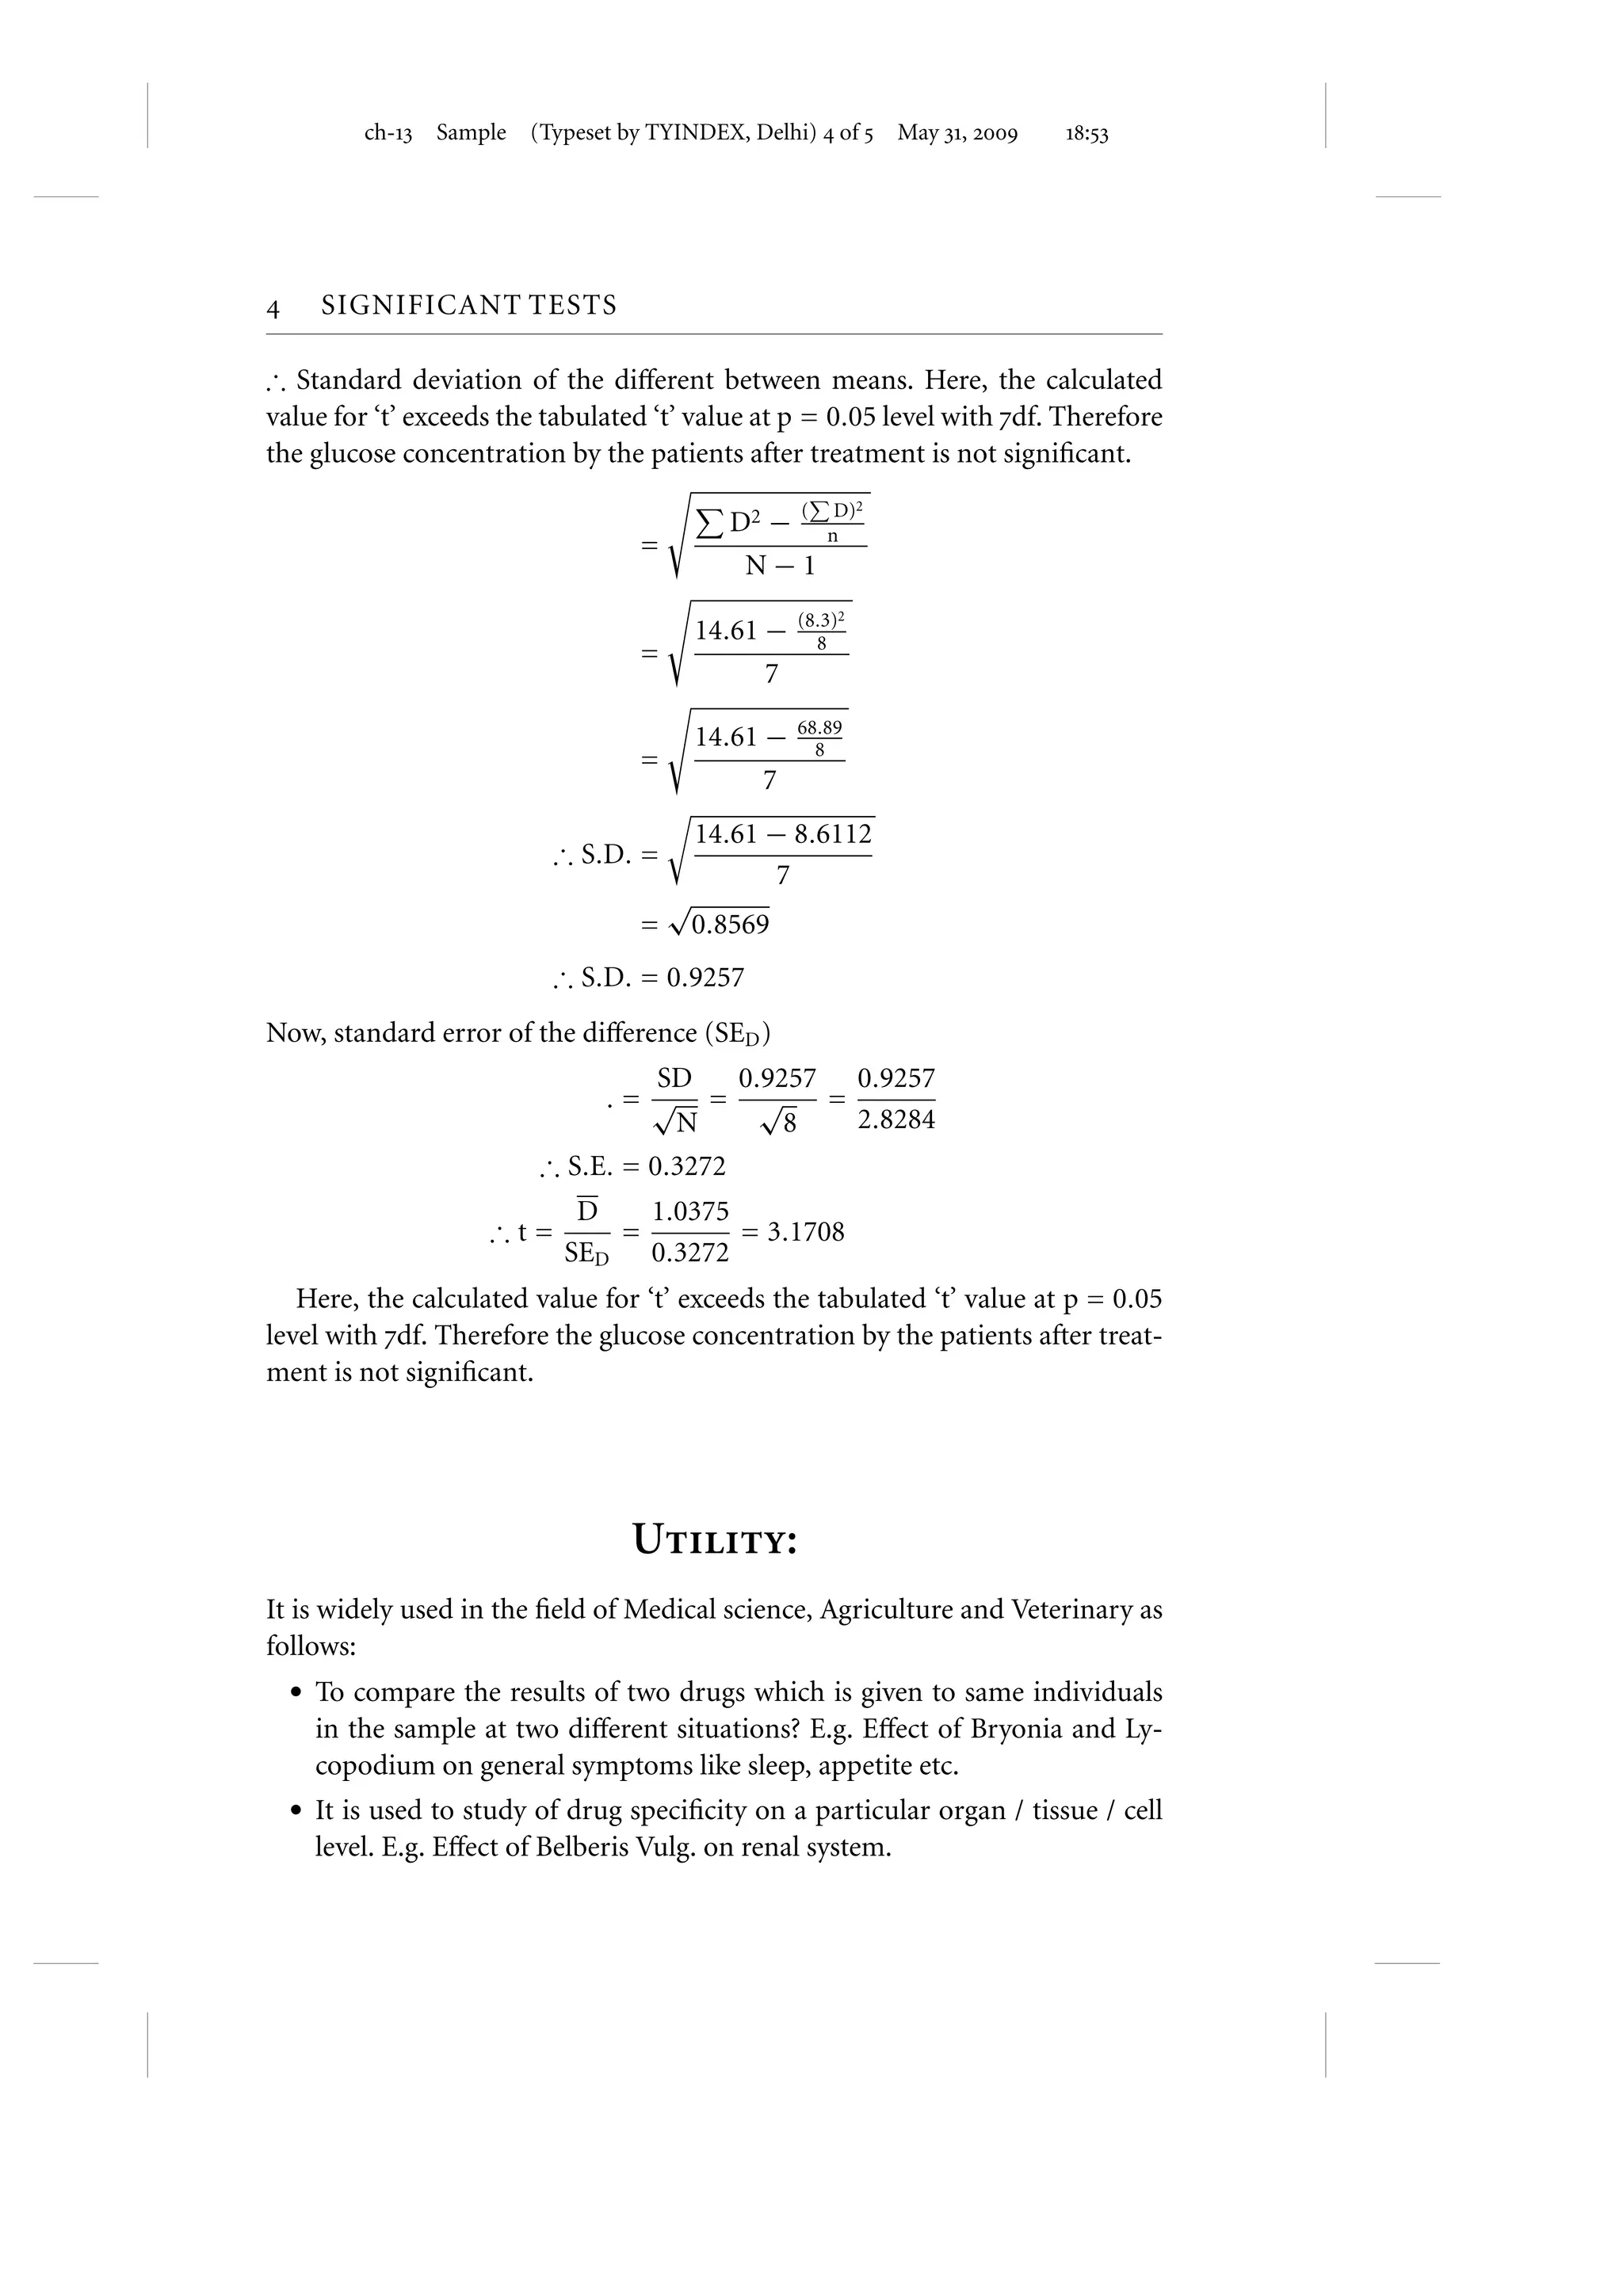
SlideShare a Scribd company logo
ch-     Sample        (Typeset by TYINDEX, Delhi)  of  May ,                              :


                                               
    ........................................................................................................................


                           SIGNIFICANT
                              T E S TS
    ........................................................................................................................


A    fter any experiment we get some results, but we are not sure about this
     result whether the result occurred by chance or a real difference. That
time to find truth we will use some statistical tests, these tests are termed as,
‘Tests of Significance’.


            S  S T:
.................................................................................................................................

The selection of the appropriate statistical test is depends upon:
   . The scale of measurement e.g. Ratio, Interval.
   . The number of groups e.g. One, Two or More.
   . Sample size e.g. If the sample size is less than . Students ‘t’ test is to be
      used.
   . Measurements e.g. Repeated or Independent measurements.


       S  T  S:
.................................................................................................................................

For application of test sample should be selected randomly. Thus we have in
this case degree of freedom ‘n’ =  –  =  Now, table value of x2 is . t .
ch- Sample            (Typeset by TYINDEX, Delhi)  of  May ,                              :


       SIGNIFICANT TESTS

    Table 13.1 This is Example of Table Sample.

    Scale                                  Two groups                                   Three/More groups

                              Independent                 Repeated               Independent                Repeated

    Interval                 Z test                   Z test                    ANOVA test                ANOVA
    and Ratio                t test                   t test                    (F test)                  (F test)

    Ordinal                  Median test              Wilcox an                 Median                    Friedman test
                             Mann                     test                      Kruscal test
                             Whitney

    Nominal                  X2 test                  Me Nemar                  Chi–Square                Cochron’s test
                                                      test                      Test


for  degree of freedom, which is much less than the obtained value that is
.


               T     :
.................................................................................................................................

    . Parametric Tests
    . Non – Parametric Tests


                                . P T:
.................................................................................................................................

When quantitative data like Weight, Length, Height, and Percentage is given
it is used. These tests were based on the assumption that samples were drawn
from the normally distributed populations.
    E.g. Students t test, Z test etc.


                     . N – P T:
.................................................................................................................................

When qualitative data like Health, Cure rate, Intelligence, Color is given it is
used. Here observations are classified into a particular category or groups.
  E.g. Chi square (x2 ) test, Median tests etc.
ch- Sample           (Typeset by TYINDEX, Delhi)  of  May ,                               :


                                                                              SIGNIFICANT TESTS                               

                         Table 13.2 This is Example of Table Sample.

                         Patients                     Before                             After
                                                  treatment (B)                     treatment (A)

                         1                                2.4                              2.2
                         2                                2.8                              2.6
                         3                                3.2                              3.0
                         4                                6.4                              4.2
                         5                                4.3                              2.2
                         6                                2.2                              2.0
                         7                                6.2                              4.8
                         8                                4.2                              2.4


                                               I. T – T:
.................................................................................................................................

W.S. Gosset investigated this test in . It is called Student t – Test because
the pen name of Dr. Gosset was student, hence this test is known as student’s
t – test. It is also called as ‘t- ratio’ because it is a ratio of difference between
two means.
   Aylmer Fisher (–) developed students ‘t’ test where samples are
drawn from normal population and are randomly selected.
   After comparing the calculated value of ‘t’ with the value given in the ‘t’
table considering degree of freedom we can ascertain its significance.
   Is the testing reliable? It is used for comparisons with expectations of the
Normal, Binomial and Poisson distributions and Comparison of a sample
variance with population variance.


                                                  S:
Here,
                                                     D = 8.3
                                                     N=8
                                                   D2 = 14.61
                                                             8.3
                                                     D=          = 1.0375
                                                              8
ch- Sample   (Typeset by TYINDEX, Delhi)  of  May ,    :


     SIGNIFICANT TESTS

∴ Standard deviation of the different between means. Here, the calculated
value for ‘t’ exceeds the tabulated ‘t’ value at p = 0.05 level with df. Therefore
the glucose concentration by the patients after treatment is not significant.
                                                         D)2
                                             D2 − (     n
                                   =
                                              N−1
                                                     (8.3)2
                                           14.61 −     8
                                   =
                                                 7

                                           14.61 −   68.89
                                                       8
                                   =
                                                 7
                                           14.61 − 8.6112
                           ∴ S.D. =
                                                 7
                                       √
                                   =       0.8569
                           ∴ S.D. = 0.9257
Now, standard error of the difference (SED )
                                   SD    0.9257 0.9257
                              .= √ = √         =
                                    N        8   2.8284
                         ∴ S.E. = 0.3272
                             D   1.0375
                     ∴t=       =        = 3.1708
                            SED 0.3272
   Here, the calculated value for ‘t’ exceeds the tabulated ‘t’ value at p = 0.05
level with df. Therefore the glucose concentration by the patients after treat-
ment is not significant.


                                  U:
It is widely used in the field of Medical science, Agriculture and Veterinary as
follows:
    r To compare the results of two drugs which is given to same individuals
     in the sample at two different situations? E.g. Effect of Bryonia and Ly-
     copodium on general symptoms like sleep, appetite etc.
    r It is used to study of drug specificity on a particular organ / tissue / cell
     level. E.g. Effect of Belberis Vulg. on renal system.
ch- Sample    (Typeset by TYINDEX, Delhi)  of  May ,    :


                                                 SIGNIFICANT TESTS          

r It is used to compare results of two different methods. E.g. Estimation of
 Hb% by Sahlis method and Tallquist method.
r To compare observations made at two different sites of the same body.
 E.g. compare blood pressure of arm and thigh.
r To study the accuracy of two different instruments like Thermometer, B.P
 apparatus etc.
r To accept the Null Hypothesis that is no difference between the two
 means.
r To reject the hypothesis that is the difference between the means of the
 two samples is statistically significant.

More Related Content

Viewers also liked

Work Book_Typesetting
Work Book_TypesettingWork Book_Typesetting
Work Book_Typesetting
chandankumarsingh
 
Meta e learning presentation for imoot
Meta e learning presentation for imootMeta e learning presentation for imoot
Meta e learning presentation for imootKristina Hollis
 
Js Open House 2009 Re Vamp Short Version Credited
Js Open House 2009 Re Vamp Short Version CreditedJs Open House 2009 Re Vamp Short Version Credited
Js Open House 2009 Re Vamp Short Version Creditedjonathansteenwijk
 
Para Nelly Con Mucho CariñO....Subir El Volumen
Para Nelly Con  Mucho CariñO....Subir El VolumenPara Nelly Con  Mucho CariñO....Subir El Volumen
Para Nelly Con Mucho CariñO....Subir El Volumen
peluga
 
Mobile devices presentation
Mobile devices presentationMobile devices presentation
Mobile devices presentationKristina Hollis
 
Js Open House 2009
Js Open House 2009Js Open House 2009
Js Open House 2009
jonathansteenwijk
 

Viewers also liked (6)

Work Book_Typesetting
Work Book_TypesettingWork Book_Typesetting
Work Book_Typesetting
 
Meta e learning presentation for imoot
Meta e learning presentation for imootMeta e learning presentation for imoot
Meta e learning presentation for imoot
 
Js Open House 2009 Re Vamp Short Version Credited
Js Open House 2009 Re Vamp Short Version CreditedJs Open House 2009 Re Vamp Short Version Credited
Js Open House 2009 Re Vamp Short Version Credited
 
Para Nelly Con Mucho CariñO....Subir El Volumen
Para Nelly Con  Mucho CariñO....Subir El VolumenPara Nelly Con  Mucho CariñO....Subir El Volumen
Para Nelly Con Mucho CariñO....Subir El Volumen
 
Mobile devices presentation
Mobile devices presentationMobile devices presentation
Mobile devices presentation
 
Js Open House 2009
Js Open House 2009Js Open House 2009
Js Open House 2009
 

Similar to Sample C_Book Typesetting

การสุ่มตัวอย่างในงานวิจัยสาธารณสุข
การสุ่มตัวอย่างในงานวิจัยสาธารณสุขการสุ่มตัวอย่างในงานวิจัยสาธารณสุข
การสุ่มตัวอย่างในงานวิจัยสาธารณสุขUltraman Taro
 
Two variances or standard deviations
Two variances or standard deviations  Two variances or standard deviations
Two variances or standard deviations
Long Beach City College
 
Two dependent samples (matched pairs)
Two dependent samples (matched pairs) Two dependent samples (matched pairs)
Two dependent samples (matched pairs)
Long Beach City College
 
Report of the Implementation of DAE Integrators for MBSim
Report of the Implementation of DAE Integrators for MBSimReport of the Implementation of DAE Integrators for MBSim
Report of the Implementation of DAE Integrators for MBSimZhan Wang
 
Dependent T Test
Dependent T TestDependent T Test
Dependent T Testshoffma5
 
Chapter07.pdf
Chapter07.pdfChapter07.pdf
Chapter07.pdf
KarenJoyBabida
 
Two Means, Independent Samples
Two Means, Independent SamplesTwo Means, Independent Samples
Two Means, Independent Samples
Long Beach City College
 
Andrew_Hair_Assignment_3
Andrew_Hair_Assignment_3Andrew_Hair_Assignment_3
Andrew_Hair_Assignment_3Andrew Hair
 
9702 w11 qp_21
9702 w11 qp_219702 w11 qp_21
9702 w11 qp_21Hira Rizvi
 
Note 0
Note 0Note 0
Note 0
Mukesh Gupta
 
t-tests in R - Lab slides for UGA course FANR 6750
t-tests in R - Lab slides for UGA course FANR 6750t-tests in R - Lab slides for UGA course FANR 6750
t-tests in R - Lab slides for UGA course FANR 6750
richardchandler
 
0625 w11 qp_61
0625 w11 qp_610625 w11 qp_61
0625 w11 qp_61King Ali
 
Statistics firstfive
Statistics firstfiveStatistics firstfive
Statistics firstfiveSukirti Garg
 
Two Means Independent Samples
Two Means Independent Samples  Two Means Independent Samples
Two Means Independent Samples
Long Beach City College
 
Seminar- Robust Regression Methods
Seminar- Robust Regression MethodsSeminar- Robust Regression Methods
Seminar- Robust Regression MethodsSumon Sdb
 
ATT00001ATT00002ATT00003ATT00004ATT00005CARD.docx
ATT00001ATT00002ATT00003ATT00004ATT00005CARD.docxATT00001ATT00002ATT00003ATT00004ATT00005CARD.docx
ATT00001ATT00002ATT00003ATT00004ATT00005CARD.docx
ikirkton
 
X chart and R chart.pptx
X chart and R chart.pptxX chart and R chart.pptx
X chart and R chart.pptx
StudentsMehta
 

Similar to Sample C_Book Typesetting (20)

การสุ่มตัวอย่างในงานวิจัยสาธารณสุข
การสุ่มตัวอย่างในงานวิจัยสาธารณสุขการสุ่มตัวอย่างในงานวิจัยสาธารณสุข
การสุ่มตัวอย่างในงานวิจัยสาธารณสุข
 
Two variances or standard deviations
Two variances or standard deviations  Two variances or standard deviations
Two variances or standard deviations
 
Two dependent samples (matched pairs)
Two dependent samples (matched pairs) Two dependent samples (matched pairs)
Two dependent samples (matched pairs)
 
Report of the Implementation of DAE Integrators for MBSim
Report of the Implementation of DAE Integrators for MBSimReport of the Implementation of DAE Integrators for MBSim
Report of the Implementation of DAE Integrators for MBSim
 
Dependent T Test
Dependent T TestDependent T Test
Dependent T Test
 
Chapter07.pdf
Chapter07.pdfChapter07.pdf
Chapter07.pdf
 
Student t t est
Student t t estStudent t t est
Student t t est
 
Two Means, Independent Samples
Two Means, Independent SamplesTwo Means, Independent Samples
Two Means, Independent Samples
 
Andrew_Hair_Assignment_3
Andrew_Hair_Assignment_3Andrew_Hair_Assignment_3
Andrew_Hair_Assignment_3
 
9702 w11 qp_21
9702 w11 qp_219702 w11 qp_21
9702 w11 qp_21
 
Note 0
Note 0Note 0
Note 0
 
t-tests in R - Lab slides for UGA course FANR 6750
t-tests in R - Lab slides for UGA course FANR 6750t-tests in R - Lab slides for UGA course FANR 6750
t-tests in R - Lab slides for UGA course FANR 6750
 
0625 w11 qp_61
0625 w11 qp_610625 w11 qp_61
0625 w11 qp_61
 
Statistics firstfive
Statistics firstfiveStatistics firstfive
Statistics firstfive
 
Two Means Independent Samples
Two Means Independent Samples  Two Means Independent Samples
Two Means Independent Samples
 
Seminar- Robust Regression Methods
Seminar- Robust Regression MethodsSeminar- Robust Regression Methods
Seminar- Robust Regression Methods
 
ATT00001ATT00002ATT00003ATT00004ATT00005CARD.docx
ATT00001ATT00002ATT00003ATT00004ATT00005CARD.docxATT00001ATT00002ATT00003ATT00004ATT00005CARD.docx
ATT00001ATT00002ATT00003ATT00004ATT00005CARD.docx
 
X chart and R chart.pptx
X chart and R chart.pptxX chart and R chart.pptx
X chart and R chart.pptx
 
MScThesis1
MScThesis1MScThesis1
MScThesis1
 
Bab13
Bab13Bab13
Bab13
 

Recently uploaded

LF Energy Webinar: Electrical Grid Modelling and Simulation Through PowSyBl -...
LF Energy Webinar: Electrical Grid Modelling and Simulation Through PowSyBl -...LF Energy Webinar: Electrical Grid Modelling and Simulation Through PowSyBl -...
LF Energy Webinar: Electrical Grid Modelling and Simulation Through PowSyBl -...
DanBrown980551
 
Observability Concepts EVERY Developer Should Know -- DeveloperWeek Europe.pdf
Observability Concepts EVERY Developer Should Know -- DeveloperWeek Europe.pdfObservability Concepts EVERY Developer Should Know -- DeveloperWeek Europe.pdf
Observability Concepts EVERY Developer Should Know -- DeveloperWeek Europe.pdf
Paige Cruz
 
Elevating Tactical DDD Patterns Through Object Calisthenics
Elevating Tactical DDD Patterns Through Object CalisthenicsElevating Tactical DDD Patterns Through Object Calisthenics
Elevating Tactical DDD Patterns Through Object Calisthenics
Dorra BARTAGUIZ
 
Securing your Kubernetes cluster_ a step-by-step guide to success !
Securing your Kubernetes cluster_ a step-by-step guide to success !Securing your Kubernetes cluster_ a step-by-step guide to success !
Securing your Kubernetes cluster_ a step-by-step guide to success !
KatiaHIMEUR1
 
Bits & Pixels using AI for Good.........
Bits & Pixels using AI for Good.........Bits & Pixels using AI for Good.........
Bits & Pixels using AI for Good.........
Alison B. Lowndes
 
Smart TV Buyer Insights Survey 2024 by 91mobiles.pdf
Smart TV Buyer Insights Survey 2024 by 91mobiles.pdfSmart TV Buyer Insights Survey 2024 by 91mobiles.pdf
Smart TV Buyer Insights Survey 2024 by 91mobiles.pdf
91mobiles
 
De-mystifying Zero to One: Design Informed Techniques for Greenfield Innovati...
De-mystifying Zero to One: Design Informed Techniques for Greenfield Innovati...De-mystifying Zero to One: Design Informed Techniques for Greenfield Innovati...
De-mystifying Zero to One: Design Informed Techniques for Greenfield Innovati...
Product School
 
SAP Sapphire 2024 - ASUG301 building better apps with SAP Fiori.pdf
SAP Sapphire 2024 - ASUG301 building better apps with SAP Fiori.pdfSAP Sapphire 2024 - ASUG301 building better apps with SAP Fiori.pdf
SAP Sapphire 2024 - ASUG301 building better apps with SAP Fiori.pdf
Peter Spielvogel
 
Unsubscribed: Combat Subscription Fatigue With a Membership Mentality by Head...
Unsubscribed: Combat Subscription Fatigue With a Membership Mentality by Head...Unsubscribed: Combat Subscription Fatigue With a Membership Mentality by Head...
Unsubscribed: Combat Subscription Fatigue With a Membership Mentality by Head...
Product School
 
FIDO Alliance Osaka Seminar: Passkeys and the Road Ahead.pdf
FIDO Alliance Osaka Seminar: Passkeys and the Road Ahead.pdfFIDO Alliance Osaka Seminar: Passkeys and the Road Ahead.pdf
FIDO Alliance Osaka Seminar: Passkeys and the Road Ahead.pdf
FIDO Alliance
 
Quantum Computing: Current Landscape and the Future Role of APIs
Quantum Computing: Current Landscape and the Future Role of APIsQuantum Computing: Current Landscape and the Future Role of APIs
Quantum Computing: Current Landscape and the Future Role of APIs
Vlad Stirbu
 
A tale of scale & speed: How the US Navy is enabling software delivery from l...
A tale of scale & speed: How the US Navy is enabling software delivery from l...A tale of scale & speed: How the US Navy is enabling software delivery from l...
A tale of scale & speed: How the US Navy is enabling software delivery from l...
sonjaschweigert1
 
Essentials of Automations: Optimizing FME Workflows with Parameters
Essentials of Automations: Optimizing FME Workflows with ParametersEssentials of Automations: Optimizing FME Workflows with Parameters
Essentials of Automations: Optimizing FME Workflows with Parameters
Safe Software
 
The Future of Platform Engineering
The Future of Platform EngineeringThe Future of Platform Engineering
The Future of Platform Engineering
Jemma Hussein Allen
 
GenAISummit 2024 May 28 Sri Ambati Keynote: AGI Belongs to The Community in O...
GenAISummit 2024 May 28 Sri Ambati Keynote: AGI Belongs to The Community in O...GenAISummit 2024 May 28 Sri Ambati Keynote: AGI Belongs to The Community in O...
GenAISummit 2024 May 28 Sri Ambati Keynote: AGI Belongs to The Community in O...
Sri Ambati
 
Empowering NextGen Mobility via Large Action Model Infrastructure (LAMI): pav...
Empowering NextGen Mobility via Large Action Model Infrastructure (LAMI): pav...Empowering NextGen Mobility via Large Action Model Infrastructure (LAMI): pav...
Empowering NextGen Mobility via Large Action Model Infrastructure (LAMI): pav...
Thierry Lestable
 
Monitoring Java Application Security with JDK Tools and JFR Events
Monitoring Java Application Security with JDK Tools and JFR EventsMonitoring Java Application Security with JDK Tools and JFR Events
Monitoring Java Application Security with JDK Tools and JFR Events
Ana-Maria Mihalceanu
 
Leading Change strategies and insights for effective change management pdf 1.pdf
Leading Change strategies and insights for effective change management pdf 1.pdfLeading Change strategies and insights for effective change management pdf 1.pdf
Leading Change strategies and insights for effective change management pdf 1.pdf
OnBoard
 
Assure Contact Center Experiences for Your Customers With ThousandEyes
Assure Contact Center Experiences for Your Customers With ThousandEyesAssure Contact Center Experiences for Your Customers With ThousandEyes
Assure Contact Center Experiences for Your Customers With ThousandEyes
ThousandEyes
 
Introduction to CHERI technology - Cybersecurity
Introduction to CHERI technology - CybersecurityIntroduction to CHERI technology - Cybersecurity
Introduction to CHERI technology - Cybersecurity
mikeeftimakis1
 

Recently uploaded (20)

LF Energy Webinar: Electrical Grid Modelling and Simulation Through PowSyBl -...
LF Energy Webinar: Electrical Grid Modelling and Simulation Through PowSyBl -...LF Energy Webinar: Electrical Grid Modelling and Simulation Through PowSyBl -...
LF Energy Webinar: Electrical Grid Modelling and Simulation Through PowSyBl -...
 
Observability Concepts EVERY Developer Should Know -- DeveloperWeek Europe.pdf
Observability Concepts EVERY Developer Should Know -- DeveloperWeek Europe.pdfObservability Concepts EVERY Developer Should Know -- DeveloperWeek Europe.pdf
Observability Concepts EVERY Developer Should Know -- DeveloperWeek Europe.pdf
 
Elevating Tactical DDD Patterns Through Object Calisthenics
Elevating Tactical DDD Patterns Through Object CalisthenicsElevating Tactical DDD Patterns Through Object Calisthenics
Elevating Tactical DDD Patterns Through Object Calisthenics
 
Securing your Kubernetes cluster_ a step-by-step guide to success !
Securing your Kubernetes cluster_ a step-by-step guide to success !Securing your Kubernetes cluster_ a step-by-step guide to success !
Securing your Kubernetes cluster_ a step-by-step guide to success !
 
Bits & Pixels using AI for Good.........
Bits & Pixels using AI for Good.........Bits & Pixels using AI for Good.........
Bits & Pixels using AI for Good.........
 
Smart TV Buyer Insights Survey 2024 by 91mobiles.pdf
Smart TV Buyer Insights Survey 2024 by 91mobiles.pdfSmart TV Buyer Insights Survey 2024 by 91mobiles.pdf
Smart TV Buyer Insights Survey 2024 by 91mobiles.pdf
 
De-mystifying Zero to One: Design Informed Techniques for Greenfield Innovati...
De-mystifying Zero to One: Design Informed Techniques for Greenfield Innovati...De-mystifying Zero to One: Design Informed Techniques for Greenfield Innovati...
De-mystifying Zero to One: Design Informed Techniques for Greenfield Innovati...
 
SAP Sapphire 2024 - ASUG301 building better apps with SAP Fiori.pdf
SAP Sapphire 2024 - ASUG301 building better apps with SAP Fiori.pdfSAP Sapphire 2024 - ASUG301 building better apps with SAP Fiori.pdf
SAP Sapphire 2024 - ASUG301 building better apps with SAP Fiori.pdf
 
Unsubscribed: Combat Subscription Fatigue With a Membership Mentality by Head...
Unsubscribed: Combat Subscription Fatigue With a Membership Mentality by Head...Unsubscribed: Combat Subscription Fatigue With a Membership Mentality by Head...
Unsubscribed: Combat Subscription Fatigue With a Membership Mentality by Head...
 
FIDO Alliance Osaka Seminar: Passkeys and the Road Ahead.pdf
FIDO Alliance Osaka Seminar: Passkeys and the Road Ahead.pdfFIDO Alliance Osaka Seminar: Passkeys and the Road Ahead.pdf
FIDO Alliance Osaka Seminar: Passkeys and the Road Ahead.pdf
 
Quantum Computing: Current Landscape and the Future Role of APIs
Quantum Computing: Current Landscape and the Future Role of APIsQuantum Computing: Current Landscape and the Future Role of APIs
Quantum Computing: Current Landscape and the Future Role of APIs
 
A tale of scale & speed: How the US Navy is enabling software delivery from l...
A tale of scale & speed: How the US Navy is enabling software delivery from l...A tale of scale & speed: How the US Navy is enabling software delivery from l...
A tale of scale & speed: How the US Navy is enabling software delivery from l...
 
Essentials of Automations: Optimizing FME Workflows with Parameters
Essentials of Automations: Optimizing FME Workflows with ParametersEssentials of Automations: Optimizing FME Workflows with Parameters
Essentials of Automations: Optimizing FME Workflows with Parameters
 
The Future of Platform Engineering
The Future of Platform EngineeringThe Future of Platform Engineering
The Future of Platform Engineering
 
GenAISummit 2024 May 28 Sri Ambati Keynote: AGI Belongs to The Community in O...
GenAISummit 2024 May 28 Sri Ambati Keynote: AGI Belongs to The Community in O...GenAISummit 2024 May 28 Sri Ambati Keynote: AGI Belongs to The Community in O...
GenAISummit 2024 May 28 Sri Ambati Keynote: AGI Belongs to The Community in O...
 
Empowering NextGen Mobility via Large Action Model Infrastructure (LAMI): pav...
Empowering NextGen Mobility via Large Action Model Infrastructure (LAMI): pav...Empowering NextGen Mobility via Large Action Model Infrastructure (LAMI): pav...
Empowering NextGen Mobility via Large Action Model Infrastructure (LAMI): pav...
 
Monitoring Java Application Security with JDK Tools and JFR Events
Monitoring Java Application Security with JDK Tools and JFR EventsMonitoring Java Application Security with JDK Tools and JFR Events
Monitoring Java Application Security with JDK Tools and JFR Events
 
Leading Change strategies and insights for effective change management pdf 1.pdf
Leading Change strategies and insights for effective change management pdf 1.pdfLeading Change strategies and insights for effective change management pdf 1.pdf
Leading Change strategies and insights for effective change management pdf 1.pdf
 
Assure Contact Center Experiences for Your Customers With ThousandEyes
Assure Contact Center Experiences for Your Customers With ThousandEyesAssure Contact Center Experiences for Your Customers With ThousandEyes
Assure Contact Center Experiences for Your Customers With ThousandEyes
 
Introduction to CHERI technology - Cybersecurity
Introduction to CHERI technology - CybersecurityIntroduction to CHERI technology - Cybersecurity
Introduction to CHERI technology - Cybersecurity
 

Sample C_Book Typesetting

  • 1. ch- Sample (Typeset by TYINDEX, Delhi)  of  May ,  :         ........................................................................................................................ SIGNIFICANT T E S TS ........................................................................................................................ A fter any experiment we get some results, but we are not sure about this result whether the result occurred by chance or a real difference. That time to find truth we will use some statistical tests, these tests are termed as, ‘Tests of Significance’. S  S T: ................................................................................................................................. The selection of the appropriate statistical test is depends upon: . The scale of measurement e.g. Ratio, Interval. . The number of groups e.g. One, Two or More. . Sample size e.g. If the sample size is less than . Students ‘t’ test is to be used. . Measurements e.g. Repeated or Independent measurements. S  T  S: ................................................................................................................................. For application of test sample should be selected randomly. Thus we have in this case degree of freedom ‘n’ =  –  =  Now, table value of x2 is . t .
  • 2. ch- Sample (Typeset by TYINDEX, Delhi)  of  May ,  :  SIGNIFICANT TESTS Table 13.1 This is Example of Table Sample. Scale Two groups Three/More groups Independent Repeated Independent Repeated Interval Z test Z test ANOVA test ANOVA and Ratio t test t test (F test) (F test) Ordinal Median test Wilcox an Median Friedman test Mann test Kruscal test Whitney Nominal X2 test Me Nemar Chi–Square Cochron’s test test Test for  degree of freedom, which is much less than the obtained value that is . T     : ................................................................................................................................. . Parametric Tests . Non – Parametric Tests . P T: ................................................................................................................................. When quantitative data like Weight, Length, Height, and Percentage is given it is used. These tests were based on the assumption that samples were drawn from the normally distributed populations. E.g. Students t test, Z test etc. . N – P T: ................................................................................................................................. When qualitative data like Health, Cure rate, Intelligence, Color is given it is used. Here observations are classified into a particular category or groups. E.g. Chi square (x2 ) test, Median tests etc.
  • 3. ch- Sample (Typeset by TYINDEX, Delhi)  of  May ,  : SIGNIFICANT TESTS  Table 13.2 This is Example of Table Sample. Patients Before After treatment (B) treatment (A) 1 2.4 2.2 2 2.8 2.6 3 3.2 3.0 4 6.4 4.2 5 4.3 2.2 6 2.2 2.0 7 6.2 4.8 8 4.2 2.4 I. T – T: ................................................................................................................................. W.S. Gosset investigated this test in . It is called Student t – Test because the pen name of Dr. Gosset was student, hence this test is known as student’s t – test. It is also called as ‘t- ratio’ because it is a ratio of difference between two means. Aylmer Fisher (–) developed students ‘t’ test where samples are drawn from normal population and are randomly selected. After comparing the calculated value of ‘t’ with the value given in the ‘t’ table considering degree of freedom we can ascertain its significance. Is the testing reliable? It is used for comparisons with expectations of the Normal, Binomial and Poisson distributions and Comparison of a sample variance with population variance. S: Here, D = 8.3 N=8 D2 = 14.61 8.3 D= = 1.0375 8
  • 4. ch- Sample (Typeset by TYINDEX, Delhi)  of  May ,  :  SIGNIFICANT TESTS ∴ Standard deviation of the different between means. Here, the calculated value for ‘t’ exceeds the tabulated ‘t’ value at p = 0.05 level with df. Therefore the glucose concentration by the patients after treatment is not significant. D)2 D2 − ( n = N−1 (8.3)2 14.61 − 8 = 7 14.61 − 68.89 8 = 7 14.61 − 8.6112 ∴ S.D. = 7 √ = 0.8569 ∴ S.D. = 0.9257 Now, standard error of the difference (SED ) SD 0.9257 0.9257 .= √ = √ = N 8 2.8284 ∴ S.E. = 0.3272 D 1.0375 ∴t= = = 3.1708 SED 0.3272 Here, the calculated value for ‘t’ exceeds the tabulated ‘t’ value at p = 0.05 level with df. Therefore the glucose concentration by the patients after treat- ment is not significant. U: It is widely used in the field of Medical science, Agriculture and Veterinary as follows: r To compare the results of two drugs which is given to same individuals in the sample at two different situations? E.g. Effect of Bryonia and Ly- copodium on general symptoms like sleep, appetite etc. r It is used to study of drug specificity on a particular organ / tissue / cell level. E.g. Effect of Belberis Vulg. on renal system.
  • 5. ch- Sample (Typeset by TYINDEX, Delhi)  of  May ,  : SIGNIFICANT TESTS  r It is used to compare results of two different methods. E.g. Estimation of Hb% by Sahlis method and Tallquist method. r To compare observations made at two different sites of the same body. E.g. compare blood pressure of arm and thigh. r To study the accuracy of two different instruments like Thermometer, B.P apparatus etc. r To accept the Null Hypothesis that is no difference between the two means. r To reject the hypothesis that is the difference between the means of the two samples is statistically significant.