Downloaded 48 times


The document discusses different types of t-tests, including one-sample, independent two-sample, and paired sample t-tests. It provides an example of a telecom company measuring average customer service times at two stores to determine if there is a significant difference. The key assumptions for t-tests are that the data is continuous, randomly selected, normally distributed, and has equal variances for independent two-sample tests. Steps for performing a one-sample t-test to compare a sample mean to a theoretical value are shown.
Overview of t-tests as a hypothesis testing method with various types based on application.
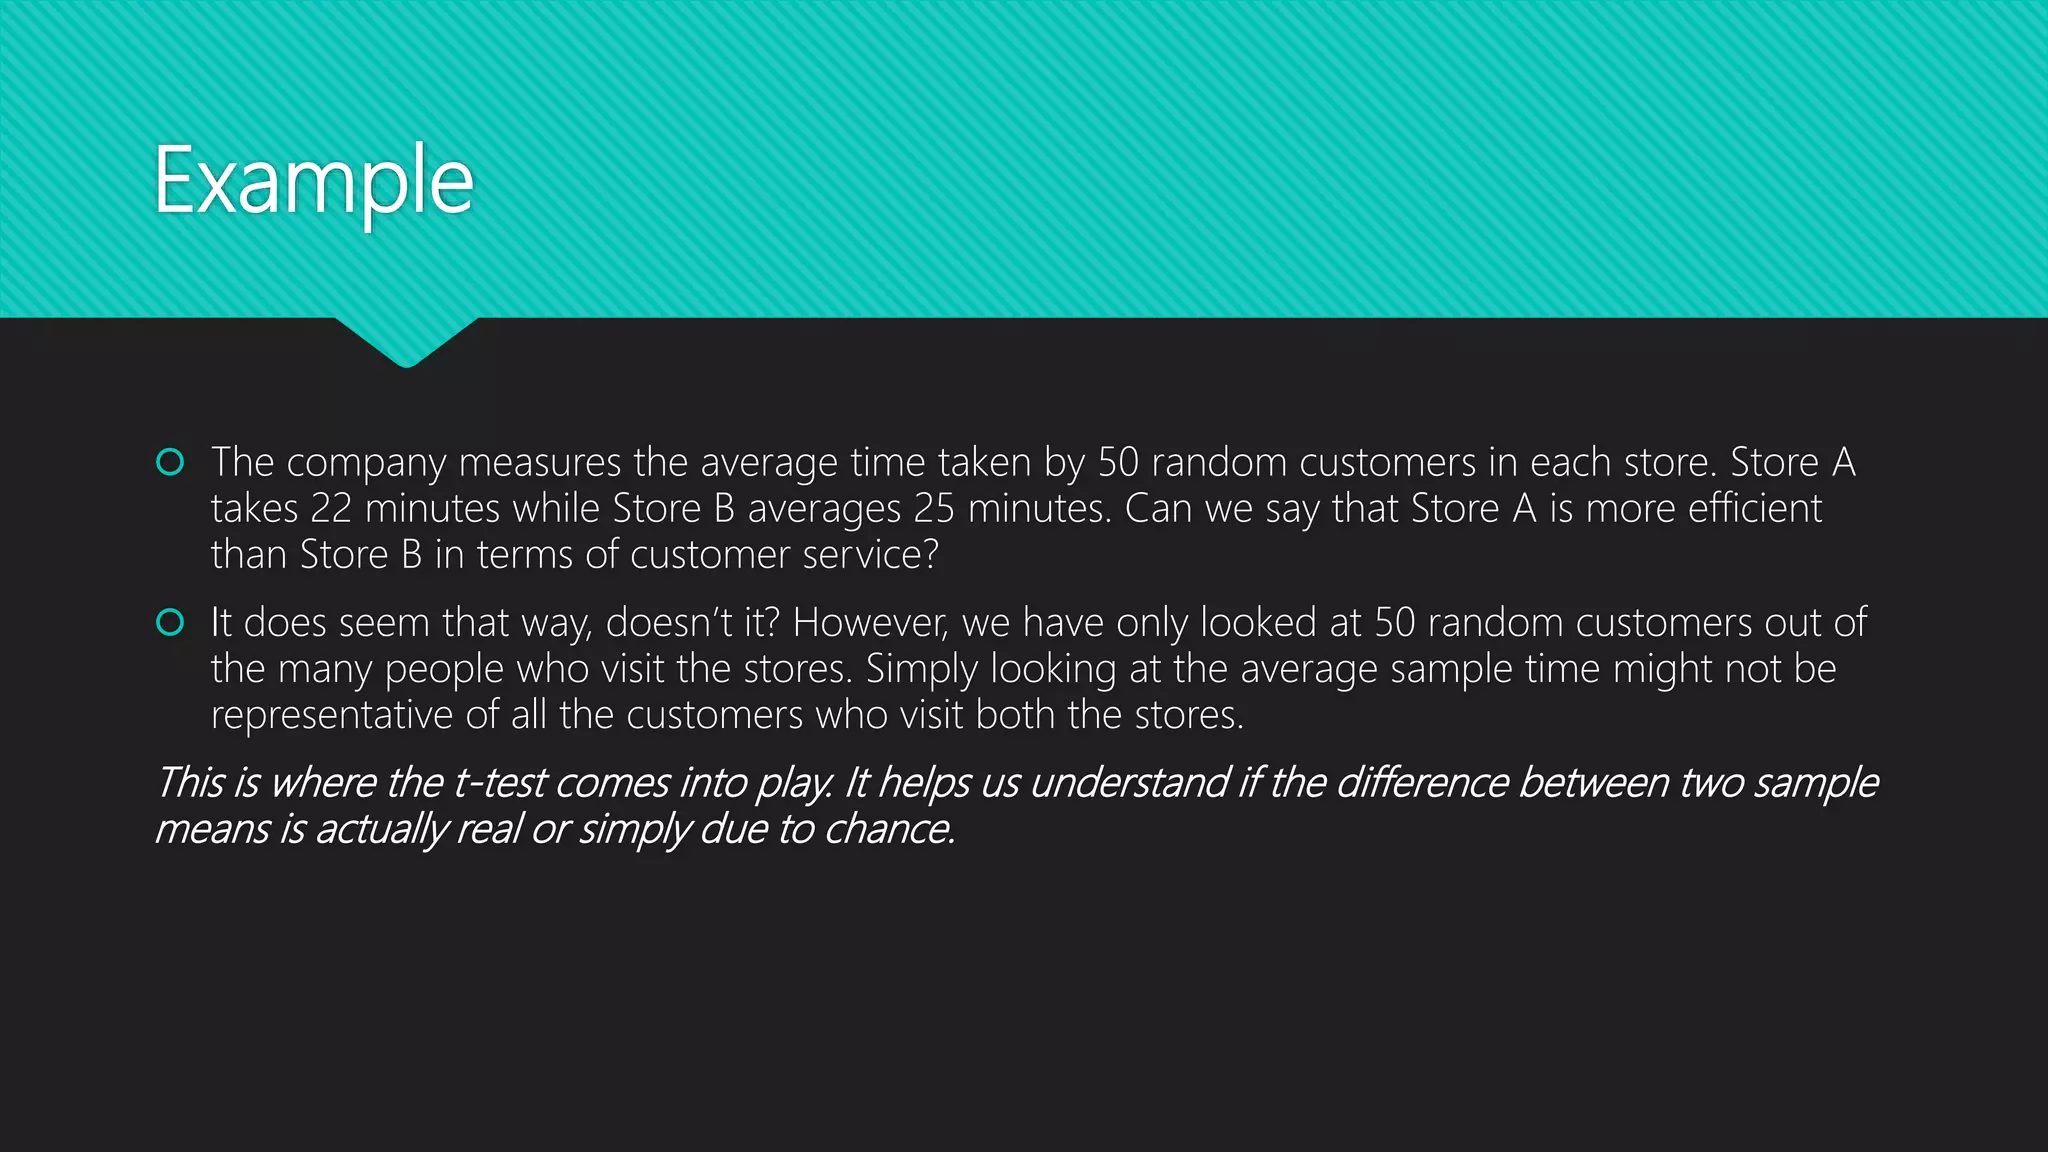
Example of a telecom company comparing service times at two stores using a t-test to validate if differences are significant.
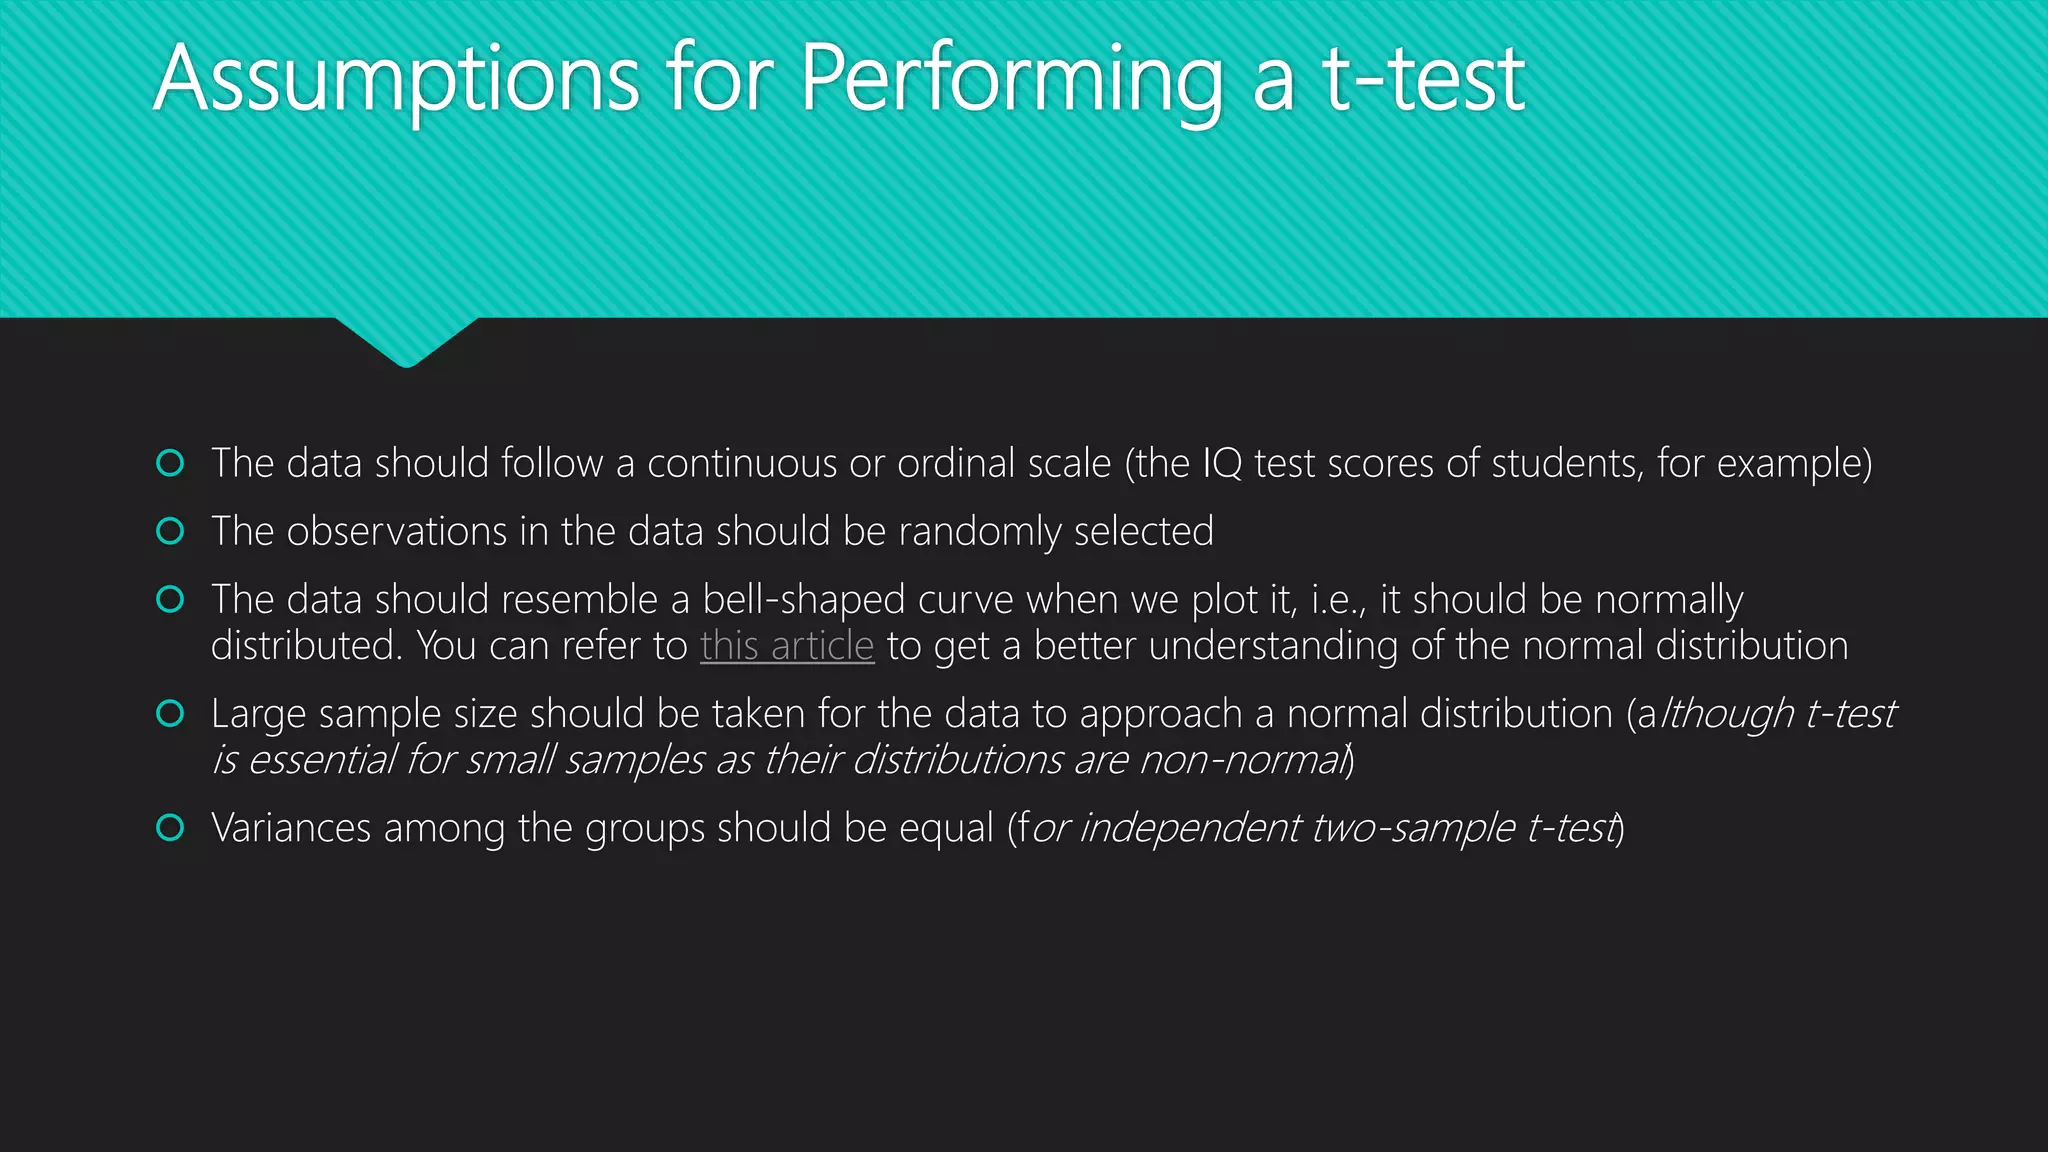
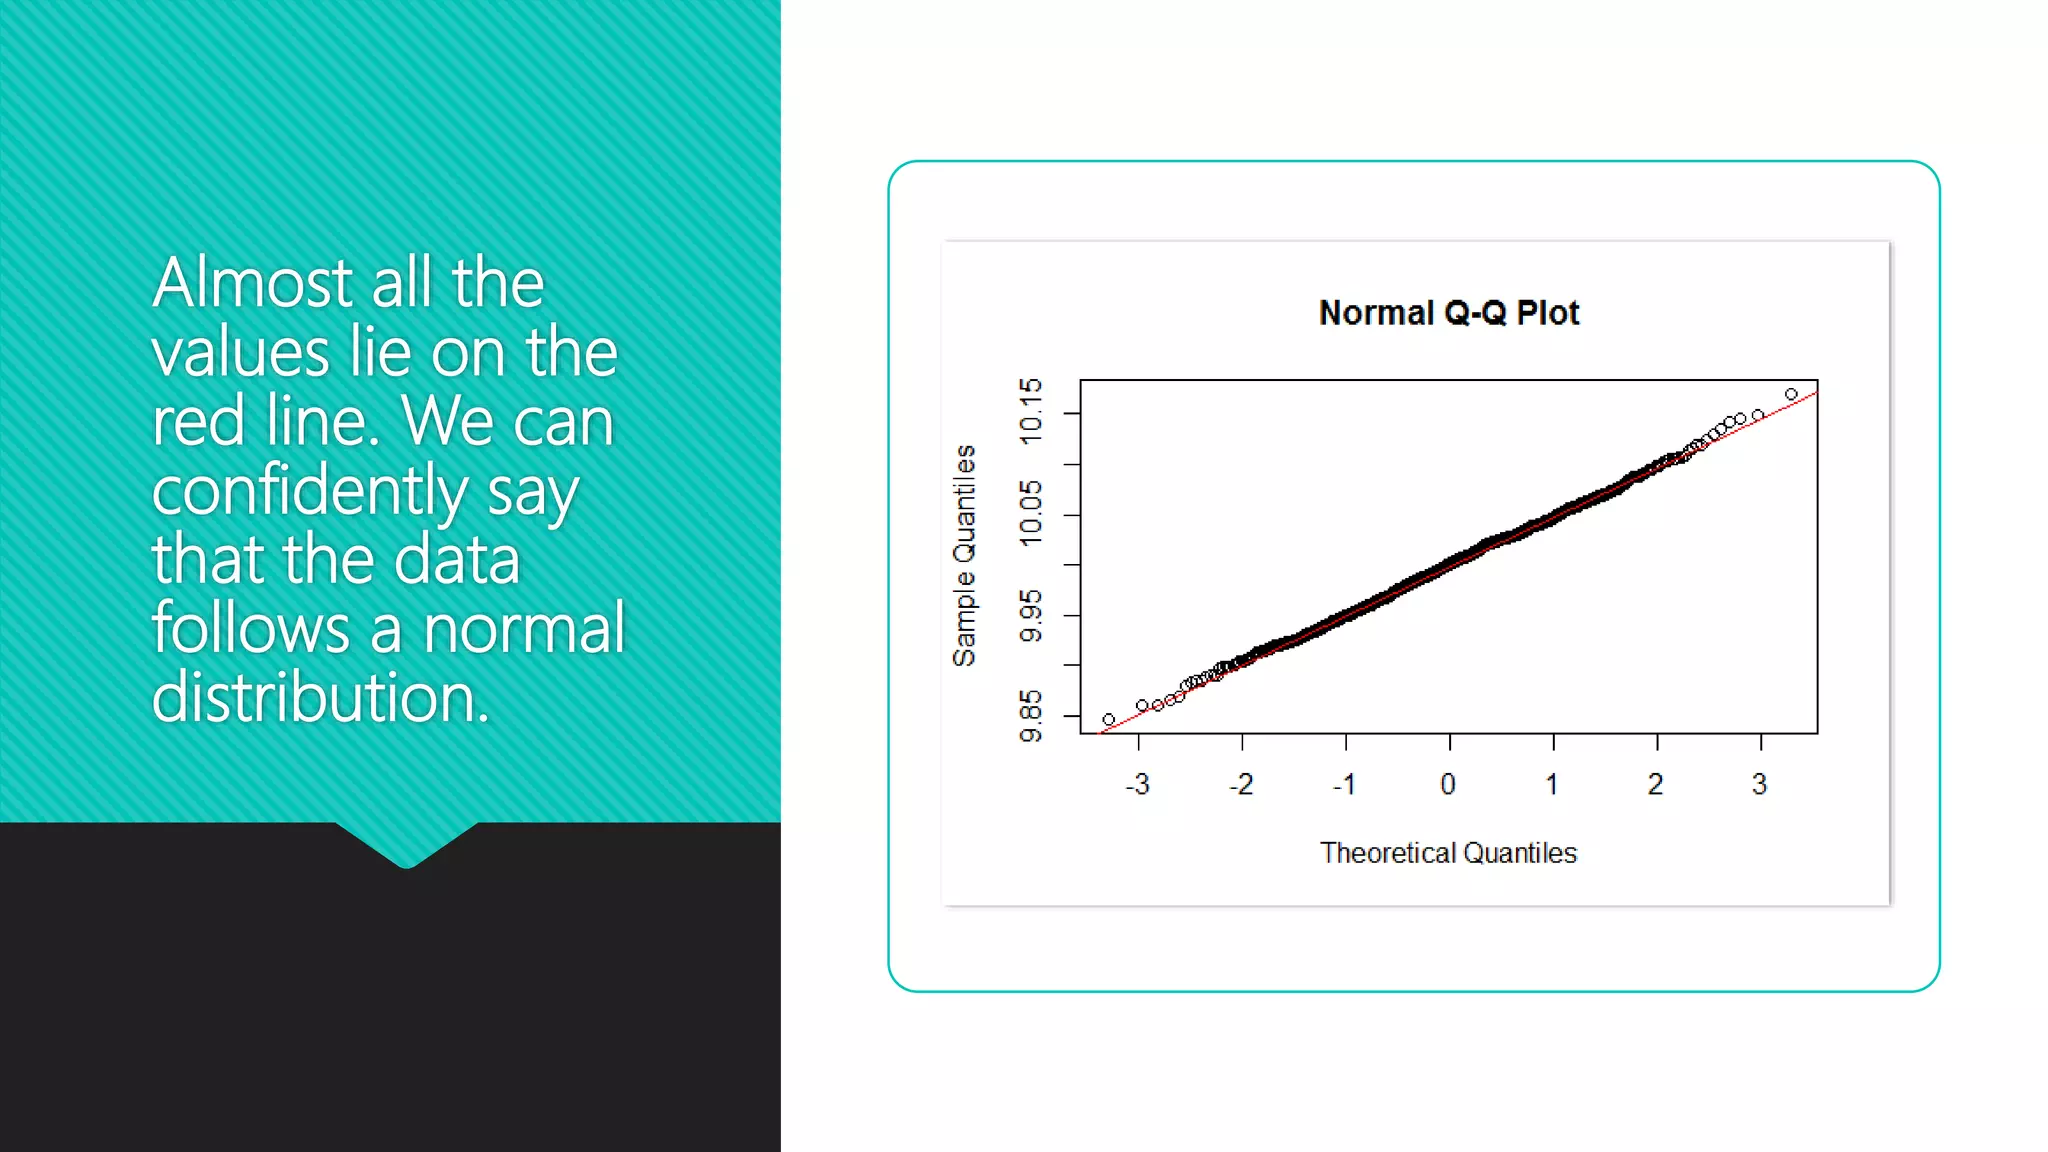
Key assumptions necessary for performing t-tests, including normal distribution, random sampling, and equal variances.
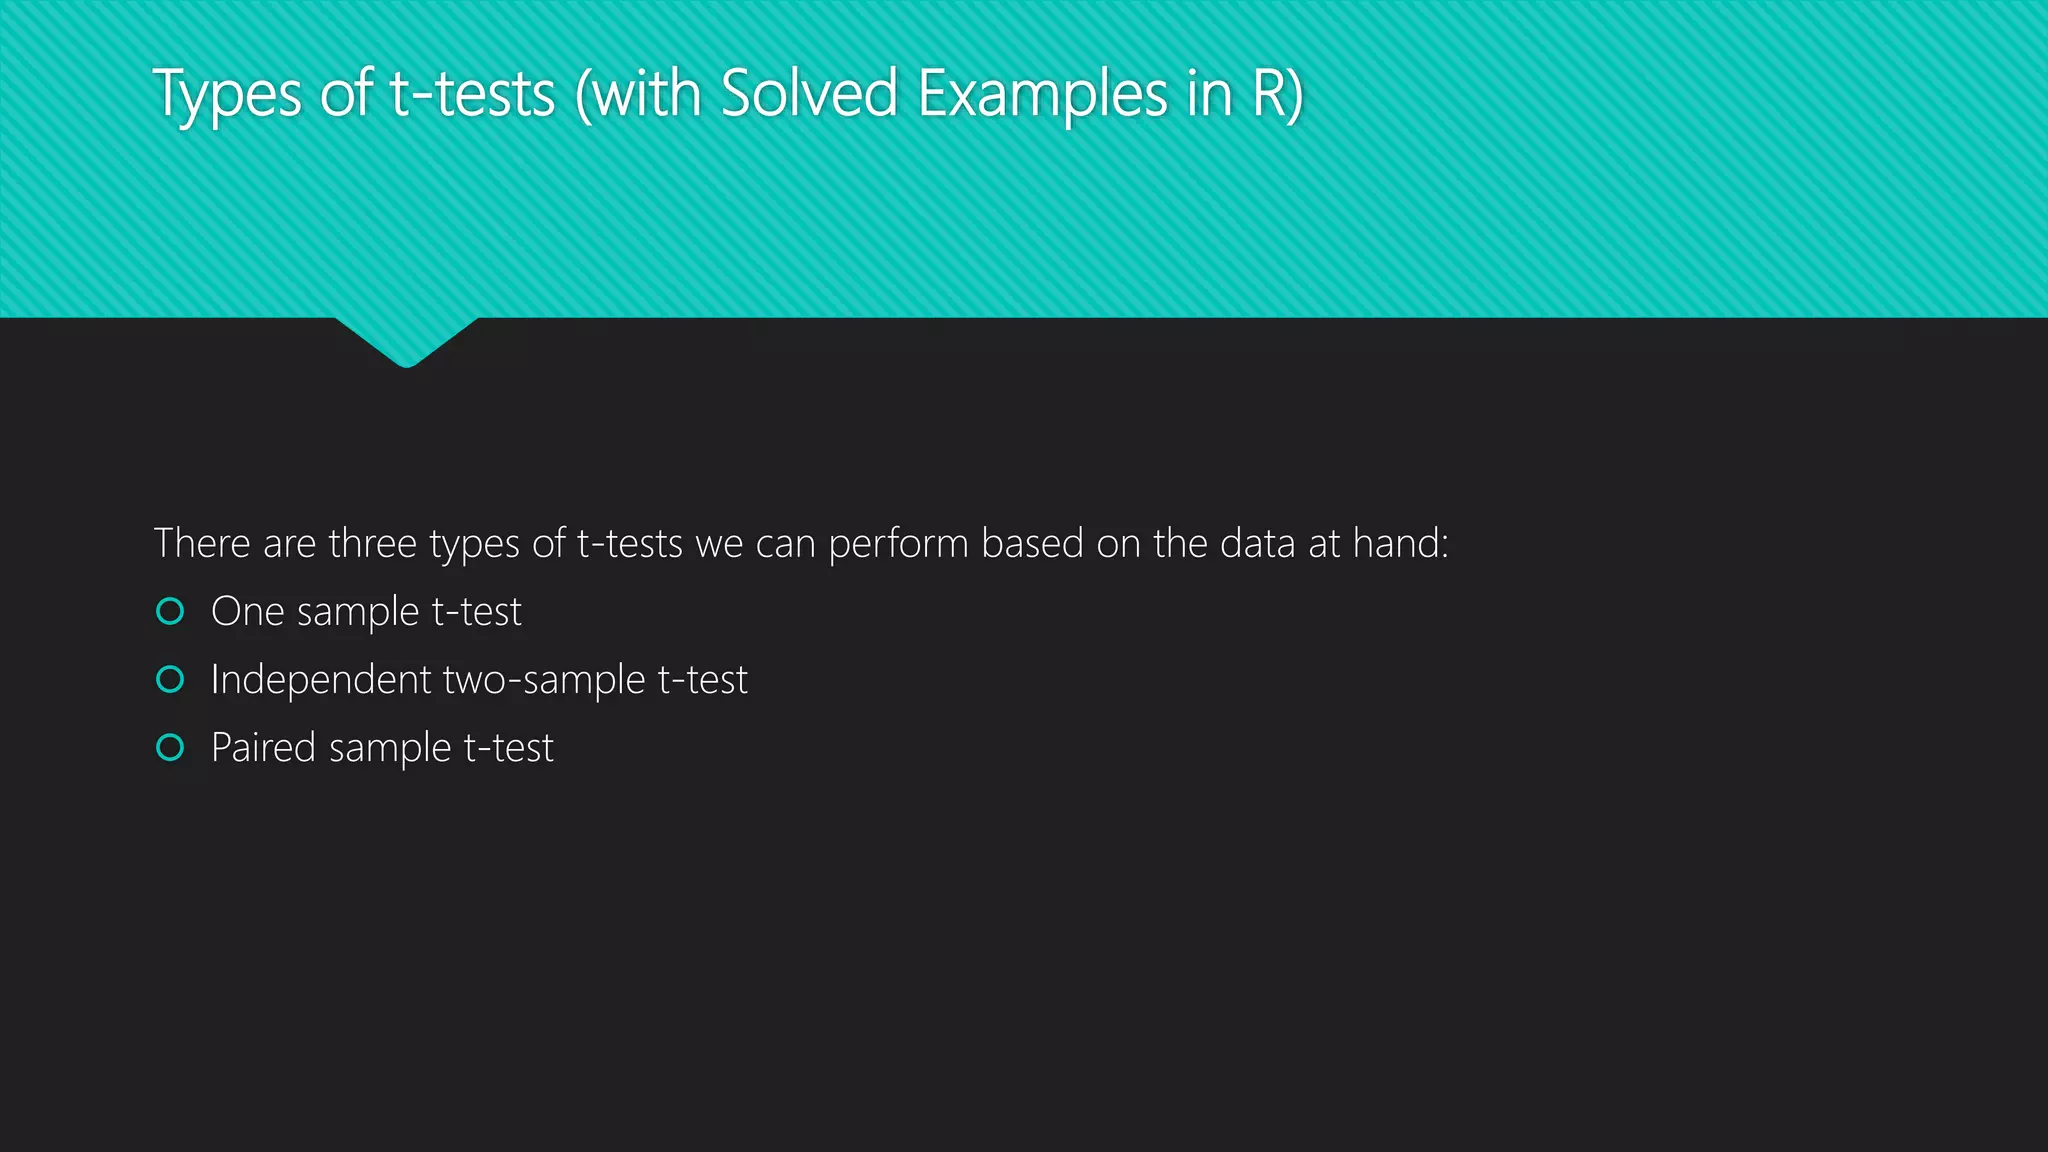
Introduction to three types of t-tests: One sample, independent two-sample, and paired sample t-tests.
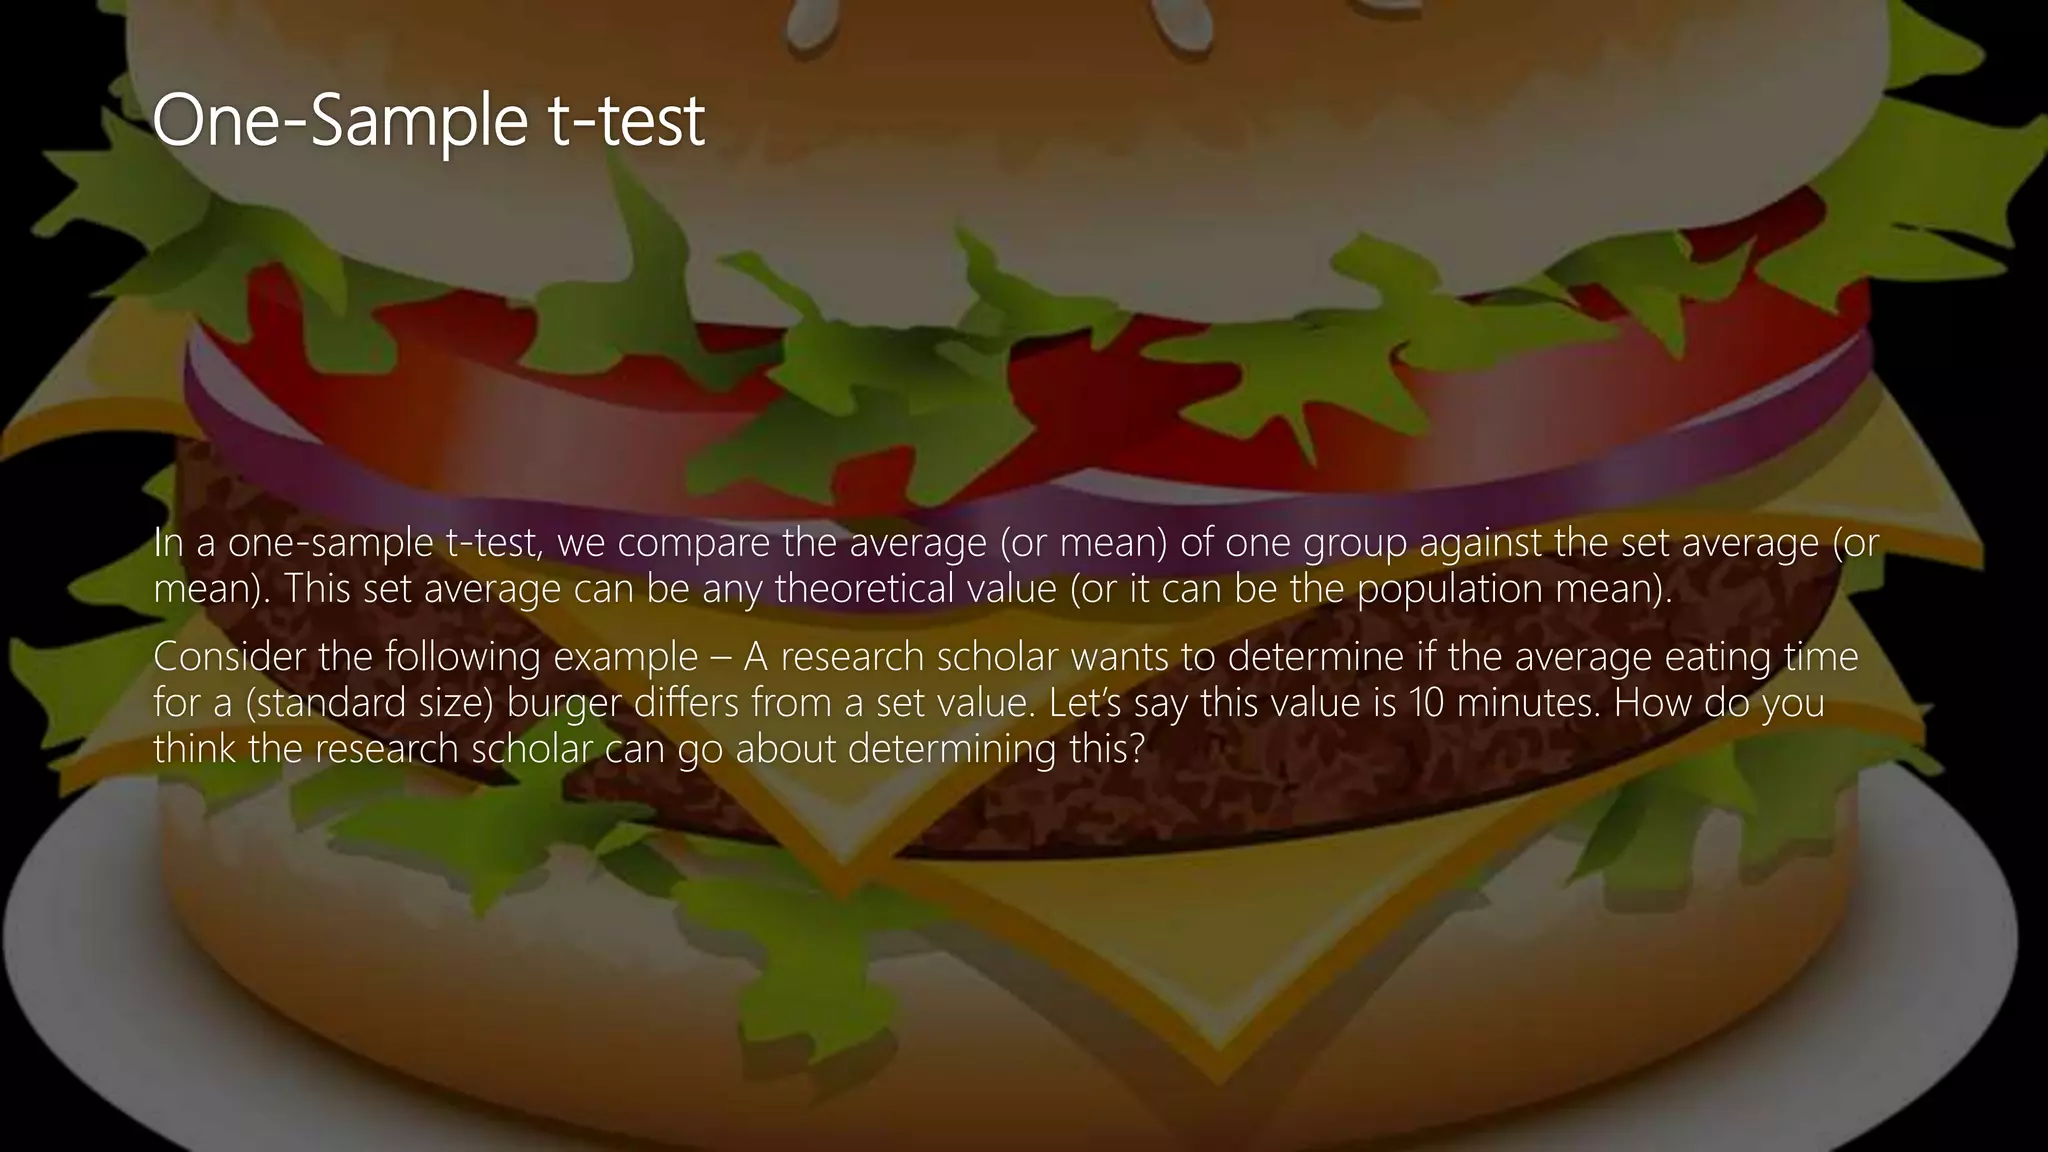
Explanation of one-sample t-test using an example of average eating time compared to a set value.
Formula for calculating the t-statistic in a one-sample t-test and the importance of comparing it with critical values.
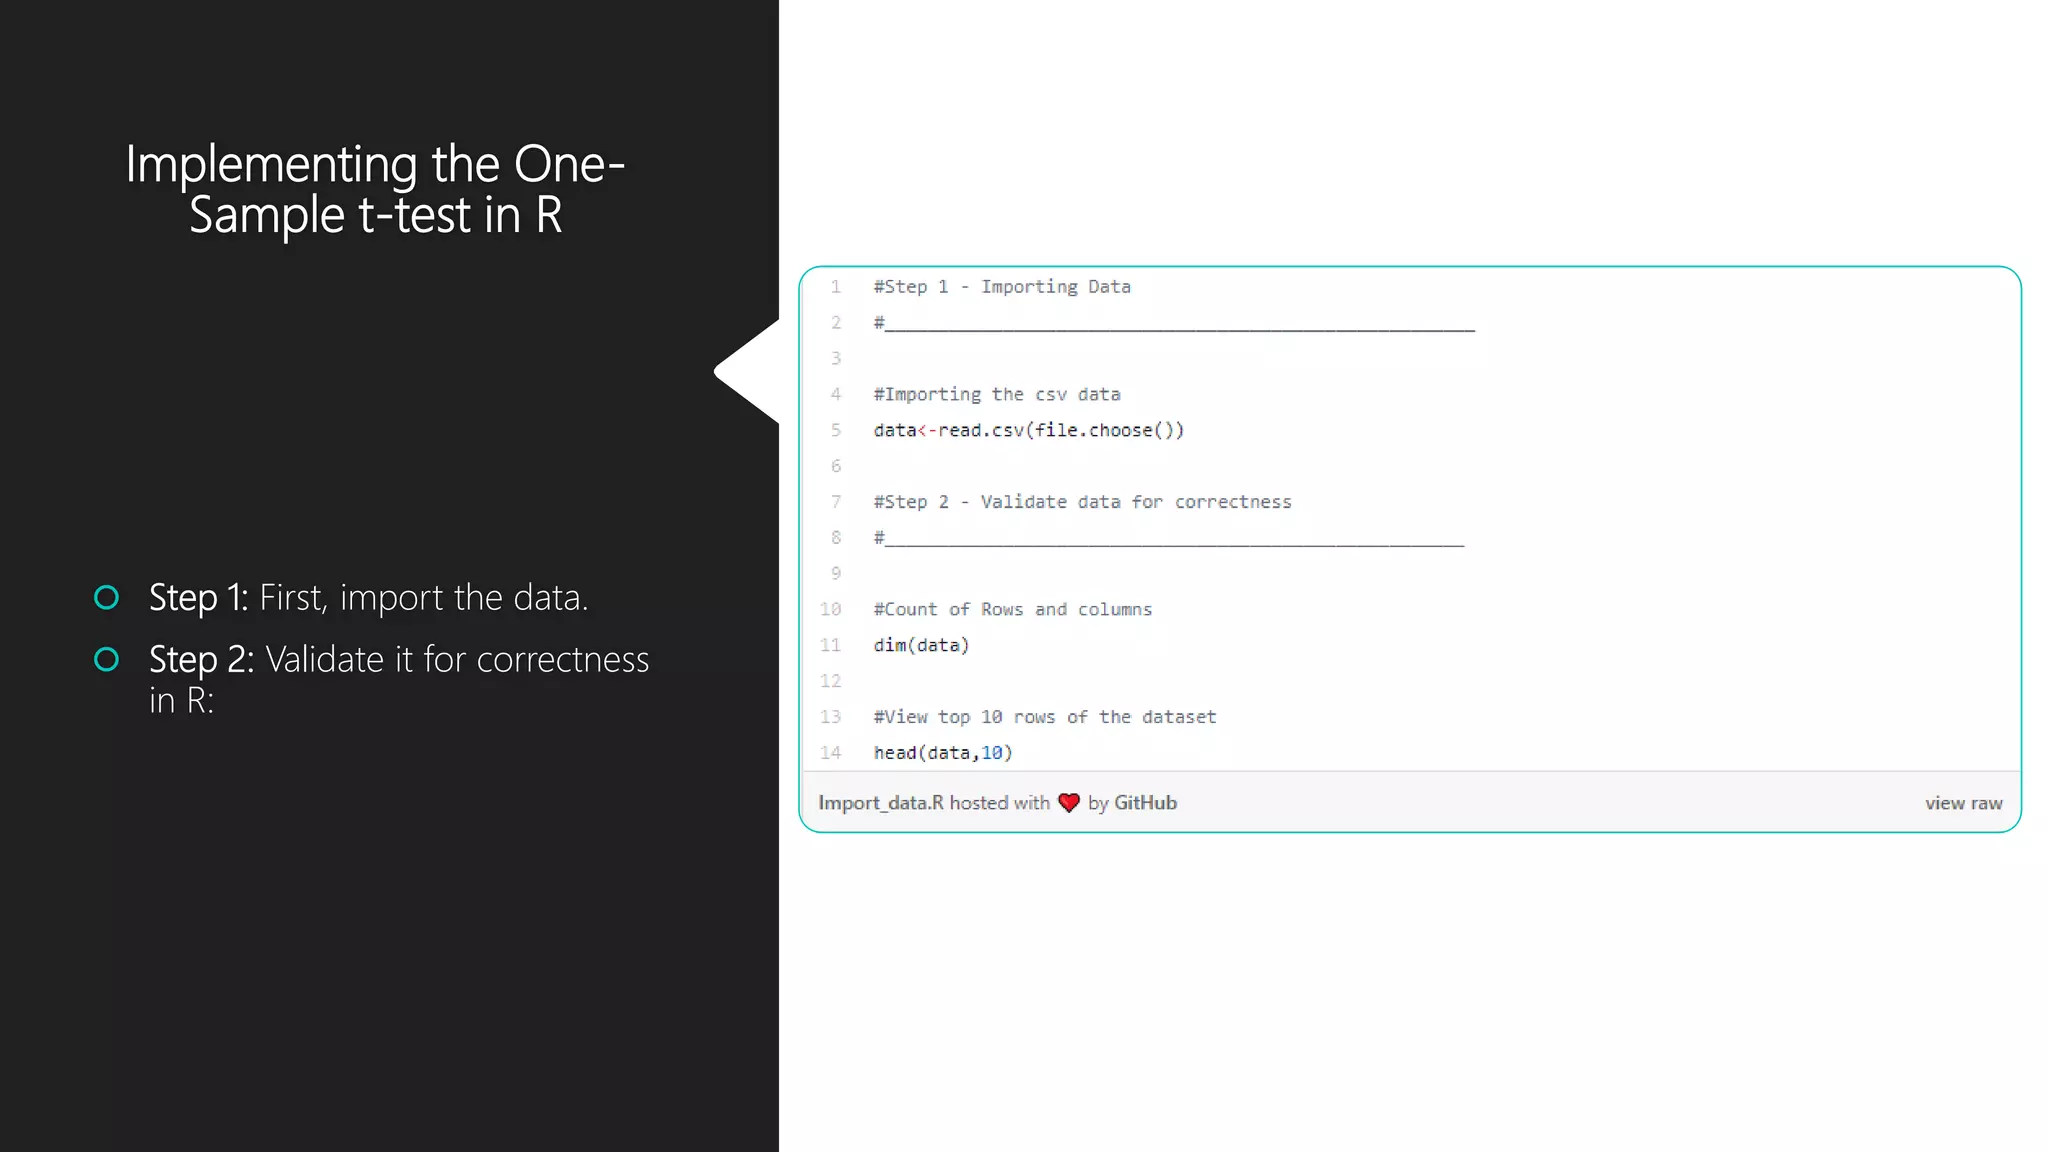
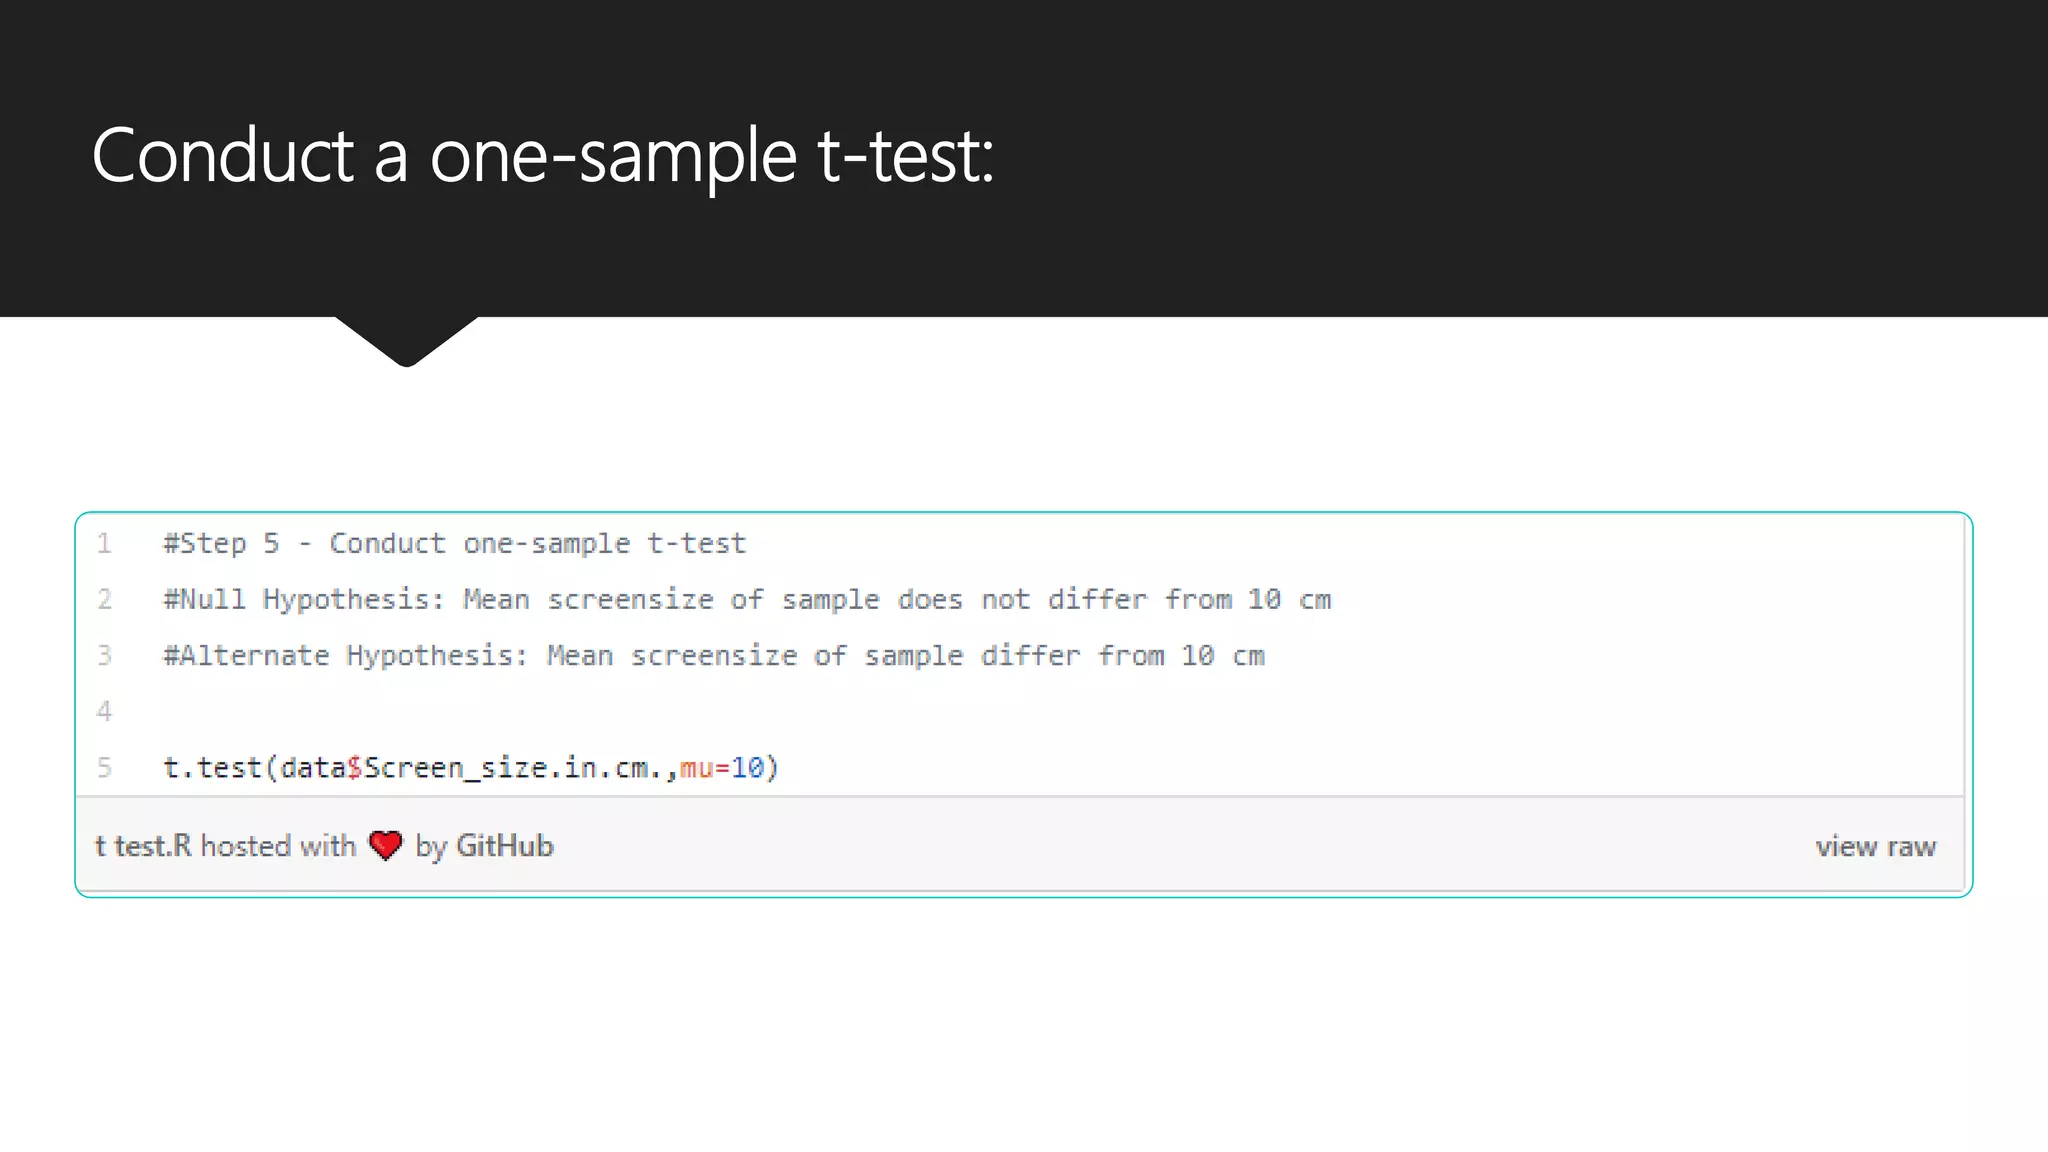
Step-by-step guide on how to conduct a one-sample t-test in R, including data import and assumption checks.
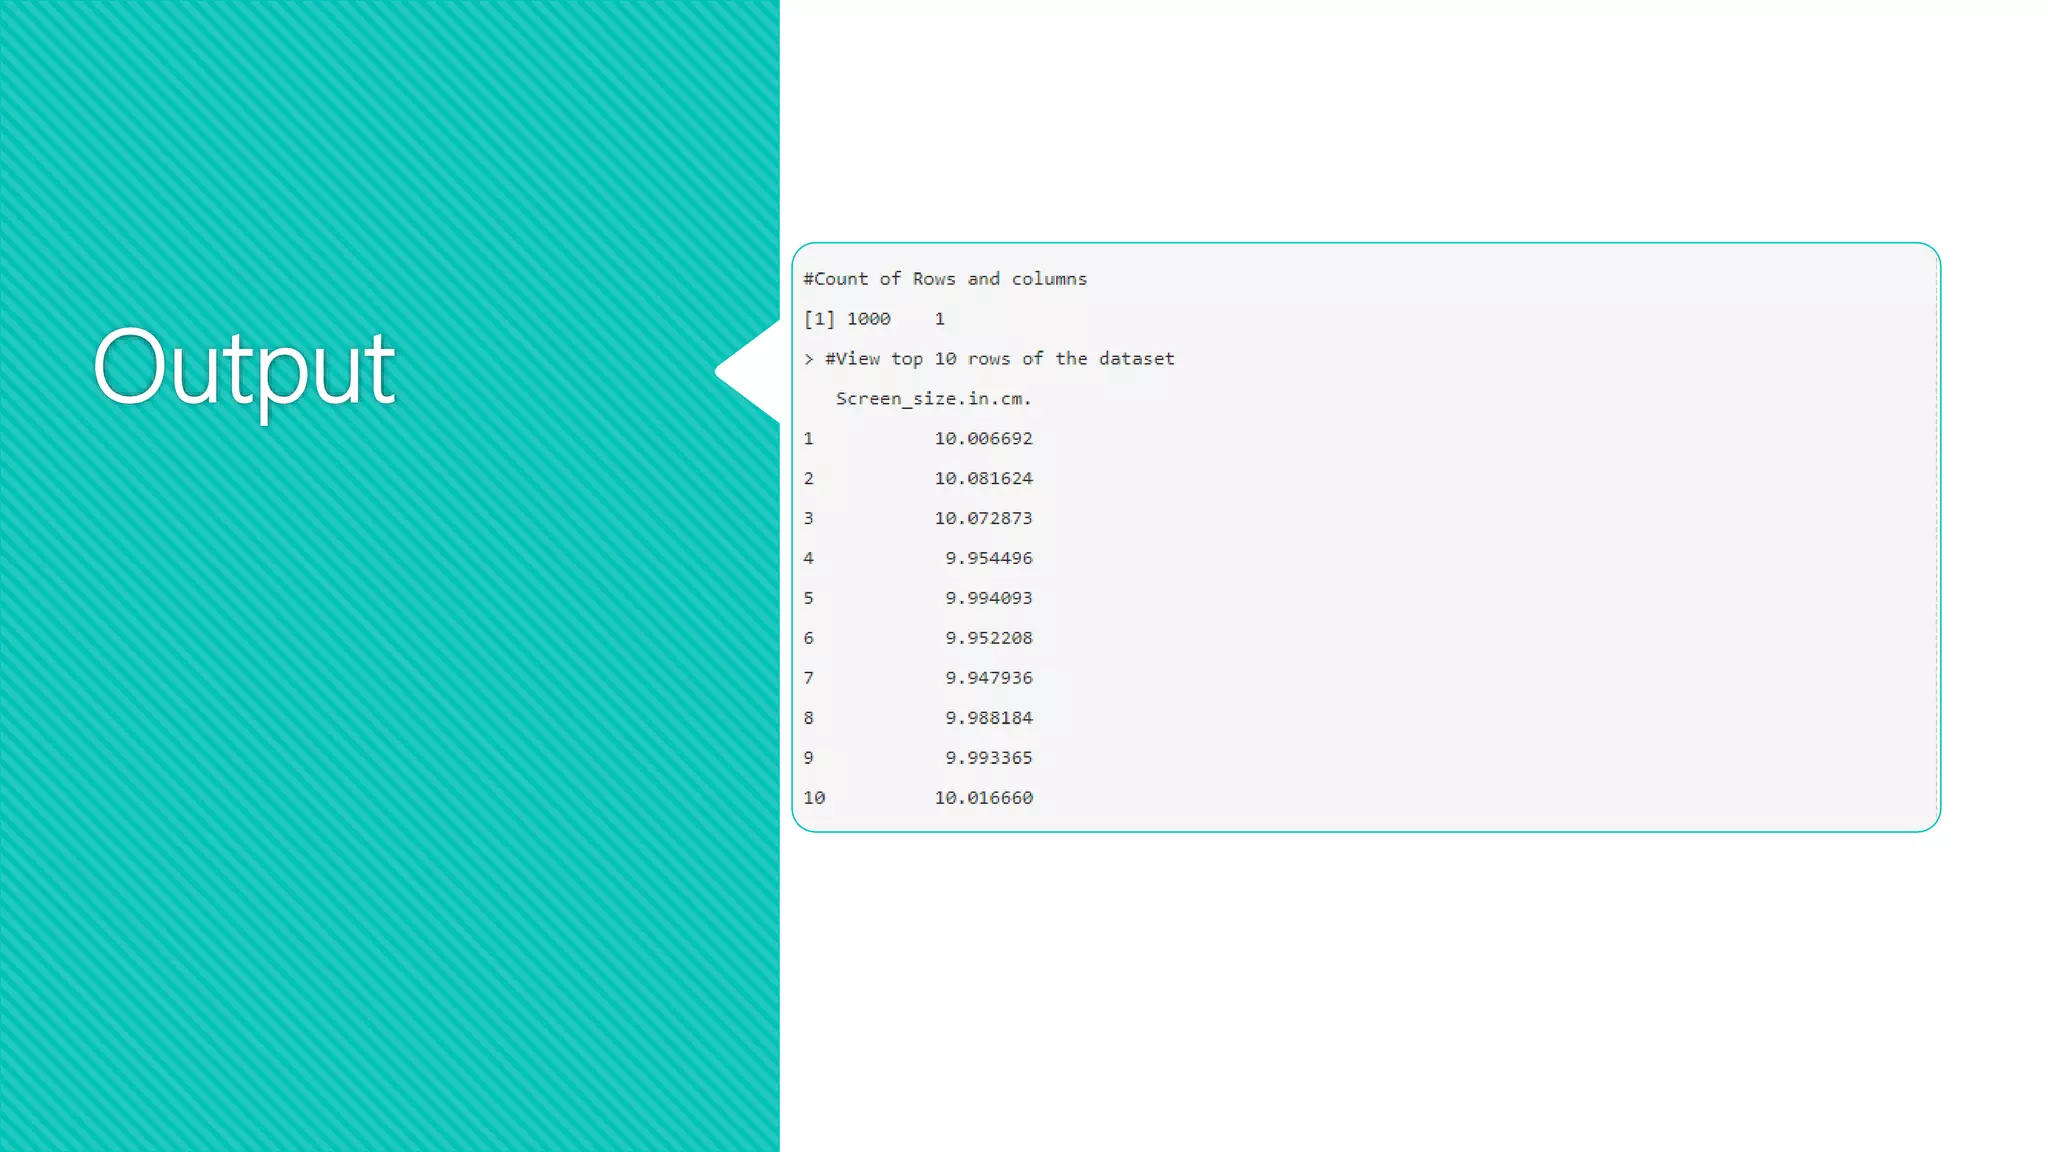
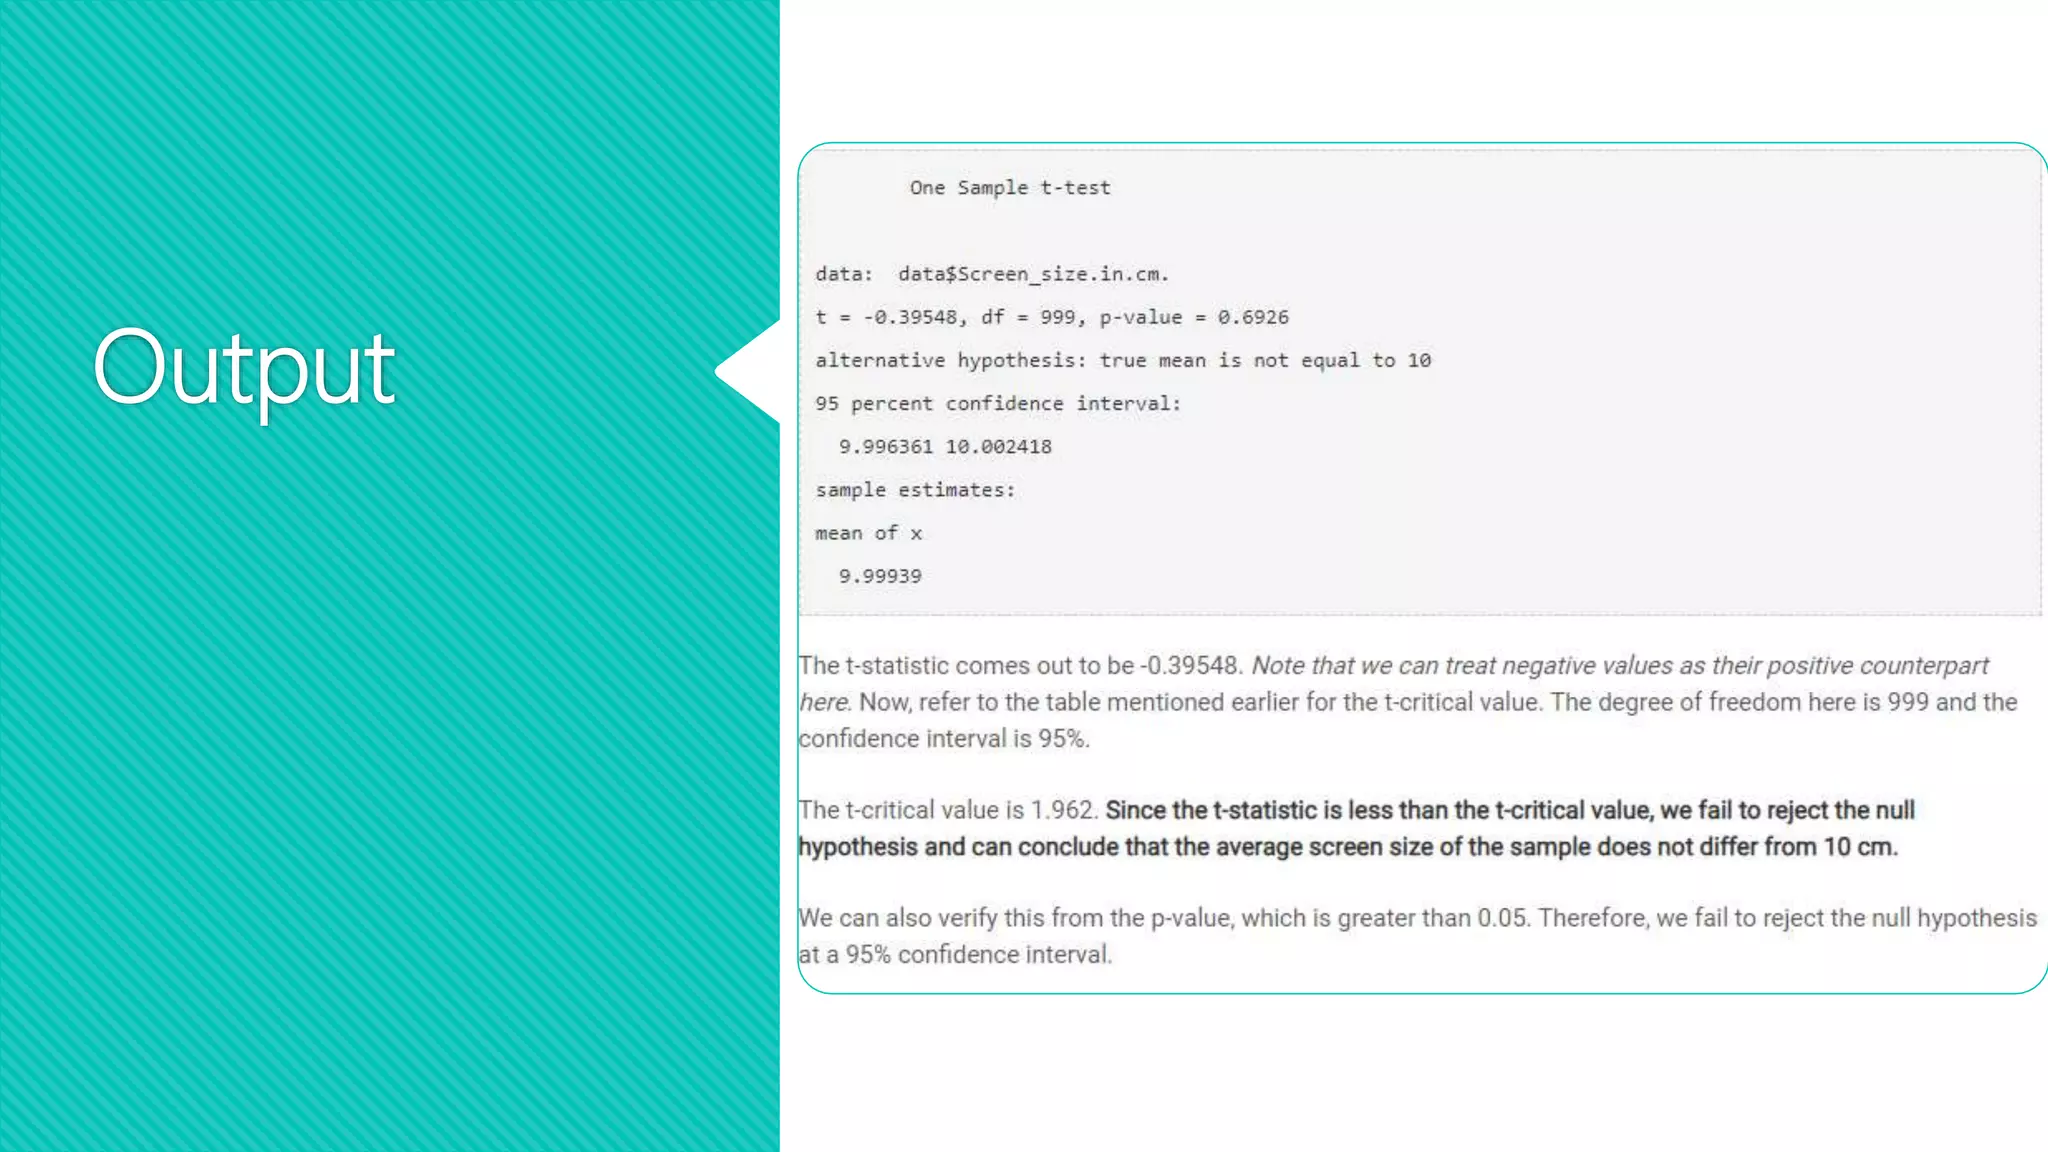
Output of the one-sample t-test conducted in R.


![[DSC Europe 25] Vid Stimac - Policy Parsimony: Between Oversimplifying and Ov...](https://cdn.slidesharecdn.com/ss_thumbnails/eqlepagzqp2rhg3gbluh-dsc-stimac-251120-251205090438-059e7f54-thumbnail.jpg?width=640&height=640&fit=bounds)


![[DSC Europe 25] Dragan Vucic - Building the Learning Organization - How AI Tr...](https://cdn.slidesharecdn.com/ss_thumbnails/8brigo2sbu6qur6gxrra-7-251205085715-6ae07d24-thumbnail.jpg?width=640&height=640&fit=bounds)


![[DSC Europe 25] Boris Perkovic - Lost in performance.pptx](https://cdn.slidesharecdn.com/ss_thumbnails/uq5hrp7vsuahqkxzifux-1-251204082258-fd2ee09d-thumbnail.jpg?width=640&height=640&fit=bounds)


![[DSC Europe 25] Max Talanov - Non digital NNs.pptx](https://cdn.slidesharecdn.com/ss_thumbnails/wif8tr3gtua74qvtopke-non-digital-nns-251205090438-26b0eea6-thumbnail.jpg?width=640&height=640&fit=bounds)

