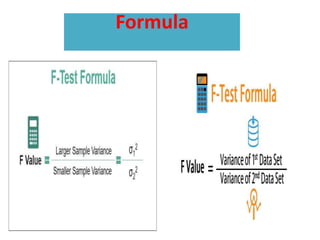
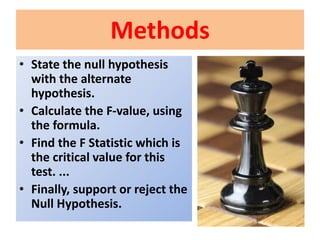
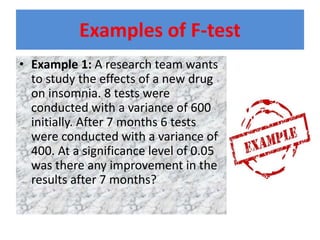
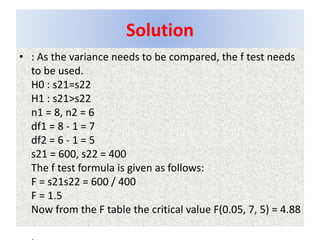
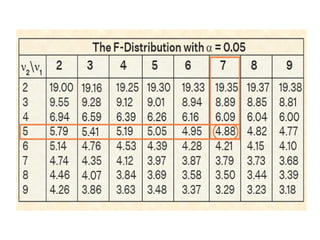
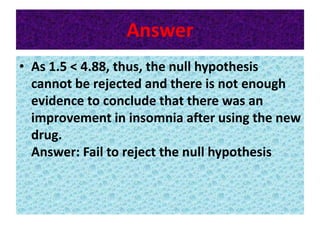
Synopsis
Introduction
defination
Formula and methods
examples
Merit and demerit of F test
Conclusion
References
Introduction
F test is a statistical test that
is used in hypothesis testing
to check whether the
variances of two populations
or two samples are equal or
not. In an f test, the data
follows an f distribution. This
test uses the f statistic to
compare two variances by
dividing them
Defination
“F test is the ratio
of two
independent chi-
square variance
divided by their
respective degree
of freedom”
Formula
Methods
• State the null hypothesis
with the alternate
hypothesis.
• Calculate the F-value, using
the formula.
• Find the F Statistic which is
the critical value for this
test. ...
• Finally, support or reject the
Null Hypothesis.
Examples of F-test
• Example 1: A research team wants
to study the effects of a new drug
on insomnia. 8 tests were
conducted with a variance of 600
initially. After 7 months 6 tests
were conducted with a variance of
400. At a significance level of 0.05
was there any improvement in the
results after 7 months?
Solution
• : As the variance needs to be compared, the f test needs
to be used.
H0 : s21=s22
H1 : s21>s22
n1 = 8, n2 = 6
df1 = 8 - 1 = 7
df2 = 6 - 1 = 5
s21 = 600, s22 = 400
The f test formula is given as follows:
F = s21s22 = 600 / 400
F = 1.5
Now from the F table the critical value F(0.05, 7, 5) = 4.88
Answer
• As 1.5 < 4.88, thus, the null hypothesis
cannot be rejected and there is not enough
evidence to conclude that there was an
improvement in insomnia after using the new
drug.
Answer: Fail to reject the null hypothesis
Merits of F test
• F-tests are surprisingly flexible
because you can include
different variances in the ratio
to test a wide variety of
properties. F-tests can
compare the fits of different
models, test the overall
significance in regression
models, test specific terms in
linear models, and determine
whether a set of means are all
equal.
Demerits of F test
• A limitation of the t
test was that the
amount of data that
was provided was slim
and therefore Samples
of larger amount of
values would more
accurately represent
the population.
Conclusion & References
• The F-test of overall
significance is the
hypothesis test for this
relationship. If the overall
F-test is significant, you
can conclude that R-
squared does not equal
zero, and the correlation
between the model and
dependent variable is
statistically significant.

F test mamtesh ppt.pptx

  • 1.
  • 2.
    Introduction F test isa statistical test that is used in hypothesis testing to check whether the variances of two populations or two samples are equal or not. In an f test, the data follows an f distribution. This test uses the f statistic to compare two variances by dividing them
  • 3.
    Defination “F test isthe ratio of two independent chi- square variance divided by their respective degree of freedom”
  • 4.
  • 5.
    Methods • State thenull hypothesis with the alternate hypothesis. • Calculate the F-value, using the formula. • Find the F Statistic which is the critical value for this test. ... • Finally, support or reject the Null Hypothesis.
  • 6.
    Examples of F-test •Example 1: A research team wants to study the effects of a new drug on insomnia. 8 tests were conducted with a variance of 600 initially. After 7 months 6 tests were conducted with a variance of 400. At a significance level of 0.05 was there any improvement in the results after 7 months?
  • 7.
    Solution • : Asthe variance needs to be compared, the f test needs to be used. H0 : s21=s22 H1 : s21>s22 n1 = 8, n2 = 6 df1 = 8 - 1 = 7 df2 = 6 - 1 = 5 s21 = 600, s22 = 400 The f test formula is given as follows: F = s21s22 = 600 / 400 F = 1.5 Now from the F table the critical value F(0.05, 7, 5) = 4.88
  • 9.
    Answer • As 1.5< 4.88, thus, the null hypothesis cannot be rejected and there is not enough evidence to conclude that there was an improvement in insomnia after using the new drug. Answer: Fail to reject the null hypothesis
  • 10.
    Merits of Ftest • F-tests are surprisingly flexible because you can include different variances in the ratio to test a wide variety of properties. F-tests can compare the fits of different models, test the overall significance in regression models, test specific terms in linear models, and determine whether a set of means are all equal.
  • 11.
    Demerits of Ftest • A limitation of the t test was that the amount of data that was provided was slim and therefore Samples of larger amount of values would more accurately represent the population.
  • 12.
    Conclusion & References •The F-test of overall significance is the hypothesis test for this relationship. If the overall F-test is significant, you can conclude that R- squared does not equal zero, and the correlation between the model and dependent variable is statistically significant.